Day 4 at the 18m Nationals in Nephi and Region 9 Sports Class in Nephi. The 18m pilots are not even half-way into the contest and it feels like we’ve already been here a long time.
Maybe that’s because today involved a lot of waiting – either on the ground or in the air. The Sports Class went up first and was sent on their merry way. They had a big 3 hour task to complete.
The plan for 18m was a 524 km Assigned Racing Task with fixed turnpoints at Table Mountain, Star Point, and Indian Ranch. After two thirds of the fleet was launched on Runway 17 the wind switched from south to north and that meant that those left on the ground had to move their gliders to the other end of the runway. Launching fully ballasted gliders with a tail wind at a mountain airport in the summer with density altitudes of 8000 feet or more is definitely not a good idea.
I was among those already up and flying. I escaped the gaggling crowds by taking a convergence line to the northeast where I could float along on my own. I knew the wait would be substantial and my plan was to conserve mental energy.
Eventually everyone was in the air but by then it was past 3pm and it was evident that starting out on a more than 500km task was likely to get pilots in trouble. Table Mountain was switched out for Monroe Peak, which shortened the task to about 440km. Still an ambitious plan, especially given that the cumulus clouds were projected to dissipate and give way to blue skies by about 5 to 5:30pm. Pilots had to confirm their understanding of the new task in a roll call and reprogram their flight computers in the air. I parked myself in a weak lonesome thermal so I could do the data entry without attracting the crowds.
The gate eventually opened at 15:27 and by 15:32 I had climbed back from our tag altitude of 12,000 to 17,000 feet in a 12 knot boomer and was out on course ahead of anybody else. I had had ample time to check the conditions out on course and knew where to fly. The first leg was blazing fast. I cruised at 100 kts and only stopped twice to climb back towards the clouds, being very careful to stay below 17,500 feet to avoid airspace penalties. The lift can get so strong in the west that keeping the glider down can be a real challenge. I even briefly opened my airbrakes as I was cruising through exceptionally strong lift to avoid getting sucked up to forbidden heights.
Getting in and out of turnpoint one was easy in soaring terms but a big challenge with respect to traffic. The best lift line in and out was the same and since I had started out ahead I had to avoid a lot of conflicting traffic. I deliberately flew a line that was far from ideal to stay clear of the gliders that were streaming towards Monroe Peak.
Leg two started out quite well also. My average task speed up to this point was 162 kph and the day was at its peak. Looking ahead I had to make a choice between two possible lines to TP 2. One was on the western edge of the Wasatch Plateau, the other was to the east of the plateau over the eastern desert. For a while I thought I would take the easterly line because it seemed much better defined and Skysight had predicted strong convergence east of the plateau.
However, it soon became evident that the easterly line was too far east. When a few additional clouds popped on the western edge of the plateau I decided to stay there. This had the added advantage of easy access to safe landing areas in the Manti-Ephraim valley whereas the eastern side of the plateau is a lot less hospitable.
Unfortunately the climbs along the western edge of the plateau were nowhere near as good as those along the first leg and there was also considerable sink in-between which quickly destroyed any hard-earned gains. I struggled to find a good line and my average task speed dropped below 150kph. Except for the western edge, the plateau itself was largely blue and I had to get high to safely cross. A mediocre climb near Mt Baldy got me back up to 17,000 feet and that’s where I started the transition towards Star Point.
The plateau is super scenic but from a soaring standpoint it was somewhat disappointing. As I got near Start Point I spotted a big gaggle and rushed towards it only to find that the lift averaged only 1-2 kts. Nothing kills your task speed faster than remaining stationary in a weak climb. I left to round the turnpoint and kept looking for better air. The wind was from the west and I wanted to have more altitude for the transition into the wind.
I found a line of good air that allowed me to progress westwards without dropping out of the sky. Back on the west side of the plateau the clouds were disappearing fast. I followed the ridge lines and tested the bowls but could only find 2-3 kt climbs at first. Things got a bit better as I moved further south where I found a good climb east of Manti-Ephraim. I tanked up for the next transition via the southern tip of the San Pitch Mountains which have worked for me before late in the afternoon.
Today there was not much there there, and I moved on towards the Pavani Range. Fortunately I was high enough to cross the ridges and fly on the sun-facing west side towards the last turnpoint. I was several thousand feet short of final glide and had to find another climb. I joined another glider but the lift died after the first turn. Onwards. I was getting low and the lift was getting weak so I began to dump water ballast.
Two minutes later I hooked a 6-7 kt climb south of Scipio. I quickly closed the water dump valves again and was able to climb a few thousand feet to get to final glide altitude at MC4.
I noticed other gliders taking a direct line towards Nephi but felt more comfortable taking a small detour via the foothills of the San Pitch Mountains that had been baking in the afternoon sun. I have had good success in the past stretching my final glide along the rocks.
The ridges weren’t as strong as hoped but they did enough to get me home. Which means I did win the race against the end of the day…
Once again I am astonished at the winners’ speeds of more than 100 mph (162 kph). Sean Fidler won the day ahead of John Seaborn. That is also the current standing overall. My speed of 130 kph (again!) put me in 24th place for the day and 25th overall. The stragglers among us have a private competition going where there are some exclusive prizes to win such as Strudel and Krautfleckerl. Feel free to ask me about that…
Day 3 at the 18m Nationals in Nephi. The weather forecast promised strong lift, increasing thermal heights, especially to the south, light winds, and nice cumulus clouds throughout the entire task area. The only question mark was the possibility of overdevelopment. But no thunderstorms.
The task committee gave us a lot to work with by declaring an AAT with 3 hour minimum time and two big turn areas at Delano Peak in the Tushar Mountains and Lamersdorf Peak in the Wah Wah Range.
The Region 9 Sports Class launched first today so the tow planes would have less fuel on board for towing the heavy 18m ships which are all laden to the legal brim with water ballast. If conditions are this good, you want your glider to be as heavy as allowed so it will glide further at high speeds.
When our turn came the day was fully developed and I caught a 9 kt climb off tow that took me all the way to cloud base in no time. Then I went to explore the clouds to find out if there was a pattern for lift and sink distribution below our puffy friends. As expected, the best lift tended to be on the south-west side, which was upwind and facing the sun.
I was itching to get going and when the gate opened I was among the first to cross the start line. I figured the fast guys would catch up to me sooner or later and I would get plenty of company soon enough. The first clouds were lined up well and I knew where I wanted to go and was able to enjoy my glide out in solitude.
The start went quite well but after maybe 30-40 km the clouds were not working nearly as well as they had before. I noticed a convergence line on the east side of the Canyon Mountains that was to the west of the clouds and that helped me along until I found a good climb south of Williams Peak.
From there I tried to stay high as I saw some of the Sport Class gliders struggling low along the Pavani Range. A small wildfire had just started above one of the ridges north of the Kanosh Canyon and that was one more reason to stay very high in case a TFR would be declared (this did in fact happen later in the afternoon). Far below were a few paragliders directly above the fire getting smoked.
I tried to leave the area as quickly as possible and flew to the east of the Tushar Mountains to get a bit deeper into the first turn area. These mountains are absolutely spectacular. Several years ago I participated in a trail marathon that went all the way to the top of Mt. Delano – one of my most demanding foot races. I always marvel how easy it is to climb these mountains in a glider by comparison.
This was also the section were I was being passed by the fast guys who had started later than me. They kindly marked two good thermals for me that took me all the way to 17,000 feet. Thank you! The fastest pilots kept going further south and I decided once again to fly my own race and took a promising line to the west towards the second turn area. My flight computer predicted 30 minutes overtime even if I would only scratch the second turn area so I figured I had gone far enough to the south anyway.
I got some great views crossing the Tushars from east to west, heading past Beaver towards Lamersdorf Peak. I found a good climb over the Mineral Mountains just west of Beaver and the clouds continued after a modest blue hole to the west.
I got into the second turn area and my flight computer still showed 28 minutes of overtime. A great looking line of clouds curved directly into the direction to the finish. The computer said I would need to fly 202 kph average for the rest of the task – the remaining 188 kilometers or 115+ miles – to arrive on time.
That speed seemed inconceivable to me so I turned north towards the finish.
At MC4 I was about 6000 feet below final glide path but the line of clouds ahead looked excellent and I was sure to find some good climbs along the way.
Well, the clouds were even better than expected. I remembered that the line was the result of two convergent winds: a southerly wind to my right, and a more westerly wind to my left. These two wind streams were coming together, pushing the air up along the way. The result was a lift band that stretched all the way from the second turn area to the finish more than a hundred miles to the north.
All I had to do was stay relatively high along the west side of the clouds and the convergence propelled me forward while the tail wind pushed me along. It was a spectacular part of the flight because it was so easy. I just continued straight, slowing down in the strongest parts of the lift and flying faster in the weaker parts.
I continuously gained on the final glide path and the predicted overtime got shorted and shorter. My ground speed started to exceed 200 kph and soon I started to wonder if it was in fact possible that I might come back below minimum time if the line were to continue.
Well, continue it did. By the time I was abeam Filmore my flight computer showed that I had reached final glide altitude at MC4 and when I reached the Canyon Mountain it was obvious that I would arrive too early and too high. I put the Ventus in speed flaps and pushed the trim all the way forward to run 130 kts and I just kept the nose pointed at the finish.
I eventually reached the finish cylinder about 800 feet high and arrived with almost 5 minutes below minimum time. That’s unfortunate because it means my average speed for the flight was only 142kph instead of the actual 146 kph. (This is because the flown distance is divided by the minimum time and not the actual time if one finishes early.) (My average speed for the entire 188km final glide was 214 kph.)
But it was great fun nonetheless. For the future, I just have to take the possibility into account that a great looking line might work even better and allow for an even greater time cushion. It would not have been hard to go a little deeper into either of the two turn cylinders.
Today’s winner was Rick Indrebo with a speed of 163 kph, closely followed by Sean Fidler and Bif Huss. Rick and Sean also took the lead overall closely followed by John Seaborn who is in third overall.
My daily score today was 872 points, a good improvement over the first two contest days.
Day 2 was a day of contrasts at the 18m Nationals and Region 9 Sports Class Contest. The 18m class was sent off on a three hour minimum Assigned Area Task (AAT) with three 30 kilometer turn cylinders at Crispy, Drum Mountains, and White Pine Peak.
Skysight predicted very strong conditions along the airmass boundary separating the western desert from the ridge lines of the Rocky Mountains. The task looked like a triangle but one could almost turn it into an out and back race to take full advantage of the lift line along the Pavani Range. To do that one would have to go deep into the first turn cylinder near Mt Delano in the Tushar Mountains, then backtrack north, head west and nick the second turn area, only to return to the mountains and go deep again in the third turn cylinder before heading back north again towards Nephi along the same line.
This would minimize the time in the blue and maximize the time spent flying straight under the cloud shelf marking the convergence.
I suspect that many pilots had similar ideas for the day and one of my pre-take off concerns was the back and forth traffic along the same cloud street. The sky is a big place but all soaring pilots look for the best lines of lift as marked by the clouds and that can lead to high-speed head-on traffic along the same routes and at similar altitudes.
John Seaborn, the defending 18m Champion and yesterday’s winner confirmed my thoughts but added that the best laid plans usually go the way of the waste bin as soon as one gets a look at the sky in flight. How right he would be.
After some start delay with the usual intense pre-start gaggles the first leg looked just as promised. But this only held until Filmore, about two thirds towards TP1. The further south we went the darker the skies became and my plan to get almost to the Tushars went by the wayside as soon as a pilot ahead reported lightning strikes near Mt. Delano. Storm clouds can produce amazing lift but they are not my cup of tea. I watched the leaders head into the dark overcast, flying between rain shafts and decided that this wasn’t for me. I only nicked the turn cylinder and instantly new what this meant: I had to alter my strategy and go much deeper into the western desert than I had intended – otherwise I would finish well below under minimum time.
Fortunately there were some good clouds along the first part of that third leg until the Big Blue Hole appeared that Skysight had forecast. The next clouds were perhaps 40-50 kilometers away, over a line of hills in the distance. I tanked up under the last cloud and then went out into the desert, dialing my speed back to 80 kts. By now the leaders who had flown deep into TP1 caught up to me and so I had some company. At this point this was quite welcome for I knew the pilots in front would mark any good lift ahead.
However, the air across much of the blue hole turned out to be completely still. I could have let go of all controls and the glider would have flown on its own. There was even time for contemplation. Flying a glider usually involves rapid decision making, with decisions often taken every few seconds. But now I flew over flat, largely featureless desert. I had pointed the glider to the next clouds and all I could watch was the variometer for any indication of lift or sink to make small adjustments to my glide path. For some time there was neither. My altitude slowly trickled away but the task setters had done us a huge favor by setting a course that would allow us to keep Delta Muni in glide.
By the time I reached the next clouds I had only used up a bit more than 3000 feet of altitude. It’s amazing how efficient our machines are in the air. Fortunately the clouds on the other side worked reasonably well. In hind-sight I was a bit too conservative accepting mediocre lift at first before I gained enough confidence that the sky ahead was indeed working. I passed the center of the Drum Mountain turn area and carefully paid attention to the restricted airspace, which is used by the air force for fighter training. I got to know a former F16 pilot who had been stationed in Utah – you definitely want to stay well clear of that area even when there are no contest points on the line!
Once my flight computer showed a good amount of overtime even when I would only nick the last turn area, I turned and largely back-tracked the path I had just taken, heading back south-east. More clouds had developed and the blue hole had shrunk considerably, making the transition a lot easier.
Going deep into the second cylinder turned out to be a good decision because heavy rain started to fall in the third cylinder just as I go there. I had to cross a virga line to get into the turn area but then I found strong lift just to the west of a rain shaft that I flew around once I decided that it was time to turn back to Nephi. You could see the gust front from the rain driving up dust on the ground – often a great indication of where to find lift.
A line of clouds across the Canyon Mountains marked a good line towards Nephi and I went on final glide even though my flight computer predicted that I would be 500 ft too low at MC4. The lift over-delivered and I kept increasing my speed to 125 kts and still arrived almost 1000 ft too high.
That turned out to be a blessing because dozens of gliders arrived within minutes of one another. It was hard to find two to three seconds of free radio time to announce my arrival among all the finish announcements and sorting out of the landing sequence. Amazing how this works without air traffic control. However, instead of diving right into the traffic jam I climbed back up to cooler temperatures and waited until the commotion on the ground had settled down.
Oh, results. I guess I’m in a competition and these things should be reported. My average speed for the day was 130 kph just like on Day 1. Not fast but a modest improvement in relative terms because today’s winner, Robin Clark, averaged 161 kph, which means I scored just a little over 800 points. Not great but not terrible either. I have realistic expectations and am here to learn and not to win.
The weather forecast projected early over-development and thunderstorms over the Wasatch Plateau but good soaring conditions over the western desert. And a big storm cell was projected over Mt. Nebo for mid afternoon. The task committee did a good job trying to keep us out of bad weather and declared an Assigned Area Task with two big 30km turn areas at Kanosh Canyon and Pine Peak, followed by two smaller 10km ones at Drum Mountains and Delta Muni. Then back to Nephi. 2:30 hours minimum time. Task distance anywhere from 267 km to 492 km. Yes, kilometers. They seem to be an alien measuring concept for some but I grew up in Europe and find them quite intuitive.
After a somewhat challenging climb-out I hung out at cloud base until task opening time, then everyone was forced to descend to 12,000 feet before climbing back up as high as possible before crossing the start line. This rule tries to make the start fair to those who are late on the grid but it creates a lot of traffic at just below 12,000 feet right before gate opening time.
I escaped the traffic by finding my own clouds further afield but this turned out to be a mistake. I hopped from cloud to cloud not finding anything useful to climb in until most of the field had already gone out on task. I finally was able to cross the start line at 14:45, dead-last and a whopping 25 minutes after the leading (and winning) pack. I was at first angry at myself for taking so long to climb but then I told myself that I just had to fly my own race without any distractions. I felt much better once I put a positive spin on my situation. Mind games. Amazing how this works.
The first leg went blazing fast under a cloud shelf that separated the dryer desert air from the thunderstorm-prone airmass over the mountains. For quite some time my task speed indicator was above 170 kph and my mood was up. Maybe starting late was an advantage.
But when I got to the first turn area, a rain cell just south of Filmore blocked further progress and I had to turn west earlier than I wanted. The cloud line was suboptimal too as it forced me into a detour to the north to stay below the clouds and then cross a big blue hole to get into the second turn area.
Up until that point I had kept in close contact with the clouds but now that I had dropped below 13,000 ft the clouds were no longer working. That’s when I remembered my struggles in the start area. Today was a “get high, stay high” kind of day. I went from “race mode” to “stay up mode” and began to search for lift among all the usual suspects. The ground was still far below but it looked positively alien. I suspect all the Mars movies are made in Utah. I scanned the ground for roads or any sign of civilization but none was in sight. Just sand and rocks as far as the eye could see.
Well, I wasn’t very selective with my next thermal. This is no place to get low and I was all alone in the desert with all the other gliders well ahead of me. I centered the next 3kt climb and slowly worked my way back up to cloud base. Once there, the air was buoyant again and things were easy until the next blue hole when they were not.
Turnpoint three brought me into the proximity of the Restricted Area and of course the best looking cloud was over forbidden terrain. Oh well. I took another detour line towards Delta and decided to approach it from the very south as I still had some time to kill so I would not finish under minimum time.
Once I got close to Delta a great looking cloud was right on course towards Nephi but I fell victim to the recency bias and took the next 4kt climb to climb to Final Glide Altitude instead of switching gears back into race mode.
The cloud past Delta delivered the strongest climb of the day, catapulting me up to 2500 feet above Final Glide altitude and from there it was nose down and 125 kts to the finish line, still arriving high.
I thought my task speed of 130kph was respectable but that only lasted until I got a glimpse at the score sheet. John Seaborn finished first with 173 kph, closely followed by four other pilots who also beat the 170 kph mark. Racing against the best in the Nation is a humbling experience as I knew it would be. But it’s a great way to learn and I know I can do at least a little bit better.
I should also mention that the landing was rather sporty with significant cross winds gusting to above 20 kts. Half an hour later it was blowing even harder. I hope everyone had safe landings without any damage.
At my club, the Soaring Society of Boulder, we are trying to help freshly minted glider pilots who are eager to develop their skills but are unsure how to go about it. Stats show that a large percentage of recently-trained pilots exit our sport long before they have experienced what’s possible. However, those who reach for the challenge, often find a passion that lasts a lifetime.
I believe that one key tool that can help a new pilot’s development is a set of standardized soaring tasks. In the case of Boulder, we carefully designed them for our demanding mountain soaring environment. It’s paramount that pilots stay safe as they progress. This article introduces these tasks – from Beginner to Diamond.
You can find much more detailed information about these tasks here.
From Beginner to Silver
The first four tasks are supported by Proving Grounds: from Beginner to Silver.
Our first task is called “Boulder Dash.” It is a ~45 km flight around the city of Boulder and takes the pilot never further than 12km (7.5 miles) away from the airport. It is suitable for any licensed pilot who is able to stay airborne on a good soaring day. In addition, the pilot must have the mental bandwidth to maintain situational awareness. E.g., they must pay close attention at all times to other traffic and airspace constraints.
The tasks build on one another and are getting progressively harder. “Hill Rambler” introduces pilots to mountain flying over the foothills of the Rocky Mountains. It also doubles the distance away from the airfield. However, pilots can easily keep the takeoff airport within safe glide at all times.
“Niwot’s Challenge” takes pilots close to the Continental Divide, the spine of the Rocky Mountains. Pilots learn to carefully manage their altitude to ensure the safety of the flight at all times. The second turn point doubles again the distance away from Boulder. Pilots must consider other landing options should it become necessary.
“Lookout for Silver” builds on everything pilots have learned in the prior three tasks. Pilots can earn Silver Distance and Silver Altitude – two of the three components of the Silver Badge. Total task distance is 170 km – a great preparation for earning their other badges.
Proving Grounds Support
These first four tasks will be supported by Proving Grounds. Proving Grounds is a platform developed by a group of Canadian soaring pilots. It is super easy to use and provides a low maintenance approach to member development. The Soaring Society of America supports its adoption in the US. This may be a great opportunity for your club!
Pilots who complete any one of these four tasks can simply email the .igc trace to a “bot” which automatically scores their flight. Pilots can then post their achievements on a stainless steel task board. The board will be mounted at the airfield and lists the flights ranked by average speed achieved (adjusted for glider handicap). The bot provides all the relevant information.
In addition to support by Proving Grounds, our club will provide individual task sheets. These contain task-specific safety tips (e.g. suggested minimum altitudes, air traffic pointers, potential terrain traps) as well as tactical advice regarding weather, soaring conditions, and how to fly each task. Pilots are also encouraged to become proficient in the use of a flight recorder – a key requirement for earning their badges.
Our support program does not end there. The next step is for pilots to work on their Gold and Diamond flights.
Gold and Diamond
“Gold in Glide” is aptly named because this task allows pilots to earn their Gold Distance requirement while staying in glide range of the home airport the entire time. This is possible thanks to our topography, outstanding soaring conditions, and our club gliders. During the summer, we can routinely soar to just below Class A airspace (which starts at 18,000 feet). Our club’s two Discus CS gliders are ideally suited for accomplishing all badge tasks.
“Front Range Diamond Goal” and “Front Range Diamond Distance” are task recommendations for pilots who have completed their Gold Badge and are ready to leave glide range for the first time. However, other airports near the proposed routes help pilots stay safe. These tasks are mere suggestions: pilots are encouraged to adjust their tasks based on the day’s specific weather conditions, e.g. taking advantage of particular energy lines (such as the typical Front Range Convergence).
Our club encourages flight instructors and experienced cross country pilots to support aspiring pilots with ground-based coaching. Some may even fly some of the tasks with them in our club’s DG 505 or via lead-and-follow mentoring.
The goal is to give pilots a framework and support to embrace the challenge of developing from glider pilots to XC mountain soaring pilots without putting themselves in danger. It may lead to more pilot engagement and long-term retention of valuable club members.
If your club has also taken steps (similar or different) to help pilots cross the gap from freshly certificated glider pilot to safe cross-country pilot, I’d love to hear from you in the comments or via email at chessintheair@gmail.com.
(Editorial Note: since initial publication, I have added a few thoughts suggested by readers. Andy Blackburn’s input has been particularly valuable. I also added a post scriptum at the end with additional tips. Thank you to all who commented.)
Who has not heard of the MacCready Speed-To-Fly Theory? It is the brilliant discovery of a brilliant man who was not only the first American to become a world soaring champion but who came up with a scientific way to demonstrate how fast we should be flying in-between thermals in order to maximize our cross-country speed.
Paul MacCready (1925-2007) – one of the most most influential individuals in soaring history. You can find his bio here.
Not long after MacCready published his theory, other pilots followed his example and began equipping their gliders with “MacCready Rings”. These are simple devices mounted around a glider’s variometer telling the pilot how fast they should be flying depending on the expected strength of the next lift.
With the onset of flight computers, MacCready’s Speed-To-Fly Theory (or STF for short) went digital. Today, every flight computer requires the pilot to input their “MC value”, and every STF vario will produce audio and visual signals. These tell the pilot whether to speed up, slow down, or maintain the current speed – based on the MC value they selected.
Over time the application of STF theory has evolved a bit. E.g., pilots have learned that it is useful to slow down as they get closer to the ground to minimize the risk of a landout. Others correctly pointed out that “chasing the needle” is not only distracting but that constant control inputs make it inefficient as well. Instead, most would recommend flying at “block speeds” that approximately correspond to the correct MC setting. After all, flying a bit too slow or a bit too fast makes little difference in terms of the average speed achieved. Some have even come up with scientific ways to show when, how, and how much to deviate from MacCready’s theory. (E.g., see Daniel Sazhin’s and John Bird’s work about “Bounded Rationality and Risk Strategy in Thermal Soaring” or John Cochrane’s article, “MacCready Theory with Uncertain Lift and Limited Altitude“). Instead of getting into more details here, I recommend that interested readers take a look at the article “Just a Little Faster, Please“, also by John Cochrane.
However, no-one doubts that MacCready theory at its core is mathematically correct and scientifically sound. It remains the undisputed foundation of any theory about how fast we should fly in cruise. Most importantly: every flight computer and every vario asks you to input an MC value. So you better know what these devices are doing with the information you enter.
MacCready Theory in a Nutshell
Every soaring textbook has an explanation for how and why the theory works. In essence, it is quite simple: when the lift ahead promises to be strong you should fly faster. When the lift ahead looks to be weaker, you should fly closer to your glider’s best L/D speed, i.e. the speed where it has its best glide ratio. MC theory tells you exactly how fast you should fly based on the strength of lift you expect ahead.
The series of charts below illustrate a simple example. They are based on the speed polar of a Discus CS (one of the most popular standard class gliders) without water ballast. (The principles explained are the same for whatever glider you fly but the values will obviously differ. If you fly a similar glider, such as an LS4, a DG 300, or an ASW 24 they will be close. A DG 505’s polar is also similar.) The speed polar is the curved line in blue. It illustrates the rate of sink at various speeds. The speeds are on the horizontal axis (in kts), and the glider’s rate of sink at these speeds is shown on the vertical axis (also in kts). Using the same units on both axes (in this case kts) is very helpful because you can calculate the glide ratio at any point along the curve simply by contrasting the speed to the sink rate.
Speed polar of a Discus CS. Horizontal and vertical speeds are in knots (nautical miles per hour).
The next graph below shows that the best glide performance of the Discus CS is at about 55 kts. You can find this best glide speed by placing a tangent (the red line) against the speed polar starting at the chart’s origin (the point 0,0).
The best L/D speed is at the point where a tangent originating at 0,0 touches the speed polar.
At 55 kts the Discus will sink at a rate of 1.3 kts. 55 divided by 1.3 equals 42. 55 kts is the best L/D speed for a Discus and its best glide ratio is 42:1.
The only time you would ever fly at the best glide speed is when you are desperate. Let’s say the lift has died for the day, the air is completely still, and you are just high enough to safely make it to an airport. That’s when you would fly at best L/D. This speed is also called MC 0 speed: the expected strength of the next lift is zero (because you know there is no more lift to be had) and all you are trying to do is to stretch your glide as far as possible.
Let’s look at a more frequent example. It’s a pretty strong day. You are high and there are several good-looking cumulus clouds ahead. During the last few climbs you achieved 4-5 knots on average from the bottom to the top of each thermal (including any centering delays, re-centering efforts, etc) and you expect the next lift will be just as strong. In this case it makes sense to set your MC to 4. You expect the next lift to be just as strong and you are not willing to stop for anything less than that – at least for now. In this case you should fly at MC 4. (MC 3 or MC4 are perhaps the most common MC settings that pilots use for Speed-to-Fly calculations. Higher settings only make sense in exceptionally strong conditions. How often would you not take a climb that averages 4+ knots from bottom to top?)
You simply feed MC 4 into your vario and it will tell you to fly at MC 4 speed. The chart below shows you how your vario calculates this speed: it places a tangent (once again the red line) along the speed polar curve but this time it starts at a point 4 knots above the origin. The tangent touches the speed polar at 83 kts and you can see that at this speed the glider will sink 2.9 kts per hour. The glide ratio at this speed is 83/2.9 = 29. I.e. you will glide 29 ft forward for every 1 ft of altitude you lose. 29:1.
At MC 4, a Discus will achieve the highest average speed if you fly at 83 kts in still air. At this speed your glider will descend by 2.9 kts and your effective glide ratio will be 29:1.
OK, so far, so good. You already knew this anyway. But what does this have to do with the headline? Where’s the peril? That’s what we’re getting to now.
The Other Use of the MacCready Value
The MC value that you enter is not only used by your vario to calculate your best Speed To Fly but it is also used by your flight computer to calculate whether you can safely reach a place to land.
I very much doubt that this was Paul MacCready’s idea. But that’s how your flight computer works. And if you don’t know it, it can be a big problem!
In the example we just discussed above it is hard to see. When you’re flying high and happy and are confident that the next thermal will deliver a 4 kt average climb you are probably not too concerned about reaching a safe place to land. And if you glance at your flight computer it will use your MC 4 setting to calculate which airports (or landout fields) are in safe glide at MC 4. I.e., it will do so based on a glide ratio of 29:1.
But let’s say the expected 4 kts of lift did not materialize. In fact, the clouds that looked so good before are now dissolving and you’re getting lower and lower. Far from being confident that the next lift will deliver 4 kts, you are gradually getting concerned. And, as you should, you dial back your MC settings. First to MC 3, then to MC 2, and, as you get lower and lower, you move it back to MC 1. Eventually you are getting desperate and dial it all the way back to MC 0.
This makes sense because you want your STF vario to tell you to fly more slowly so you better conserve altitude and have more options to find lift ahead, rather than driving hard down to the ground.
But what does your flight computer do with the same information? As you reduce your MC settings to 3, 2, 1 and then to 0, your glide computer thinks you can glide farther and farther. It basically removes your safety margin. Remember: at MC 0 your flight computer believes you are able to consistently fly at the very optimal glide speed – 55 kts in still air – and achieve a glide ratio of 42:1. Is this realistic? Probably not.
By reducing the MC value to 0 you just told the glide computer to lie to you. It is now showing airports (or fields) in glide range that really aren’t.
But things are probably even worse. Quite possibly much worse!
Unless the day has truly died and the air become completely still, chances are that the airmass you are flying through is actually going down. Why? Because as long as there are thermals and the air is going up somewhere, it must be going down elsewhere. Completely still air hardly ever exists and it most definitely does not exist on a day when we expect to find enough lift to fly cross-country.
So let’s say the air you’re flying through is actually going down by 1 kt. One knot is not much and definitely not unusual. What are the implications?
Well, first of all you should be flying a bit faster. When the air is sinking at 1 kt, your STF vario will tell you to speed up even if you leave your MC setting at 0. How does it do this? Easy: 1 kt sink will simply shift the glide polar down by 1 kt because you have to add the sink rate of the airmass to the sink rate of the glider. (The vario obviously knows you are in sink and it does this automatically. ) You can see the new polar on the chart below (in orange). You can also see where the tangent touches the new polar curve. This point is at 59 kts and your sink rate will now be 2.4 kts. (In still air it would be 1.4 kts but since you’re in 1 kt sink, so you’re actually coming down at 2.4 kts.)
Sink will shift the speed polar down because the sink rate of the air must be aded to the sink rate of the glider at any given speed.
Now, look at what happened to the glide ratio! At 59 kts and 2.4 kts sink, your glide ratio is now 59/2.4 = 24:1. You’re still flying a high performance glider but just 1 kt of sink is enough to basically turn it into a Schweitzer 1-26!
What about the safety glide calculation? Your glide computer does not know how long the sink will last so it does not take it into account at all! (This makes sense because otherwise the safety glide calculation would jump around wildly each time you fly through a bit of lift or sink.) Remember this! The flight computer will account for wind (because wind doesn’t change from second to second) but it does not account for lift or sink when it calculates which airports (or fields) are in glide.
So what does it tell you? Since you turned down the MC value to 0, it will calculate your safety glide with a 42:1 glide ratio even though you are only achieving 24:1!
It is easy to see why this is at best misleading, and at worst a major safety hazard. A lot of beginning XC pilots tend to use what they think of as a “conservative”, i.e. low, MC setting. As long as this is only applied to Speed-to-Fly calculations it makes sense because it helps them stay high (while obviously slowing them down). But when applied to safety calculations a “low” MC setting is just the very opposite of conservative!
What Should You Do?
Now that you understand that your MC settings are used for two completely different purposes – calculating your speed to fly, and calculating your safety glides – what can you do about it?
The answer is simple: use two different MC settings, each appropriate for its purpose!
If your glider has an electronic Speed-to-Fly vario and you are also using a completely separate flight computer with a moving map, things are straightforward. For the vario use an MC setting that’s based on the minimum strength of the lift you are willing to accept. For the flight computer use an MC setting that’s appropriate for safety glide calculations.
This describes the setup that I was flying with last year. I had an STF vario in the panel and a stand-alone Oudie IGC flight computer with a moving map display. I entered my STF MC setting into the vario, and kept a different (usually higher) MC setting on the Oudie. This way the Oudie would only show me airports and fields that really were in safe glide range.
Things get problematic when your STF vario and your flight computer are connected with one another. Changes that you make to your MC settings on one device are probably automatically sent to the other device. The two devices are kept in synch. This seems like a great convenience but in reality it is anything but! In real life it is quite rare that you want to use the same MC value for your STF calculations and for your safety glide calculations. And whenever it is appropriate to use two different values than either of these two calculations will simply be wrong!
If you use a setup where your SFT vario and your flight computer are connected with one another (e.g. via cable or bluetooth), see if there is a setting that prevents the two devices from synchronizing MC values. You want each of these devices to correctly calculate the thing it is supposed to calculate!
If you only use only one single device for both STF and safety glide calculations (or if you cannot prevent your STF vario and your flight computer from synchronizing MC values) you must remember to edit your MC setting based on what you want to focus on. If you are relatively new to cross country soaring I suggest that you set the MC value appropriately for safety calculations and simply ignore your vario’s speed-to-fly suggestions. You’re probably not going to fly as fast anyway as the vario suggests you should.
And there’s one additional thing you should do: make sure that you complement a safe glide calculation by also setting a safe arrival altitude. After all, you don’t want to arrive at the airport (or field) at grass root level. You want to have enough time to do a proper landing check and fly a safe landing pattern. What’s a safe arrival altitude? That is a different question for another time. In Boulder, I always plan to arrive no lower than 1500 AGL because we have a very busy airport, and I may be in line behind other gliders or even a bunch of skydivers that are floating above the field just when I get there. Extreme weather can create problems, too. Here’s a scary experience from a few years ago.
What MC Value is Appropriate for Safety Glide Calculations?
We know from the MacCready theory how to set MC for Speed-to-Fly calculations: enter the expected lift of the next thermal. Better still (since you don’t really know how strong the lift ahead will be): enter the minimum strength of lift that you are willing to take right now.
But how to set MC for calculating safety glides? Well, as always, it depends. Since this calculation is about safety, and only about safety, the key question you should ask: given the looks of the conditions ahead, what is the “worst-case glide slope” with your glider in the direction you’re heading – at least until the next landable field or airport? Whatever your estimate is, you can then enter an MC value that corresponds to that glide slope.
OK, so how do you estimate your worst-case glide slope?
We have seen above that sink has a very negative impact on the attainable glide slope. Just 1 knot of sink will turn a 1:42 glider into a 1:24 glider. What about 2 knots of sink? Let’s take another look at the speed polar.
Discus glide polar in still air (blue) and glide polar in 2 kts of sink (orange). If the air descends at 2 knots the best attainable glide ratio is 18:1. To achieve it, the pilot must fly 67 kts.
Two knots of sink will shift the speed polar down by – you guessed it – 2 knots. You’re in sink, so you must fly faster. How fast? Place a tangent from the origin against the new (orange) speed polar. 67 knots is the speed to fly and your rate of sink will be 3.8 kts. In the best case, this equates to a glide ratio of 18:1. (I say best case because it is pretty difficult to fly exactly at the right speed to fly and if you fly a little faster or slower, your glide ratio will actually be worse than 18:1.)
Depending on where you fly, two knots of sink still isn’t all that bad. Here in Colorado it is not uncommon to hit pockets of sink where the air goes down by 5 kts or even 10 kts. In wave conditions it could be as much as 20 kts! How would that affect your glide slope?
The chart shows the original polar curve (in blue), as well as three additional polar curves: one for 5 kts of sink (orange), one for 10 kts of sink (gray), and one for 20 kts of sink (yellow). Tangents from the origin against each of these polar curves determine the best achievable glide slope at the indicated flying speeds. The point where the tangent would touch the curve for 20 kts of sink is to the right of the chart. Va and VnE also set practical limits how fast you can fly to get out of such extreme sink.
The chart above shows that the impact of strong sink is downright frightening. If you fly through 5 kts of sink your best glide ratio is 11:1 at a speed of 88 kts. If you cross 10 kts of sink, your best glide ratio becomes 5:1 at a speed of 102 kts. And at 20 kts of sink, the answer is literally off the chart. You’d fly somewhere between rough air speed and Vne and you’d be lucky to achieve much better than 2:1.
Scared? Well, you should be. Big sink is scary. If feels like you’re coming down like a brick. Because you are. Well, almost. Fortunately, strong sink tends to be short-lived. And since it’s true that what goes up must come down, it’s also true that what comes down must go up. Strong sink and strong lift tend to exist in close proximity to one another. Wave flying is an extreme example where 10-20 kt lift and 10-20 kt sink can be within 1 or 2 miles from one another. Try to get out of sink and back into lift as soon as possible! Hopefully you know what you’re doing! Or, perhaps even better: think twice before you decide to fly in such extreme conditions to begin with. The point is that such extreme scenarios are not really all that helpful when you decide how to program your flight computer.
In regular summer soaring conditions the more typical cases are that you’re getting low because the lift is weakening, that you fell out of the lift band, or that you crossed into a slowly descending airmass. In Boulder, Colorado, a classic example for the latter is that you fell out of the convergence, can’t get back, and are struggling to find good lift in the eastern airmass. A divergence zone running parallel to the convergence may put you in sink. In these cases you are unlikely to be confronted with sustained strong sink. But even in relatively benign conditions, it is still quite possible that you experience an average of 1 kt of sink on your final glide home.
Lets revisit the chart for 1 knot sink.
As we saw before, at 1 kt sink we should fly 59 kts and our glider will sink at a rate of 2.4 kts. Our glide ratio will be 24:1.
If this is the “worst-case glide-slope” that we are expecting, how can we instruct our flight computer to make the appropriate safety calculation? The answer is: we have to find the MC setting that corresponds to a 24:1 glide slope in the absence of lift or sink.
The following chart shows how we can do this easily.
This chart is identical to the one above except that he additional intersection point of the 24:1 glide ratio line and the still-air polar curve is highlighted. Note that 90/3.7 obviously also equals 24:1.
We simply look for the point where the 24:1 glide slope line (i.e. the red tangent to the orange speed polar) intersects the original (blue) still-air speed polar. We find that this point is at a speed of 90 kts and a sink rate of 3.7 kts. Now we draw a new tangent (the dotted red line) that touches the blue polar at exactly this spot. Then we check where this new tangent intersects the vertical axis. You can see that for the Discus this point is at 6 kts. In other words: if we expect a worst case glide slope of 24:1 all the way to the airport (i.e., conditions that reflect 1 kt of sink), we should set MC to 6.
You might be interested what MC setting I use. Once again, it depends! If there is a well-marked energy line ahead that I can follow, e.g. a cloud street or the typical Rocky Mountains convergence line, I am comfortable to base my safety glide ratio on an MC value as low as 3. If the sky is blue and I don’t really know what to expect I tend to use MC 4 or 5. And if the terrain is particularly hostile I bump it up to 6 or 7. Ultimately, it comes down to a judgement call. The more doubt I have about the conditions ahead and the greater the probability of sink, especially prolonged sink, the higher I set my MC value.
If you’re flying in particularly challenging terrain or if you’re not yet experienced in avoiding areas of persistent sink, you may want to follow the advice of the French mountain soaring team and use a “worst-case glide ratio” that is 1/2 of your gliders best glide performance. For the Discus CS this glide ratio is 21:1. The chart below shows that a Discus (without water ballast) will achieve 21:1 at a speed of 95 kts when the corresponding sink rate is 4.5 kts. And the corresponding MC value is about 10.
At tangent placed against the point where the glide ratio line of 21:1 intersects the blue polar curve crosses the vertical axis at +10. In real life you will probably never expect the next climb to average 10 kts from bottom to top, but if you did, you would fly a dry Discus at 95 kts, i.e., MC 10.
Remember that estimating a “worst-case glide ratio” is by no means a guarantee that reality may not be harsher yet. Perhaps even much harsher. I have shown above how bad a glide ratio gets if you hit 5, 10, or even 20 knots of sink!
Conclusion
The purpose of this article was to make clear that your glider avionics use MC for two completely different purposes and that applying inappropriate values can have dangerous unintended consequences.
Your STF vario uses MC to calculate the best speed-to-fly based on your assessment of the strength of lift ahead. If you’re conservative, you want this value to be lower, not higher. This will make you stay relatively high albeit at the expense of a somewhat lower cross-country speed. Irrespective of your level of experience, the most appropriate MC value is, “what is the weakest lift that I would be willing to accept right now.” MC 2, 3 or 4 are fairly typical. Only in exceptionally strong conditions will it be 5 or higher.
Your moving map flight computer uses MC to calculate which airports or fields are within safe gliding distance. If you’re conservative, you want this value to be higher, not lower. This will force you to stay high enough that you can safely reach your destination even if you should face less than favorable conditions ahead. Your skills, experience, the terrain, and the conditions of the day are all important factors to consider when you set this value. On benign summer days a value of MC 5 or 6 may be appropriate. If you’re inexperienced, flying over hostile terrain, or if you are unfamiliar with a particular soaring area, MC 10 will give you an extra safety margin. And always complement your glide slope calculation with a safe arrival altitude so you have the altitude you need for a safe landing pattern.
Importantly, set your MC values separately for your STF vario and your flight computer. Prevent these devices from synching their respective MC values if at all possible. Be very careful if you only use one device (or one synchronized input) for both calculations. The biggest trap exists when you dial back your MC setting for SFT purposes and your flight computer stretches your attainable glide unrealistically farther and farther.
Even the highest possible MC setting will not be appropriate to calculate safety glides when extreme sink, or strong sustained sink, is possible. When conditions are extreme, the best advice is to stay really high at all times. And if that’s not possible, or if you’re not sure you can deal with the conditions at the time, you can always decide to fly on a different day instead.
Have fun and fly safe!
Post Scriptum
There has been a lot of interest in this article. Within 48 hours of publication it has been read about 2,500 times and a lot of readers made excellent comments, either below or on social media.
First of all they confirm that the trap is real: entering a low MC value into your flight computer will result in wildly over-optimistic glide slope calculations and show fields or airports within glide range that really are not. However, there are multiple ways to avoid the trap and my suggestion in the article of using a different (and higher) MC value for safety glide slope calculations is only one of them.
Below I want to summarize a few comments that I found particularly helpful:
If the terrain in your soaring area is generally landable there is not all that much to be concerned about. E.g., one pilot from the Netherlands commented that where he flies there are always several landable fields in glide even from as low as 1000 AGL. If that describes your soaring terrain then this topic doesn’t really apply to you. Your main challenge may be to resist the temptation to keep trying to find lift until you’re very close to the ground. Delaying the decision to land until it is too late for a safe landing is the #1 reason why glider pilots get killed. This is a different topic. You can read more about it here.
As an alternative to using MC inputs for your final glide calculation you may be able to use “Required L/D”. E.g., I have my Oudie set up to display two Nav boxes at the top of the screen: “Required L/D” and “Current L/D”. As long as my “Current L/D” exceeds the “Required L/D” I am gaining relative to my required glide slope and my odds of making it to the target improve. Conversely, if the “Current L/D” drops below the “Required L/D” I am losing against my required glide slope and may be in trouble. This is a very useful method. If you use it, it is critical that you also complement it with a safe arrival altitude. In this video, I show an example of a final glide back to Nephi, Utah where I needed a glide ratio of 25:1 to get back to Nephi but then my “Current L/D” temporarily dropped to 18:1. (I was flying my 48:1 Ventus 2.)
A lot of excellent pilots don’t use a “Speed-to-Fly” vario to tell them how fast to go. Instead they primarily rely on “block speeds.” E.g., if they are high and feel “confident” of finding good lift they will fly at a speed that roughly corresponds to their gliders STF at an MC setting of 4 in still air. If they are getting towards the bottom of the best lift band they become “conservative” and fly at a speed that corresponds to MC 2. And when they get “desperate” and are really looking for lift, they slow down to a speed corresponding to MC 1. And if they are “feeling lucky” high under a strong cloud street they fly extra fast. One of the commenters calls it “warp” speed. For a dry Discus CS these speeds might be: desperate: 60 kts; conservative: 65 kts; confident: 75kts; warp: ~85-90 kts. Add about 10 kts to each speed when flying with water ballast. If you like this method there is no need to mess with your MC value at all. Simply set an MC value on your flight computer that’s appropriate for your safety glides (combined with a safe arrival altitude) and leave it at that.
Similarly, if you like your STF vario set to “netto” instead of “Speed-to-Fly” you also don’t need to bother meddling with MC values during the flight, and can just use an appropriate MC setting for safety glides on the flight computer.
What MC value is appropriate for safety glides varies with the soaring terrain. My article was written from a mountain flying perspective. Where I fly in Colorado it is common that the next landable airport or field is 20, 30, 40, or even 50 miles away and soaring conditions tend to include strong lift as well as strong sink. Talk to experienced pilots in your area to understand what safety glide ratio (and hence what MC value) may be appropriate for where you fly.
Keep the comments and insights coming. Soaring is an unforgiving sport and our safety largely depends on our ability to learn from the mistakes others have made before us. (Or on sheer luck – but only for as long as it lasts.) By learning together we’ll become better and safer pilots.
Soaring above Mount of the Holy Cross – one of the more intimidating 14ers in Colorado
Having reviewed my progress against the Soaring Goals that I had set for 2020, the last day of the year feels like a good time to publish new goals for 2021.
Netto in cruise. Sharpen focus on following energy lines, measured by consistently achieving above-average netto values in cruise flight, a much better metric than circling percentage and effective glide ratio.
Altitude band. Use more of the available altitude band to become more selective in thermal acceptance. This will require an adjustment of my flying style.
Precision thermalling. Focus on quick centering, maintaining optimal coordination, circling speed, and 45 degree bank angles. As a result, achieve above average climb rates when compared to other pilots flying in the same area on the same day.
3. Speed Goals. Apply these skills to achieve the following:
When flying on Speed League Weekends aim to score among the top 3 Boulder pilots 66% of the time (up from 50% in 2020).
Try to break one of the Open Class Colorado Speed Records (stretch goal).
4. Distance Goals. Weather permitting, I would like to achieve two of the following in 2021:
Reach one additional U.S. State flying from Boulder: New Mexico, Utah, or Nebraska. An aspirational stretch goal is a “border to border” flight from Boulder to New Mexico, then to Wyoming, and back to Boulder.
Complete a 1000 km flight per OLC plus rules.
Complete a 750 km FAI triangle or a 1000 km Diplome.
Add to my 14er bag with a flight to the southern-most peaks of the Sangre de Cristo Range or a flight into the San Juan Mountains.
5. Contest Goals. I plan to fly at least three or the following four contests:
Region 7 in Albert Lea, MN (May 17-22)
20m 2-seater Nationals in Montague , CA (Jun 14-22)
Region 9 or 18m Nationals in Nephi, UT (Jun 29 – Jul 8)
Region 10 in Uvalde, TX (Aug 15-21)
Since these are my first contests, I want to focus mainly on skill development,flying consistently, and completing as many tasks as safely possible. Stretch Goal: place in the top 33% at one of the Regional Contests or in the top 50% at a Nationals Contest.
6. Giving Back. I will continue to put energy towards inspiring others worldwide to join our sport, to develop, excel, and stay safe. I will do this through:
This time last year I was in the midst of negotiating the purchase of my first glider: a beautiful Ventus 2cxT. It was “almost like new” with only 500 hours. Early in January I closed the deal and drove to Dallas, Texas for a final inspection. Having found that everything was indeed tiptop, I was excited to tow it home to Colorado.
In February I travelled to the SSA convention in Little Rock, Arkansas. Attending seminars and seeing all the shiny new objects on the convention floor I was excited for the soaring year ahead. I also met with Daniel Sazhin, multiple US National Champion, who was kind enough to brief me on soaring in Montague, CA and Nephi, UT – the sites of my first two soaring contests that I had registered for.
Then, as we all know too well, everything changed. Much of the world went into lockdown. The contests I had signed up for were cancelled. And instead of soaring, I found myself drafting a Covid-19 policy for our club to help us get back in the air. After all, “social distancing” isn’t all that difficult in our sport.
Club operations resumed in early May. And by the end of that month the OLC Speed League Season started with a five week delay.
Move up to flapped gliders, fly with water ballast, and learn to responsibly use an engine.
Have fun flying my first soaring contests (I’m signed up for the 2-seater Nationals in Montague, CA; and the Region 9 Sports Class in Nephi, UT). My goal is to complete all tasks provided that I can do so without taking any safety risks.
Contribute to my club’s OLC Speed League results by scoring among the top three Boulder pilots on 10 or more Speed League weekends. My stretch goal for the OLC Speed League is to score among the top 5 Boulder pilots and among the top 50 US pilots overall.
Complete a flight of more than 750km. My stretch goal is 1000km.
How did I do?
Despite the challenges we all faced, the soaring year 2020 turned out better than might have been expected.
My 2020 XC soaring flights from Boulder (KBDU). I significantly expanded my soaring range in 2020 – in part due to a better glider, and in part due to increased experience. The distance between the furthest points in the north-west (Crestone Junction, Wyoming) and south-east (Greenhorn Mountain) is more than 300 miles (just under 500 km).
Goal #1 – Stay safe.
This will always be my most important objective. I’m glad to say I succeeded in staying safe. However, I recall one situation where I pushed my luck further than I should have when I continued a particular flight under a rapidly over-developing sky. This got me into a terrifying situation: I had to return across a line of thunderstorms with lightning flashing across my canopy. While the outcome was benign, the experience was scary and not something I ever wish to repeat. I have definitely been much more respectful of potential thunderstorms ever since. At some point I must find the courage to write about it in more detail so others can learn from it, too.
Lightning flashes across the sky ahead as I had back to Boulder from South Park, breaking off one of my 750 km attempts on July 31.
Goal #2 – Move up to flapped gliders, fly with water ballast, and learn to responsibly use an engine.
My new-to-me Ventus 2cxT allowed me to make good progress. Most of my summer soaring flights were with different levels of water ballast. I am now quite comfortable flying with high(er) wing loadings.
Flying with flaps has been much less of a deal than I had imagined. The flap controls in my Ventus are extraordinarily well designed. The pilot’s hand can comfortably rest on the flap handle. Making adjustments is no effort at all. Working the flaps is as intuitive as working the elevator.
The integration of flaps and trim makes trim adjustments largely unnecessary. Hard to beat that design!
I started the sustainer engine a few times for test purposes but I rarely ever used it to climb, and I never used it to self-retrieve, although once I came close. You could say that’s a responsible use of the engine but I wish I had got to know it a bit better. There’s more opportunity for that next year.
My Ventus 2cxT during it’s Annual Inspection. The glider is in excellent shape.
Goal #3 – First Contests.
Almost all US contests were cancelled and moved to next year so this will remain one of my key objectives in 2021. To practice, I did manage to travel one week to Nephi to fly with Bruno Vassel and a number of other XC pilots. The experience was invaluable as I was able to fly a number of good tasks and am now much more familiar with the terrain and the prevalent energy lines. This flight also provided a taste of what racing feels like.
The chart above shows the flights that I flew out of Nephi at the end of June / beginning of July.
Goal #4 – Contribute to my club’s OLC Speed League Results.
Boulder has had it’s best year ever competing in the speed league with a number 2 placement in the US Gold League and the World League.
My own contribution met my objective of placing among the top 3 Boulder pilots on more than half of the speed league weekends. I learned a lot about flying faster and feel much better prepared for future XC flights. I wrote more about my learnings from the Speed League in this article.
Among all Boulder pilots I over-achieved on what my stretch goal of scoring among the top 5 pilots overall by coming in 3rd place behind John Seaborn (a multiple national champion) and Bob Caldwell (one of Boulder’s most accomplished XC pilots). Among all US Speed League pilots I scored 25th, also well within my goal of landing among the top 50.
My fastest-ever glider flight was on a Speed League weekend in July – in classic Boulder convergence conditions. The average speed for the 2 1/2 hour speed league segment was 173 kph. The circling percentage was 6.5% with an effective glide ratio of 177:1.
My longest flight of the year (per OLC rules) was 916 km. I’m now inspired to reach for 1000 km if the conditions permit.
14er Challenge.
In addition to these goals I also made good progress on the 14er Challenge: flying over the peaks of all mountains in Colorado that are at least 14,000 ft tall. At the beginning of the year my tally stood at 11 out of the 58 peaks.
In 2020 I succeeded in “bagging” another 28: the fifteen 14ers of the Sawatch Range, the seven 14ers of the Elk Range, and five of the ten 14ers in the Sangre de Cristo Range. I also flew over Mt. Bross, my last missing peak in the Mosquito Range.
My overall tally is now at 39 with another 19 peaks to go: the five southern-most peaks in the Sangre de Cristo Range, and all 14 peaks in the furthest-away San Juan Mountains.
Total XC Distance.
In 2020, I flew a distance of 19,728 km (based on OLC plus rules using a maximum of 6 legs per flight), almost half-way around the earth, at an average speed of 116 kph.
In my next post I will try to set new goals for 2021.
We all know pilots who fall into one of two buckets. Bucket 1 contains pilots who never leave glide range around their home airport. Bucket 2 contains pilots who don’t seem to hesitate at all before they venture out over completely unfamiliar terrain.
Bucket 1 pilots don’t know what they’re missing. Bucket 2 pilots don’t know what they are doing. The former will die of old age but with regrets in their hearts. The latter might not get that far…
These two groups tend not to have too much in common except for one thing: they don’t know their turf. The first group because they don’t need to. The second group because they think they don’t need to.
And then there is a third bucket: it contains those who confidently leave glide range of their home airport, push their boundaries, and do so responsibly. These are pilots who want to live to old age and without regrets.
This article is for those who want to become a Bucket 3 pilot. How can you join? Get to know your turf!
The place I fly from – Boulder, Colorado – is an extreme case in point. The terrain is unforgiving: there are mountains, canyons, woods, and rocks. Boulder was given its name for a reason. Except for airports that are often 40 or 50 miles apart there are few places to land. And even some of the airports have runways too narrow to put a glider down.
When you’re flying a glider it is critical to know at all times where you can safely land no matter how promising the sky may be. Even more so if the terrain ahead looks like this…
What about the prairie? Yes, we do have a flat prairie to the east of the mountains. But it is rarely a good place to soar and the best lift is almost always over the mountains.
A basic rule of thumb for our area: where you can land you can’t soar, and where you can soar you can’t land. (This is a bit exaggerated but you get the point.)
It is no wonder that our club has many Bucket 1 pilots who always stay within easy glide range of our airport. Bucket 2 pilots are rare and a temporary exception: they tend to figure out quickly how get to Bucket 3 or they would not last very long. We also have many pilots who successfully graduated into Bucket 3. It is these Bucket 3 pilots that make the Soaring Society of Boulder one of the most successful cross-country soaring clubs – not just in the US, but in the world.
If you have been a Bucket 1 pilot (wherever you fly) but want to join Bucket 3, what do you have to do and how long does it take?
Are You Ready to Become a “Bucket 3” Pilot?
Let’s acknowledge that you should have some basic competencies as a soaring pilot before you venture further afield. E.g., you should be able to read the soaring weather forecast, tell the difference between a developing and a decaying cloud, center a thermal and don’t lose it. On a good soaring day you should have no difficulty staying aloft, and you should be able to confidently move from thermal to thermal. Some pilots (usually younger ones) learn to get there within one or two seasons and about 50-100 hours of flying. Others may need a bit longer.
Three years ago, at the end of my first season flying from Boulder, I was one of those Bucket 1 pilots, eager and ready to figure out how to get to bucket 3. My logbook at the time showed a total of 200 flights and 100 hours of soaring as pilot in command. 70 flights and 60 hours were in that one season; the rest dated back to my teenage years in the 1980s. All my flights up to that point had been local, i.e. within easy glide range of the takeoff airport.
What It Means To Know Your Turf
Cutting the cord to get back to your home airport is a huge milestone for any soaring pilot, second only to their first solo flight. It can also feel very intimidating. But you can remove a lot of the trepidations if you know what you are doing.
This means: be prepared before you venture off into the unknown! You have to know the terrain that lies ahead and where you might find lift (or sink). Most important of all: you must know exactly where you can land if the expected lift does not materialize.
Knowing where to land, how to ensure that you can always get there, and where you are most likely to find lift is at the very core of what it means to know your turf!
How To Learn Your Turf?
If you are new to cross-country soaring, chances are that you have some homework to do. The same steps apply before you fly in an unfamiliar area. As you gain experience you will become quite efficient in your learning process but that does not mean that should ever skip any of the following steps:
Research viable landing sites
Understand how high you need to be wherever you fly
Familiarize yourself with typical energy lines (i.e. where to find lift)
Each of these three steps is discussed below.
My recommendation is that you select the most suitable soaring area beyond your home field’s glide range. Let’s call it your Task Area. Then you complete the three steps before pushing your boundaries further. Keep your initial Task Area reasonably small – otherwise you might become overwhelmed and give up before you even make your first cross-country attempt. Expand your turf one step at a time!
E.g., for pilots flying from Boulder, Colorado, it may be best to initially concentrate on the area east of the Front Range between I-70 and the Wyoming border. This area is easily accessible, offers excellent soaring conditions, and provides access to several landable airports. Only when you are completely familiar with this particular area, i.e., if you know your turf, does it make sense to research additional – and more demanding – areas to the south, west, and north, and north-east.
Suggested Initial Task Area for pilots flying from Boulder, Colorado. This area is about 90 miles from north to south. It offers great opportunities for a pilot’s first XC flights. Once you’re familiar with this area, expand your task area further.This is a typical view above the northern foothills to the west of Fort Collins as I’m heading back towards Boulder. The terrain below is rolling and unlandable. I’m down to 11,300 ft and the Boulder airport (40 miles ahead) is no longer in glide range. Knowing the landing options is critical so I can concentrate on searching for lift.
If you don’t already know what the best area is for your first cross-country missions, I suggest you ask the more experienced pilots at your soaring site. You want to select a task area that best meets the criteria just described.
1. Research Viable Landing Sites
Assuming you have prioritized and selected a task area for your first cross-country flights the first thing to do is to research where you can safely land.
a) Select suitable airports in your task area
Airports in your task area are easy to identify with the help of a sectional map (or an online version thereof – e.g. skyvector.com). Most will also be marked on the local waypoint database that you can find on the Global Turnpoint Exchange.
However, not every airport is suitable for landing a glider, or for your glider in particular.
Towered airports tend to have big and wide runways but they are not glider friendly. I don’t like the stress of approaching a busy airport and explaining to a controller (who may know very little about gliders) why I am unable to stay in a holding pattern and need to land immediately. I will use such an airport if I have to, but it’s not something I would recommend to anyone on their first cross-country flights.
Smaller public airports are usually the best choice but you have to know how wide the runways are and if the width will be sufficient for the wingspan of your ship. A 60 foot-wide runway may or may not be sufficient for an 18 meter (59 ft span) glider: you also need to know if there are runway lights and whether they are immediately at the runway’s edge or located several feet to either side. If you zoom into satellite images on Google Earth you can usually see the lights. You can then use the online measuring tool to check the distance between them.
The screenshot shows the runway at Eerie, a typical public airport just east of Boulder. If you zoom into the satellite image the runway lights become easily visible and the measuring tool allows you to see that the distance between the lights is 80 ft. You should be fine landing there with an 18m glider (59ft span) but you will want to keep as close as possible to the centerline. With a 20m glider (e.g. our club’s DG505) you will want to be extra careful.
Private airports can also be acceptable choices but you need to be extra careful during your homework. Often they are built and maintained for bush planes with high wings and narrow spans. The terrain may be too uneven for the long and low-hanging wings of a glider, or the ground may be rising next to the edge of a narrow runway.
Online research is a good way to check them out but be very careful not to overlook anything! You can also never be certain that there aren’t any new obstacles when you turn up on final approach: e.g., there may be tall vegetation next to the runway that wasn’t there when the satellite image was taken. A fence may have been erected. Or a huge bison, a vehicle, playing children, or some other unexpected obstacle may appear in the middle of the runway when you arrive. If you land there, most private owners are likely to be welcoming but you may also find the owner absent and your retrieve crew stuck behind locked gates a long driveway away.
Under no circumstances should you trust that private airfields marked on the sectional map or on the waypoint file are suitable. They might not even exist anymore and were just never removed from the map (or the waypoint file)!
Someone recently built this private runway at the north-west corner of South Park between Jefferson and Como, an area where a reliable place to land would be extremely welcome. The runway is 2000 feet long and 34 ft wide. But is it safe to land a glider? In my opinion, probably not. There is a fence post visible on the satellite image, which is 35 ft away from the centerline. Keeping my 59 ft glider at the center of the runway would probably let me avoid the post. But are there other posts that I may have missed? And what’s the obstacle shown a little lower in the picture directly at the runway’s edge? I don’t trust the place. If I have to land in that area I will look to one of the hay fields in the area as a better alternative.
Public airports are generally the best choice for landing out because they tend to present fewer surprises. If the runway is long, smooth, and wide enough for an aero-tow take-off they may also offer the extra conveniences of an aero-retrieve.
b) Where to look for suitable land-out fields
In areas where suitable airports are far apart of poorly located relative to the best soaring conditions, land-out fields can offer a safe alternative.
In some soaring areas fields are large and plentiful. E.g., driving through Texas I noticed that many fields are bigger than most airports and much of the area is as flat as a pancake. At certain times of the year you can land practically anywhere. Land-out Mecca!
However, if your soaring area looks more like Colorado than Texas, it pays to be strategic and ask: are there suitable landout fields where you might need them the most? Here are some prime examples:
Along your final glide path: a common scenario is that you return from a cross country flight at a time of day when the lift is dying. If you are low and hit unexpected sink after you’ve passed the last airport on route, where would you land? E.g., for those flying north from Boulder it is worth researching specific fields between Lyons and Boulder when Vance Brand airport is no longer an option.
The red arrow shows the typical final glide path for XC pilots returning to Boulder from the north. Marked in green to the left just south of the entrance to Left Hand Canyon is a cluster of three fields (hayfields and cattle pastures) that should offer a reasonable place to land if the pilot miscalculated the final glide. Another field is further south just to the west of Boulder Reservoir.
Along the base of the hills and in the valleys: soaring pilots normally fly over the hills and mountains because that’s where the lift tends to be best. If our strategy is to always stay within glide range of a suitable airport, we may be forced to quit searching for lift over the hills and fly out into the plains to an airport while we are still quite high. This means that having to land at that airport becomes very likely because it is usually much harder to find lift over the plains than over the hills. However, if we positively know where we can safely land right at the base of the hills without necessarily having to reach an airport we can continue to search for lift over the hills, thereby greatly increasing the odds of avoiding a landout altogether.
This image shows the terrain west of the Northern Colorado Regional Airport (Ft. Collins/Loveland). This is a busy, towered, airport with a number of lakes in the vicinity. The odds of finding lift are much better above the hills and ridge-lines to the left of the image. If you quit your search over the hills with enough altitude to deal with the tower and the Fort Collins air traffic, you will most likely land at the busy airport. Knowing the location of suitable fields in the area (marked in yellow) gives you more time to continue your search for lift over the hills. (Do not rely on my assessment though – you must do your own research to verify whether a field is landable!).
Before major terrain obstacles: if there are terrain obstacles along your flight path be prepared for the possibility of not being able to clear them. A prime example for Boulder pilots is the northeast corner of South Park: Mount Evans is a big terrain obstacles for pilots returning from the southwest and if pilots fail to find lift to get over the mountains they must know the fields where they can safely land.
Not every terrain obstacle is as obvious as the peak of 14,264 ft Mount Evans, here viewed from South Park. This is the typical return route from the southwest to Boulder. If you cannot get past the mountains your only option is to land in one of the fields below. (You better know which ones are most likely to work.)
Across hostile terrain: glider pilots tend to fly along the same flight paths again and again because energy lines tend to set up in the same places (see chapter 4 below). If such flight paths include long stretches over largely unlandable terrain (e.g. undulating hills, big forested areas, etc) it can be vital to know the precise location of the few places where a somewhat safe landing may be possible.
E.g., for Boulder pilots flying towards Wyoming one such stretch is between Estes Park and the Laramie valley: 50+ miles of mountains, woods, rocks, and canyons with the nearest suitable airport often 30+ miles away. The only (private) airstrip at Crystal Lakes is too narrow for gliders but it is worth knowing the exact location of the only two meadows where an emergency landing might be possible.
Satellite view of “Crystal Lakes Airport”, the only marked (private) airfield in the northern foothills en route to Laramie. Would you land your glider here? I would rather not. It pays to know the location of the two meadows where it may be easier to accomplish a safe landing.
c) How to Research Specific Landout Fields
After deciding where to look for fields you need to do the work of identifying and verifying them. If you are confident about a specific field in a strategic area you should load it into the waypoint database on your flight computer. This is the best way to quickly locate the field when you’re flying.
Starting Point: a good place to start is the Worldwide Turnpoint Exchange. Locate the waypoint file for your area and view it with your flight planning software or in Google Earth. Waypoint files are likely to include some landout fields. Just know that these were put together by volunteers, often many years ago, and you must never rely on them. They are just a starting point for your own research!
Satellite Maps: the next step in your research is to examine satellite imagery on Google Earth or Google Maps. Familiarize yourself with the 3-D view and the use of the distance measuring tool. If you locate a potential field in a strategic area, try to glean as much information as possible from the satellite image.
View the field from all sides in 3-D view to identify any slope. If a slope is visually noticeable the field will almost certainly be unusable.
Next, measure the length and the width of the field with the online measuring tool. Then zoom in and carefully examine the surface: is it possible to tell what kind of field it is?
Can you spot farm animals? Look for any visible rocks, buildings, ditches, irrigation equipment, or other ground obstacles. Demarcation lines across the field (e.g. indicated by different shades of color) could suggest a fence which will not be visible from the satellite image.
Also check for power lines in the area (these may be impossible to detect but shadows sometimes give them away). If there is a road next to the field, assume that a power line may run along the road.
If there are prevailing winds in the area consider what impact they are likely to have on the landing direction.
Imagine how you would fly an approach into the field to identify any terrain or approach obstacles.
Finally, examine the road access. If a field looks good but seems inaccessible for a glider trailer it may just be of use in an emergency.
If you like a field and think it is worthy of further examination, try to do a preliminary evaluation and take notes of anything that may be of concern. I note the GPS coordinates for each potentially viable field and make some initial evaluative guesstimates on a 5-point scale for each of the following characteristics: length, width, slope, surface, potential ground obstacles, approach obstacles, and road access.
I also note potential landing directions. If a field has some clear deficiency I may classify it as “emergency only”. When I later visit a field on the ground I revise my initial evaluation – this process can be eye opening because the reality always looks different than the satellite image.
I use these criteria to evaluate the suitability of landout fields.
Examining the first few fields using this method will take a while but you’ll quickly get better at it. Note, however, that you can never positively identify a field as suitable just from an online review!
Visit and Verify: the only way to get reasonably confident about the suitability of a field is by visiting it.
There are two good ways to do so. The most thorough one is to visit the field on the ground. Ideally you would want to walk around in the field but doing so may involve trespassing and attract unwanted attention. But even just stopping next to the field and looking at it from the road will tell you a lot of things you might have missed.
Small to medium-sized rocks, uneven terrain, fences, ditches, or power lines are typical examples. You might find out that the farmer is now growing tall crops in what previously looked like a hay field. You may find the field full of cattle. You may even find that there is no longer a field at all but a new housing development or a gravel pit..
Visiting fields makes you appreciate the static nature of a satellite image and is a powerful reminder for why you must not blindly trust your online research!
Photos taken during a ground visit to southern Wyoming. In rare situations even a road may serve as a safe landing site. This particular stretch of road met all my criteria. It was long and straight with very little traffic. Most importantly, there were no fences, poles, road signs, or other obstacles to either side and the road itself was slightly elevated relative to the adjacent fields which. (Often a road will be slightly lower than the ground next to it which could easily result in a violent ground loop.)
A good alternative (or complement) is to visit fields by air with a touring motor glider or a small power plane. You might not be able to see everything as well as during a ground visit but you will gain another invaluable perspective: you can fly low approaches into the selected field with the engine idling and then go around. It is easy to imagine what the approach would feel like in a glider. Touring Motor Gliders are particularly well-suited for this endeavor. Another advantage of this methodology is that you can see many fields within just one or two hours whereas a road trip to visit the same fields on the ground might take one or two entire days.
Can you not also examine fields from your regular glider the next time you fly over the same area? Well, you can identify where they are (and you should do that) but you will normally not be able to get close enough to learn much more than what you can learn from viewing satellite images. In Colorado, where we typically fly many thousand feet above the ground, almost every mountain meadow looks easily landable until you get low and close and it becomes obvious that you’d be lucky to survive if you had to put your glider in the middle of it.
Whether you do ground visits, air visits, or both, you should also familiarize yourself with the typical crops and their growing season in your area: what is being grown? how tall does it get? when is it harvested? is the ground soft or firm? In other words: which of the fields will be (most) suitable to land in at the time of your flight and how do you recognize suitable fields from the air? This is even more important if you do your ground visits in the off-season. Fields look vastly different in winter than during the peak soaring season. You should also research the types of irrigation systems being used (if any) and how you can avoid them. Most irrigation systems will not stop when a glider shows up in the field and the machinery might just roll over it.
d) Practice With Condor
This isn’t a necessary step but it is super useful and fun. If you have access to the Condor Soaring Simulator and there is a scenery for your soaring area, you can practice landing in your chosen fields. This has multiple key benefits:
(1) You become familiar with the visual view of the most hostile terrain from “down low” – a perspective that you hope to never see in real life.
(2) You experience what it would be like to land in the fields you have selected, and you test the approaches with different gliders and under different wind conditions. If you ever have to use one of them, you’ll be better prepared and know what to do.
(3) You can repeat this exercise over and over again at no risk to you or your glider until you feel confident that you would not screw it up.
(4) You gain valuable practice for how to land in small fields – how to judge your altitude above ground, how to control your airspeed and glide path, how to clear obstacles, how to deal with cross winds and turbulence, and how to touch down with minimal energy.
These skills come in handy for all your future real-life landings and are invaluable if you have to put your glider into any small field.
A team of SSB pilots is practicing off-field landings in Condor at a private air strip northeast of Colorado Springs.
If you do practice with Condor, remember to never use it for the purpose of field selection! Condor will allow you to land in lots of places that are not at all landable in real life! You must select your fields in real life and use Condor only for landing practice!
2. Understand How High You Need to be Wherever You Fly
One of the most fundamental safety rules in soaring is to always keep an airport or some other suitable landing site within safe glide distance.
However, applying this simple rule isn’t always easy.
a) Benefits and Challenges of Relying on Your Flight Computer
When you’re flying, the easiest method is to use the final glide calculator of your flight computer.
E.g., if set up to do so, my Oudie flight computer will display the expected arrival altitude above a specific airport or landout field if flying at the selected McCready setting (MC).
The screenshot shows the display of my Oudie IGC. You can easily see at a glance that Boulder and Lemons Field are within glide at an MC setting of 4.0 knots. I use a minimum arrival altitude of 1000 ft, which means that I can glide to Boulder and should arrive there at around 1640ft AGL provided that I fly at MC4 and there is no vertical air movement. If I glide to Daves Field, I would arrive 154ft below my safe pattern altitude, i.e. at around 846 ft AGL.
This works pretty well assuming that you selected the correct polar for your glider, that you accurately entered the weight of the pilot and water ballast, that you used reasonable bug settings, that you set an appropriate safe arrival altitude, and that you fly in accordance with MC. It also assumes that there is no vertical air movement along your flight path, especially no unexpected and prolonged sink.
It took me about an entire soaring season to learn to trust my flight computer. This has a lot to do with the fact that I did not trust myself to program it correctly. Remember the standard rule for any analysis or machine output: if you put garbage in, garbage comes out!
I also learned to appreciate the impact of different MC settings (a higher setting gives you some extra safety margin because you can conserve energy by slowing down), and the significance of lift or sink along the way. One of my more memorable learning experiences in this regard was on this long and somewhat exciting final glide.
Anyway, there are a lot of reasons for why I do not recommend that you simply trust the flight computer on your first cross-country flights!
b) Create Your Own Glide Map with Glide Rings
I recommend you use the off-season to study maps and determine for each part of your chosen task area how high you need to be to safely reach the next safe landing area.
How do you do that? You probably learned a simple and reliable method as part of your initial flight training: you take a map of your task area, mark the chosen airports and any personally verified landing fields, and then use a pair of compasses to draw concentric circles around each chosen landing site. Each ring should indicate the minimum altitude that you need to be at in order to glide to the landing site and arrive there at a safe pattern altitude.
First, you pick a safe pattern altitude. I recommend at least 1500 ft, especially for airports or fields where you have not landed recently. For busy airports you may want to add some additional margin.
Then you pick a conservative glide ratio that is appropriate for “sinky” conditions. Since you’re doing this exercise in the off season, you don’t know what the weather will be like on the day you’ll be flying, so err on the safe side. I have encountered 10+kt sink for stretches of five miles or even more. What’s conservative also depends on your soaring area. This excellent booklet on mountain flying recommends to use half of your glider’s best glide ratio. In benign conditions this will feel overly conservative. In extreme conditions it may not be conservative enough! You may also want to discuss this with your flight instructor.
For Boulder I have created such a map with the help of Glideplan, a special piece of software that I bought for this purpose. Note that this map is designed for high performance gliders and assumes a glide ratio of 1:27. It may thus not be as conservative as you want it to be!
Small excerpt of my Boulder Glide Plan Map. You’ll get the idea. Note that Glideplan does NOT account for terrain obstacles. See the next section below!
Glideplan is just a tool that facilitates the drawing of such circles on top of a current Sectional Chart but you can easily accomplish the same thing manually, using the process described above. One advantage of doing this by hand is that you will better remember the information when you’re flying. You can of course put a physical map with glide rings into your cockpit but I personally found it quite challenging to use during flight, especially when you are already relatively low and your workload is pretty high.
c) Account for Terrain Obstacles
Whether you create your glide map with glide rings, use a software to do so, or rely primarily on your glide computer: make sure you account for terrain obstacles that may lie between you and your nearest landing site(s).
Some glide computers such as the LX 9000, ClearNav, or even open source software such as TopHat and XC Soar will help you with this by displaying a “glide amoeba” on your screen. This will show if your glide path is blocked by a mountain, hill, or ridge line. Other computers such as the Oudie do not offer such a feature.
Whether you have such a computer or not, you should study the potential terrain obstacles that may exist in your task area and account for this by adjusting your personal glide map so that you positively know how high you need to be at any given point to clear any obstacles that may exist. To do so, just use a safe minimum clearance altitude for your obstacles (e.g. 500-1000 ft) and then apply the same conservative glide ratio from there.
For pilots flying from Boulder, here is a brief list of some of the terrain obstacles nearby:
Flatirons – do not get low on the west side of the Flatirons. Your only escape route may be through Eldorado Canyon and chances are that you will not make it back to Boulder.
Thorodin Mountain and Black Hawk – do not get trapped on the west side of Thorodin Mountain. Your glide computer may show Boulder airport in glide but chances are that you’re not. There are no safe landing options in that area. You may not even be able to glide out to one of the (poor) fields near Golden.
High terrain east of Estes Park – if you get low in the Estes Valley, you will get trapped by the hills to the east. The landing options in Estes Park are marginal at best. This flight got me to contemplate my options.
The Rampart Range. This is a ridge line along the southern foothills roughly between Twin Ceders (south of Conifer) and Woodland Park (northwest of Colorado Springs). Good lift can often be found along the convergence several miles west of the Rampart Range (e.g. near Cheesman Lake). However, be careful not to get trapped over completely hostile terrain between the Rampart Range and the Terryall Mountains (the ridge line along the eastern edge of South Park) to the west. Your computer may show the private airfield of Perry Park in glide but there is no way to get there. Before you know it, ditching your glider in the lake could become the safest of all the unpleasant options. On my first flight over Pikes Peak I dropped to 12,700 ft, uncomfortably low for in this area.
3. Familiarize Yourself With Typical Energy Lines
Following the advice in sections 1. and 2. above should help you stay safe during your first cross-country flights. This last section will help you find the most common lift lines within your task area.
It’s easy to see why that’s important: following lift lines makes it much easier to go places and you’re also more likely able to stay high and avoid having to put your land-out knowledge to an early test. After all, wouldn’t it be great if your first XC flights were successful and free of land-out-stress?
Most soaring areas have typical recurring weather patterns. For each weather situation, lift lines tend to set up in roughly the same places again and again. This is especially true for mountain sites where ridge lift, convergence lift, and wave lift are a function of topography and wind. Many mountain sites also benefit from valley breeze, mainly a function of topography and sun angle. Thermals almost always set up first over the high ground where they are also stronger (albeit often narrower).
The most frequent energy line for Boulder pilots is the convergence that normally sets up east of the Rocky Mountains. In this image it is marked by low hanging “curtain clouds” to the right. The best lift is always just to the west of these curtain clouds. On some days you can fly straight along the convergence without having to stop and turn.
You will be able to obtain a wealth of information by talking to experienced cross country pilots at your site who are often eager to share their exploits. Quiz them about what lines they fly most often in the most common weather and wind patterns, and what causes the more typical energy lines to set up.
Another way to find out is to download flight traces from flight sharing sites such as OLC (Online Contest). Pick the better traces of pilots who are know to fly the longest and fastest tasks at your specific site. Also, if competitions were held in your area, it is useful to download the flight traces from contest tasks.
Once you have found and downloaded such traces (20-50 traces is a good number to start), load them all into a flight analysis software such as SeeYou and overlay them on a single screen. (OLC limits your download to 20 flights per day, so just stick with it over a number of days.) Chances are that the patterns will jump right out at you.
If you can see where pilots fly most frequently you still want to understand why they tend to find lift along the same lines. The answers are likely very specific to your site and once again it is best to quiz these pilots directly.
As an example of what you can learn from contest flights, take a look at this analysis that I completed in preparation for a contest in Montague, California. The typical flight patterns are easy to see. Conversations with pilots who previously competed there helped me understand the energy lines.
Bringing It All Together
“Bucket 3 pilots” don’t stay stuck in glide range around their home airport but neither do they head out blindly over unfamiliar and potentially hostile terrain. Instead, they have done their homework. They selected an appropriate task area. They know where they can land safely. For each part of their task area they understand how high they have to be to clear terrain obstacles and reach safe landing sites. They also understand the typical energy lines that tend to set up in their task area. In other words: they know their turf.
By becoming a bucket 3 pilot you drastically increase your chances that your first cross-country flights will be successful, safe, and less stressful.
Boulder pilots can take a look at my personal Boulder Soaring Area Map where I have documented the results of my own research. Instructions for interpreting and using this map can be found here. This is and will always remain a “work in progress”. I have visited many fields on the ground, especially along the Front Range and across South Park. An evaluation of fields along the Northern Front Range dating back to 2017 can be found here.
However, remember that such visits are just a snapshot in time based on what I could observe on the specific day of my visit. Our environment obviously continues to evolve.
Given the size of the covered task area, it would also be impractical to visit all the potential landing sites in person. If I am not certain about a field, I will only treat it as an “emergency site:” good enough to minimize physical harm to myself but not to my glider. As a rule, I keep at least one good airport or a positively known landable site in glide at all times. I will only fly over “emergency-only terrain” when I am certain that I there is a line of good lift along the way.
If this seems like too much work remember to limit your initial task area! Your first XC flights won’t lead you all across your state or even into neighboring states. By selecting an appropriate and realistic task area for your first cross-country flights you can drastically reduce the scope of the required homework. One or two weekends of online research, a few phone calls with experienced XC pilots at your soaring site, plus a day or two of visiting fields on the ground (or a flight in a touring motor glider) should give you plenty of information.
If that still feels like too much work there’s nothing wrong if you keep floating around your home airport! After all, it’s your hobby and our choice what you make of it. Just don’t succumb to the temptation of heading out into the hostile unknown!
However, if you have read all the way to the end, you must have what it takes to become a Bucket 3 pilot. Have fun getting to know your turf! I wish you great success on your upcoming cross-country missions.
Note: in the initial publication of this article I made a mistake when extracting data points from the JS3 polar curve. Thanks to Matthew Scutter for pointing this out to me. This error has been corrected below.
The published performance data from Jonkers Sailplanes and Schempp-Hirth, suggest a very significant performance advantages of the JS3 over the Ventus 2cxT.
The data suggest that a ballasted JS 3 flies 12% faster than a ballasted Ventus 2cT at a wing-loading of 51 kg/sqm. Unballasted, the JS3 is shown to be 9-10% faster than an unballasted Ventus 2cxT. (All data shown are for 18m configuration.)
However, one complication is that ballasted (or unballasted) the wing loading for the two gliders is different.
Let’s try to create a more “apples to apples” comparison by comparing the published performance figures at equal wing loading. To do that we have to estimate the values for the JS3 at a wing loading of 51kg/sqm and that of the Ventus 2cxT at 40kg/sqm. (To create the estimate I assumed that the attainable speed at a given sink rate for each of the gliders increases linearly with additional wing loading. This methodology is probably not exactly accurate but any other plausible method would yield almost identical results.)
The table shows that even at equal wing loading the polar data still suggest a performance difference of 6-7% for the JS3.
[Side Note: per the manufacturer flight manual my Ventus 2cxT has a maximum all-up mass of 600kg (1323 lb) and is not limited to 565kg (1246 lb) as the polar curve suggests. I.e., the maximum permissible wing loading is 54.4 kg/sqm and not just 51 kg/sqm. ]
Do those data points hold up in reality?
A little while ago I wrote about a Practice Race Day in Nephi on July 1. One aspect that I did not give much attention was the difference in glider performance between John Seaborn’s JS3 and my Ventus 2cxT. John and I flew the last 92.7 km (57.6 miles) within just three minutes of each other, which makes the results directly comparable.
I took a closer look at our flight traces to see how well my Ventus 2cxT held up against John’s JS3. As a multiple National Champion John is unquestionably the better pilot, so we should expect John’s final glide to be at least 6-7% faster than mine if the published glider performance data are true AND if we flew with identical wing loading. (Both of us flew with 18 meter configurations.)
I was flying with approx. 80 liter of water ballast that day, which means my wing loading was right around 10 lbs/sqft (49 kg/sqm), very close to the 51 kg/sqm that Schempp-Hirth uses for their published polar curve.
I do not know how much ballast John had on board (although I do know that he flew with water that day) but I think it is likely that his JS3 was at or close to maximum gross weight, which would mean a wing loading of more than 12 lbs/sqft (close to 60 kg/sqm). At full wingloading his JS3 should be about 12% faster than my Ventus.
Is this true? Let’s see!
This image shows our starting position with both gliders overlapping in the same position. We both have one turn-point to go to (the red circle at the top right of the image), and then race to Nephi (shown at the top left of the image). The distance from our current position to Nephi is 57.6 statute miles (or 92.7 kilometers).
My flight trace is shown in red, and John’s is shown in blue. Note that at this “starting point” John was exactly 3:00 minutes behind me. My red glider is shown at 16:11:41 local time. John reached the same spot (the location of his blue glider) at 16:14:41 local time.
What makes this flight so comparable is that we reached this location not only within 3 minutes of one another but also almost exactly at the same altitude. In fact, I was at 16,428 ft MSL and John was at 16,508 ft, i.e., only 82 feet higher.
Let’s take a look at our positions exactly 5 minutes later. I.e., my location as shown is at 16:16:41, and John’s position is shown exactly three minutes later, at 16:19:41.
We’re still neck to neck although John took a slightly more easterly line. John also flew a little faster than me during his cruise, thereby losing more altitude, and decided to make two extra circles in good lift (where he gained 700 feet of altitude). At 16:19:41 he was 270 degrees into his first circle. My altitude was 16,672 and John’s was 16,494. I.e., I was now 178 ft higher than John.
Let’s wind the clock forward another five minutes, i.e. 10 minutes into the glide):
There is still hardly any visible difference in terms of our location. Since the prior position I had taken one pointless turn which netted absolutely no change in altitude. John’s 700 ft altitude gain in his two circles is now reflected in a positive altitude difference between our gliders of 675 ft: I am at 15,639 ft and John is at 16,314 ft.
Purists may say that the true final glide only starts here since neither of us stopped to climb from this position until the finish.
Let’s jump ahead another five minutes. We’re now 15 minutes into the glide:
John took advantage of his positive altitude difference and flew significantly faster than I did. He is now almost exactly 2 miles (3.2 km) ahead of me and about to enter the final turn point. At our flying speeds this means that John is now almost exactly one minute ahead. However, John’s higher speed came at the price of 1000 ft of additional altitude lost over the past five minutes: while he was previously 675 higher, he is now 371 ft lower. I’m now at 14,697 and John is at 14,326.
Once, again, let’s jump another five minutes ahead. We’re now 20 minutes into the glide:
John is still approx. 2 miles ahead. I have put the nose down with the finish in sight and am more rapidly losing altitude. At such very high speeds there is a steep price to pay for flying with less than maximum wing loading. I am now at 12,010 feet and John is now almost 300 feet higher at 12,308 ft.
There is still just over five minutes to go, so let’s jump to the last checkpoint before the finish. We’re now 25 minutes into the glide:
John expanded his lead to 3 miles (5 km). He’s been flying close to Vne and is now also dropping altitude more quickly. John’s altitude is now 9,365 ft and I am now almost 1000 ft higher at 10,327 ft.
It’s now obvious that John is clearly ahead and I can’t do anything to catch up. Let’s look at the finish line:
John is crossing the finish at 16:40:11 at an altitude of 9,221 ft. My position is shown at 16:37:11 (exactly 3 minutes earlier to maintain the same 3:00 minute difference that we have started out with). I’m still exactly 3 miles (5 km) behind and at 9,983 ft.
I will cross the finish line at 16:38:30 at an altitude of 9,671 ft.
John’s 93km glide took him a total of 25 minutes and 30 seconds, and mine tool 26 minutes and 49 seconds. In other words, the entire final glide took me 1 minute and 19 seconds longer than it took John. The difference of 1 minute and 19 seconds is 5.1% (79 seconds / 1530 seconds).
5.1% is quite significant but it is clearly less than the published polar curves suggest, especially if John flew close to maximum wing loading.
In addition we can see that John also lost 532 ft more altitude than I did during the final glide (John lost 7287 ft whereas I lost 6755 ft).
It would be tempting to say that at John’s average climb rate of 490 fpm for the entire flight, it would have taken him 1 minute and 5 seconds to gain that 532 ft of altitude and the net advantage of his JS3 on final glide was therefore only 14 seconds (1:19 minus 1:05 minutes) – i.e. only 0.9% (14/1530 seconds).
However, such an argument – while mathematically correct – would miss the point that flying faster at a speed that would have resulted in an additional loss of 532 feet would not have allowed me to reduce my finishing time difference from 1:19 minutes to just 14 seconds. The reason is that the speed polar drops off quite steeply at such high speeds. A better way to save time would have been for me to just not do that one pointless exploratory turn. This one turn cost me 50 seconds and netted no altitude gain at all. Omitting this turn alone would have reduced my finishing gap from 1:19 to 29 seconds.
In summary I can say that my Ventus 2cxT held up quite well against John’s JS3. In other words, it confirms that John’s superior performance over the entire flight has much more to do with pilot skill (e.g. during John’s only turn during the glide he gained 700 feet in 70 seconds compared to my 0 ft gain in 50 seconds) than with any performance advantage that his JS3 may have over my Ventus 2cxT. This also is confirmed by my prior analysis of all other aspects of this flight.
Clearly, this analysis is just based on one flight and not under “laboratory” conditions. It is not scientifically valid because not all variables were “held equal.” We did fly three minutes apart and it is possible (tough doubtful) that the conditions were more favorable three minutes earlier. We also took a slightly different line above the Wasatch Plateau and I might have gotten lucky. But I doubt it. I’m fairly confident that the performance difference between the two gliders is exaggerated. If anyone wants to do the performance analysis for themselves, the flight traces can be found here: John Seaborn’s trace and Clemens Ceipek’s trace.
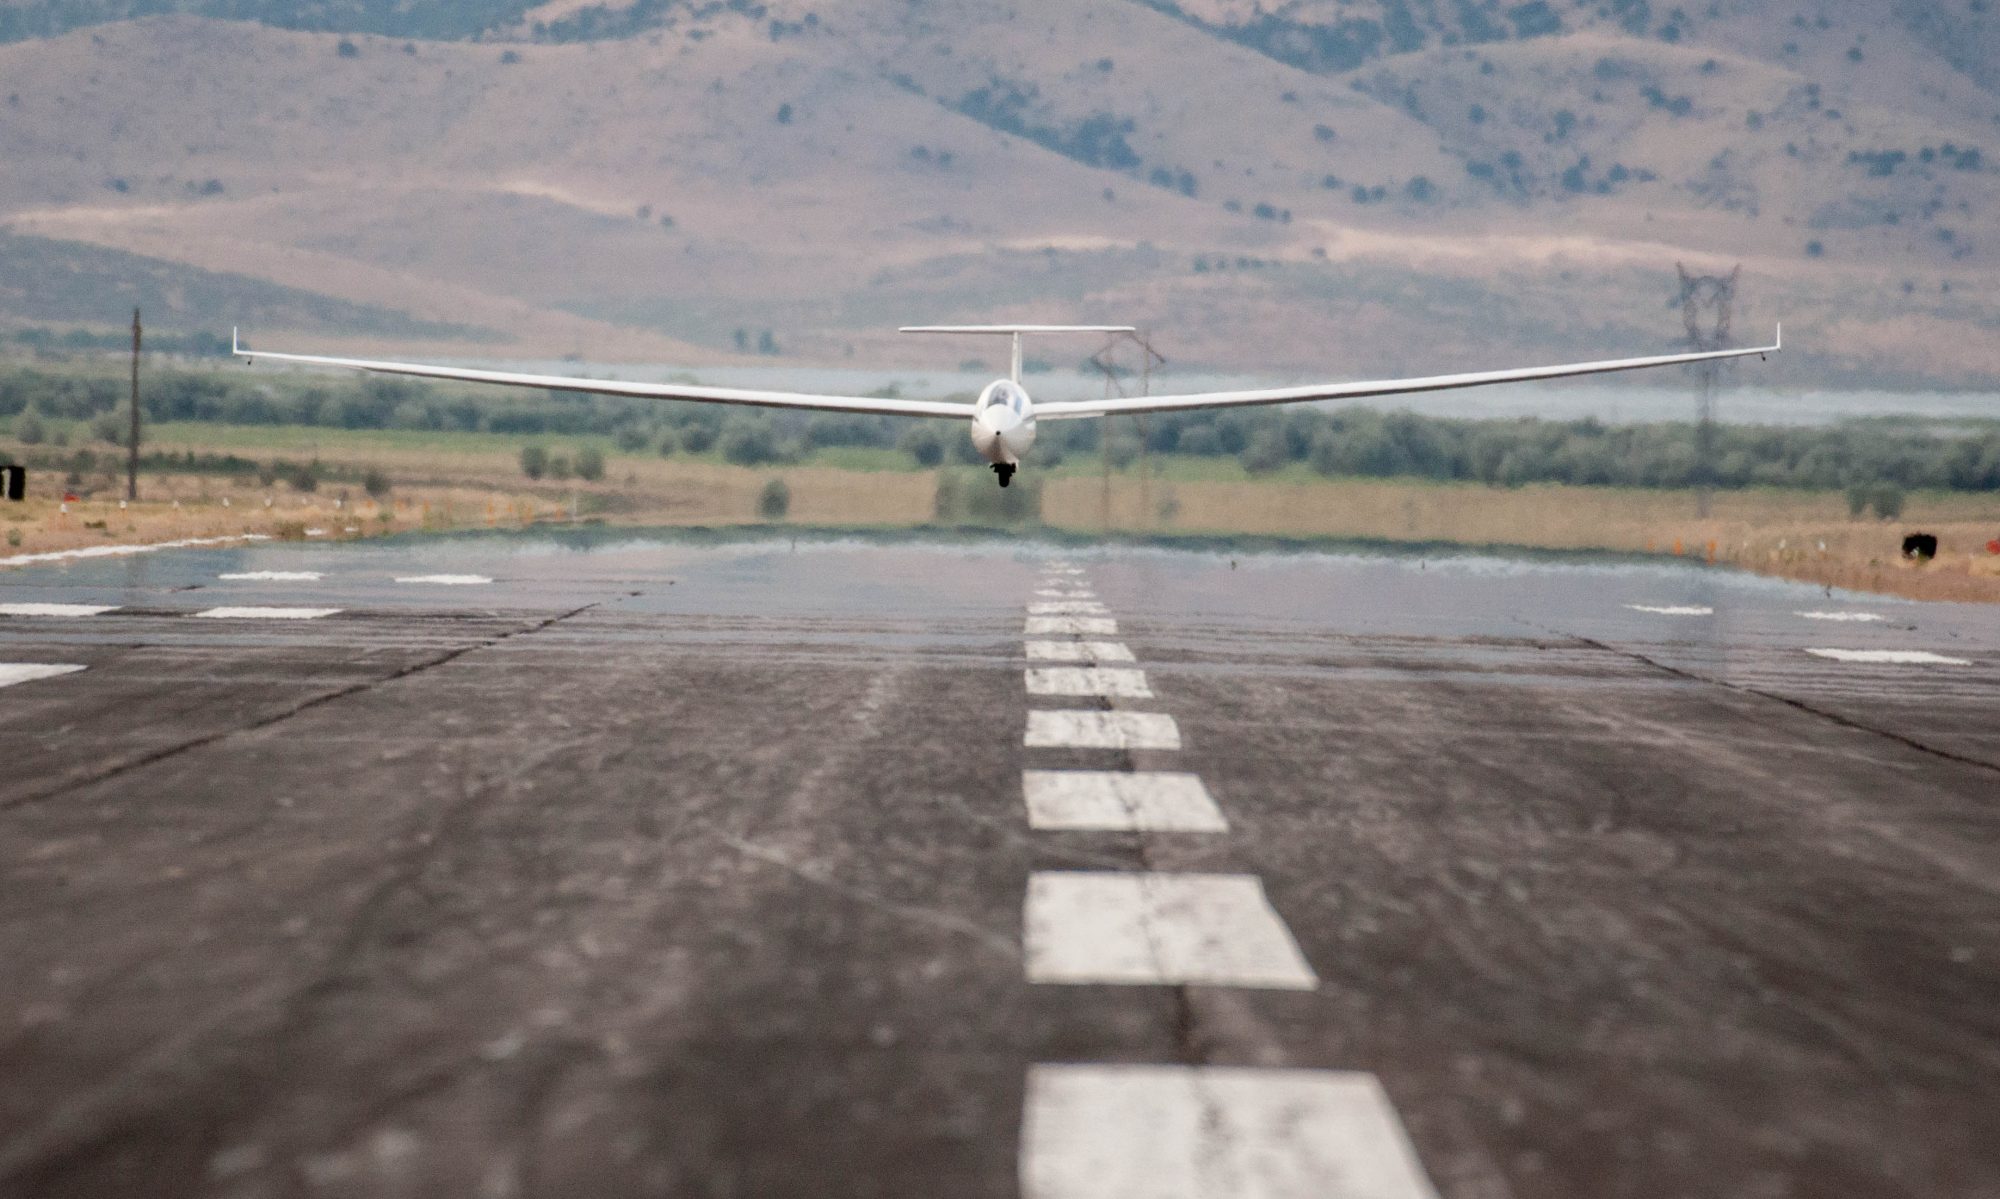
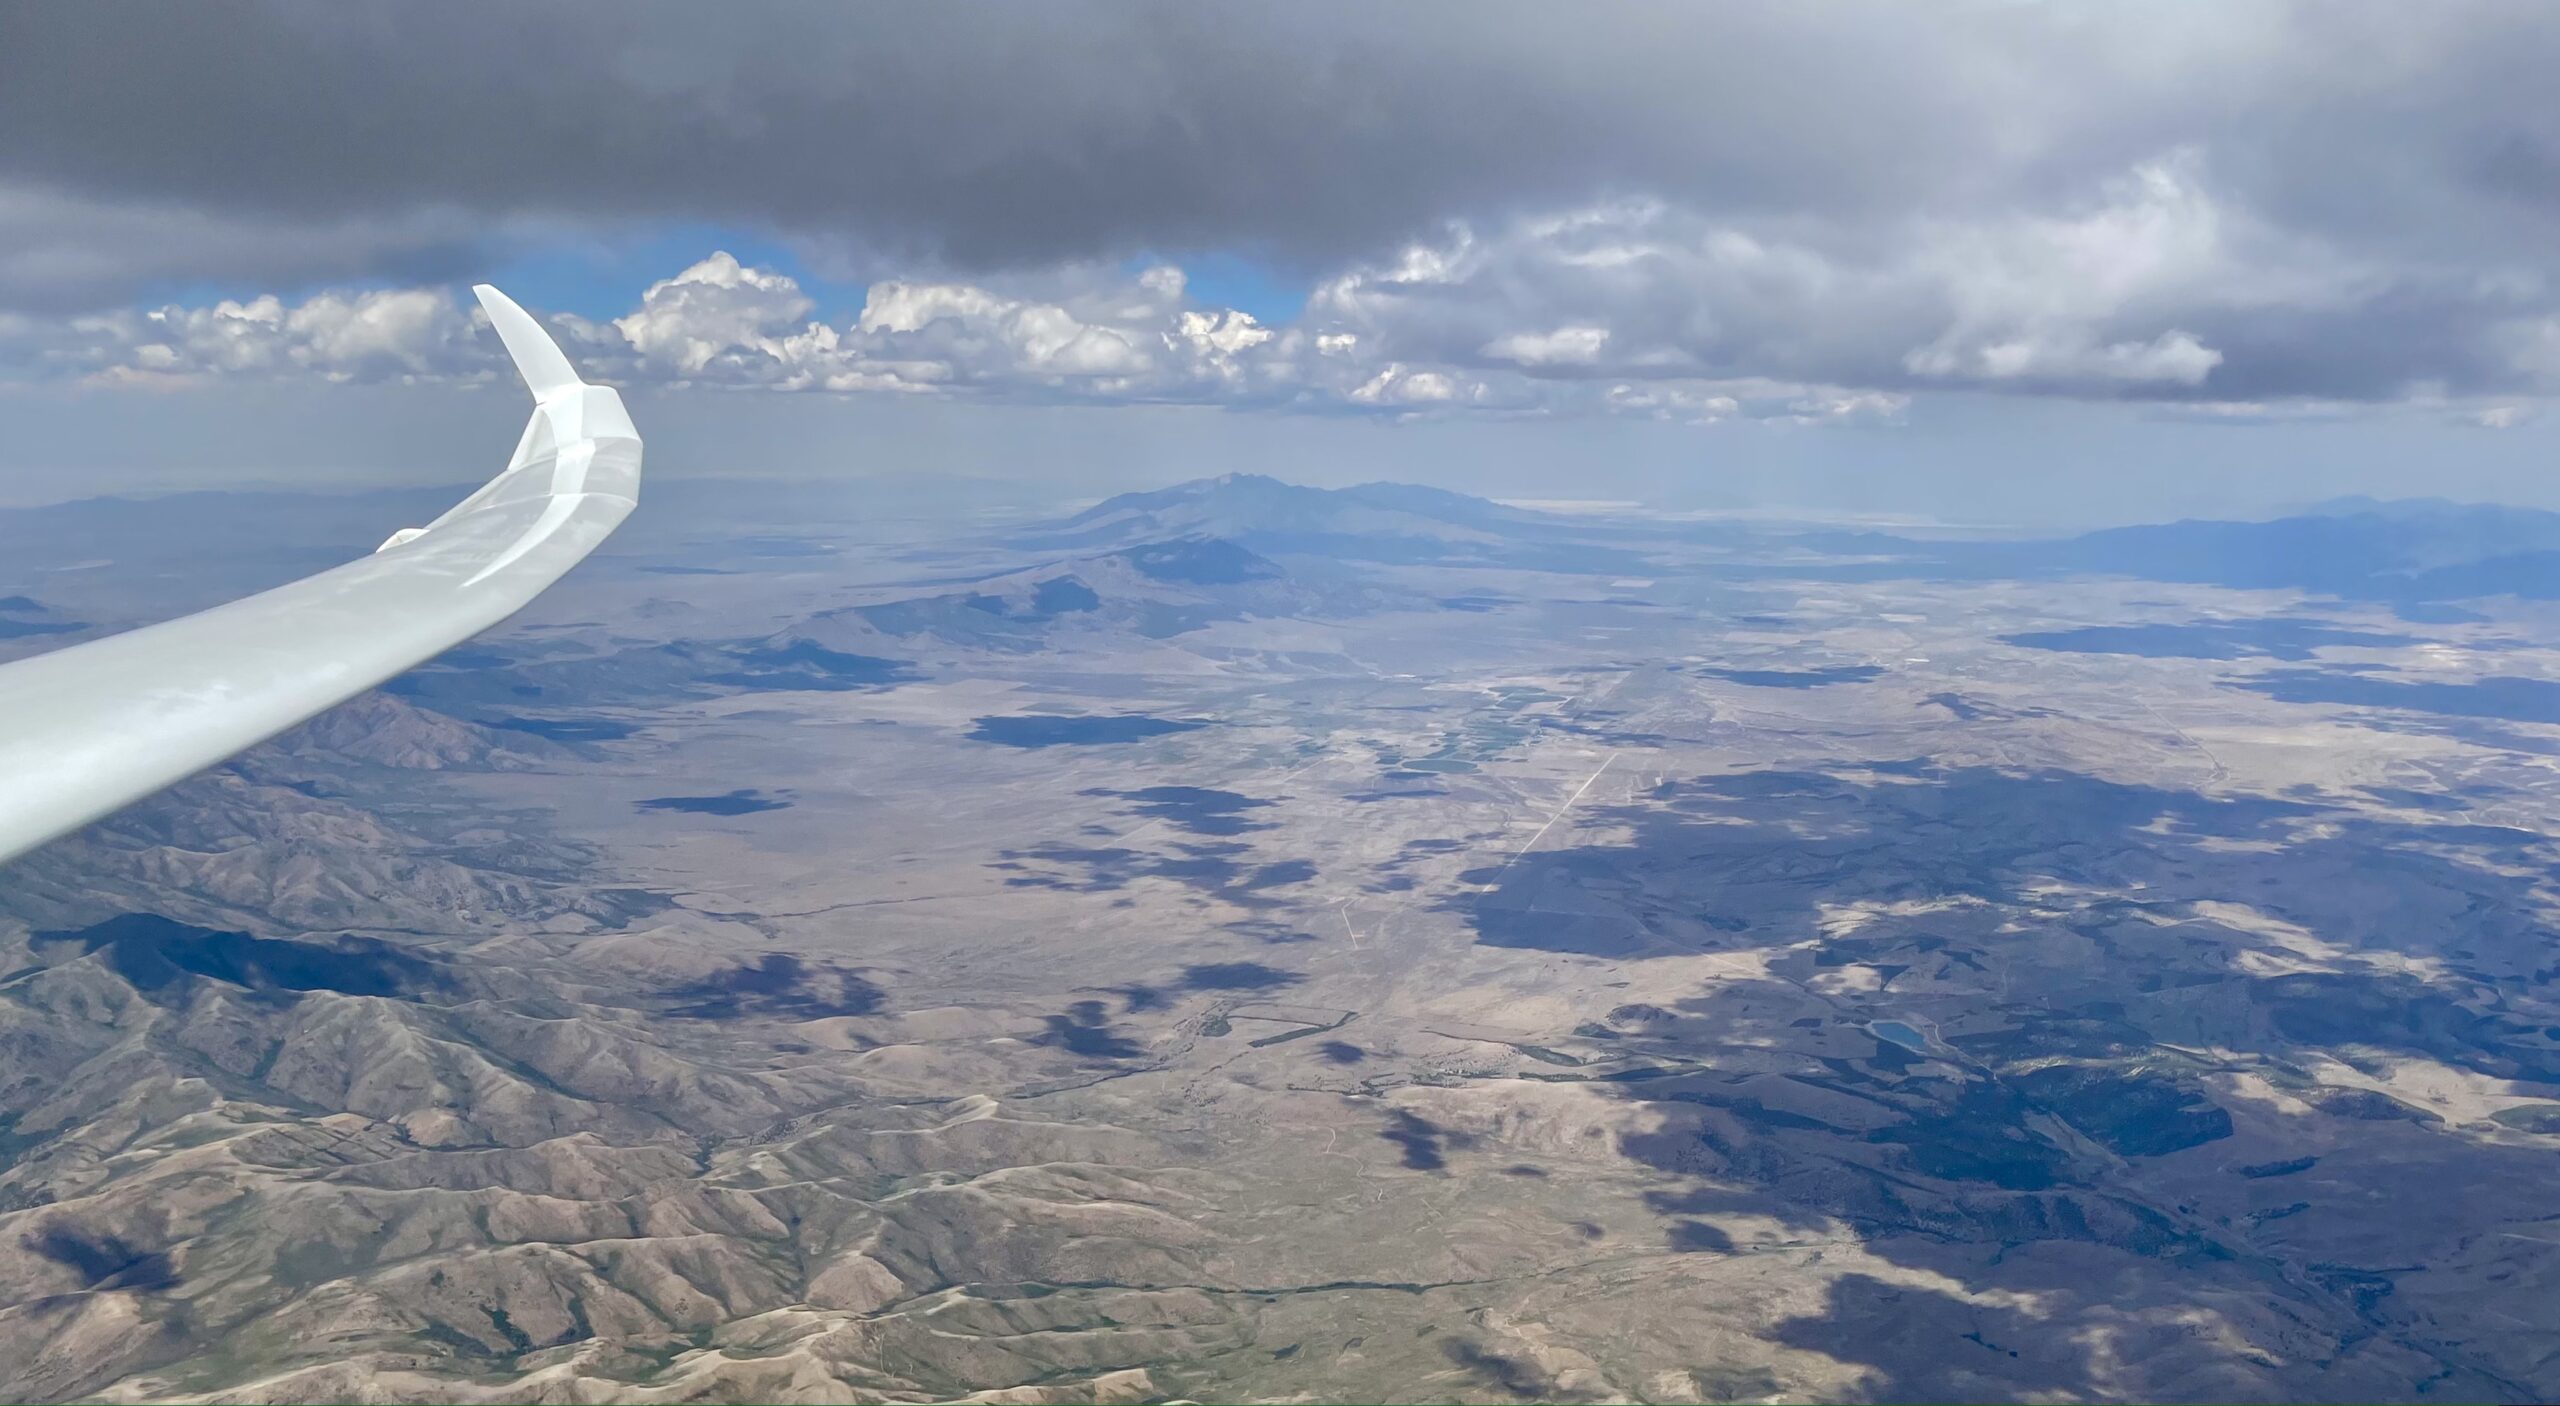
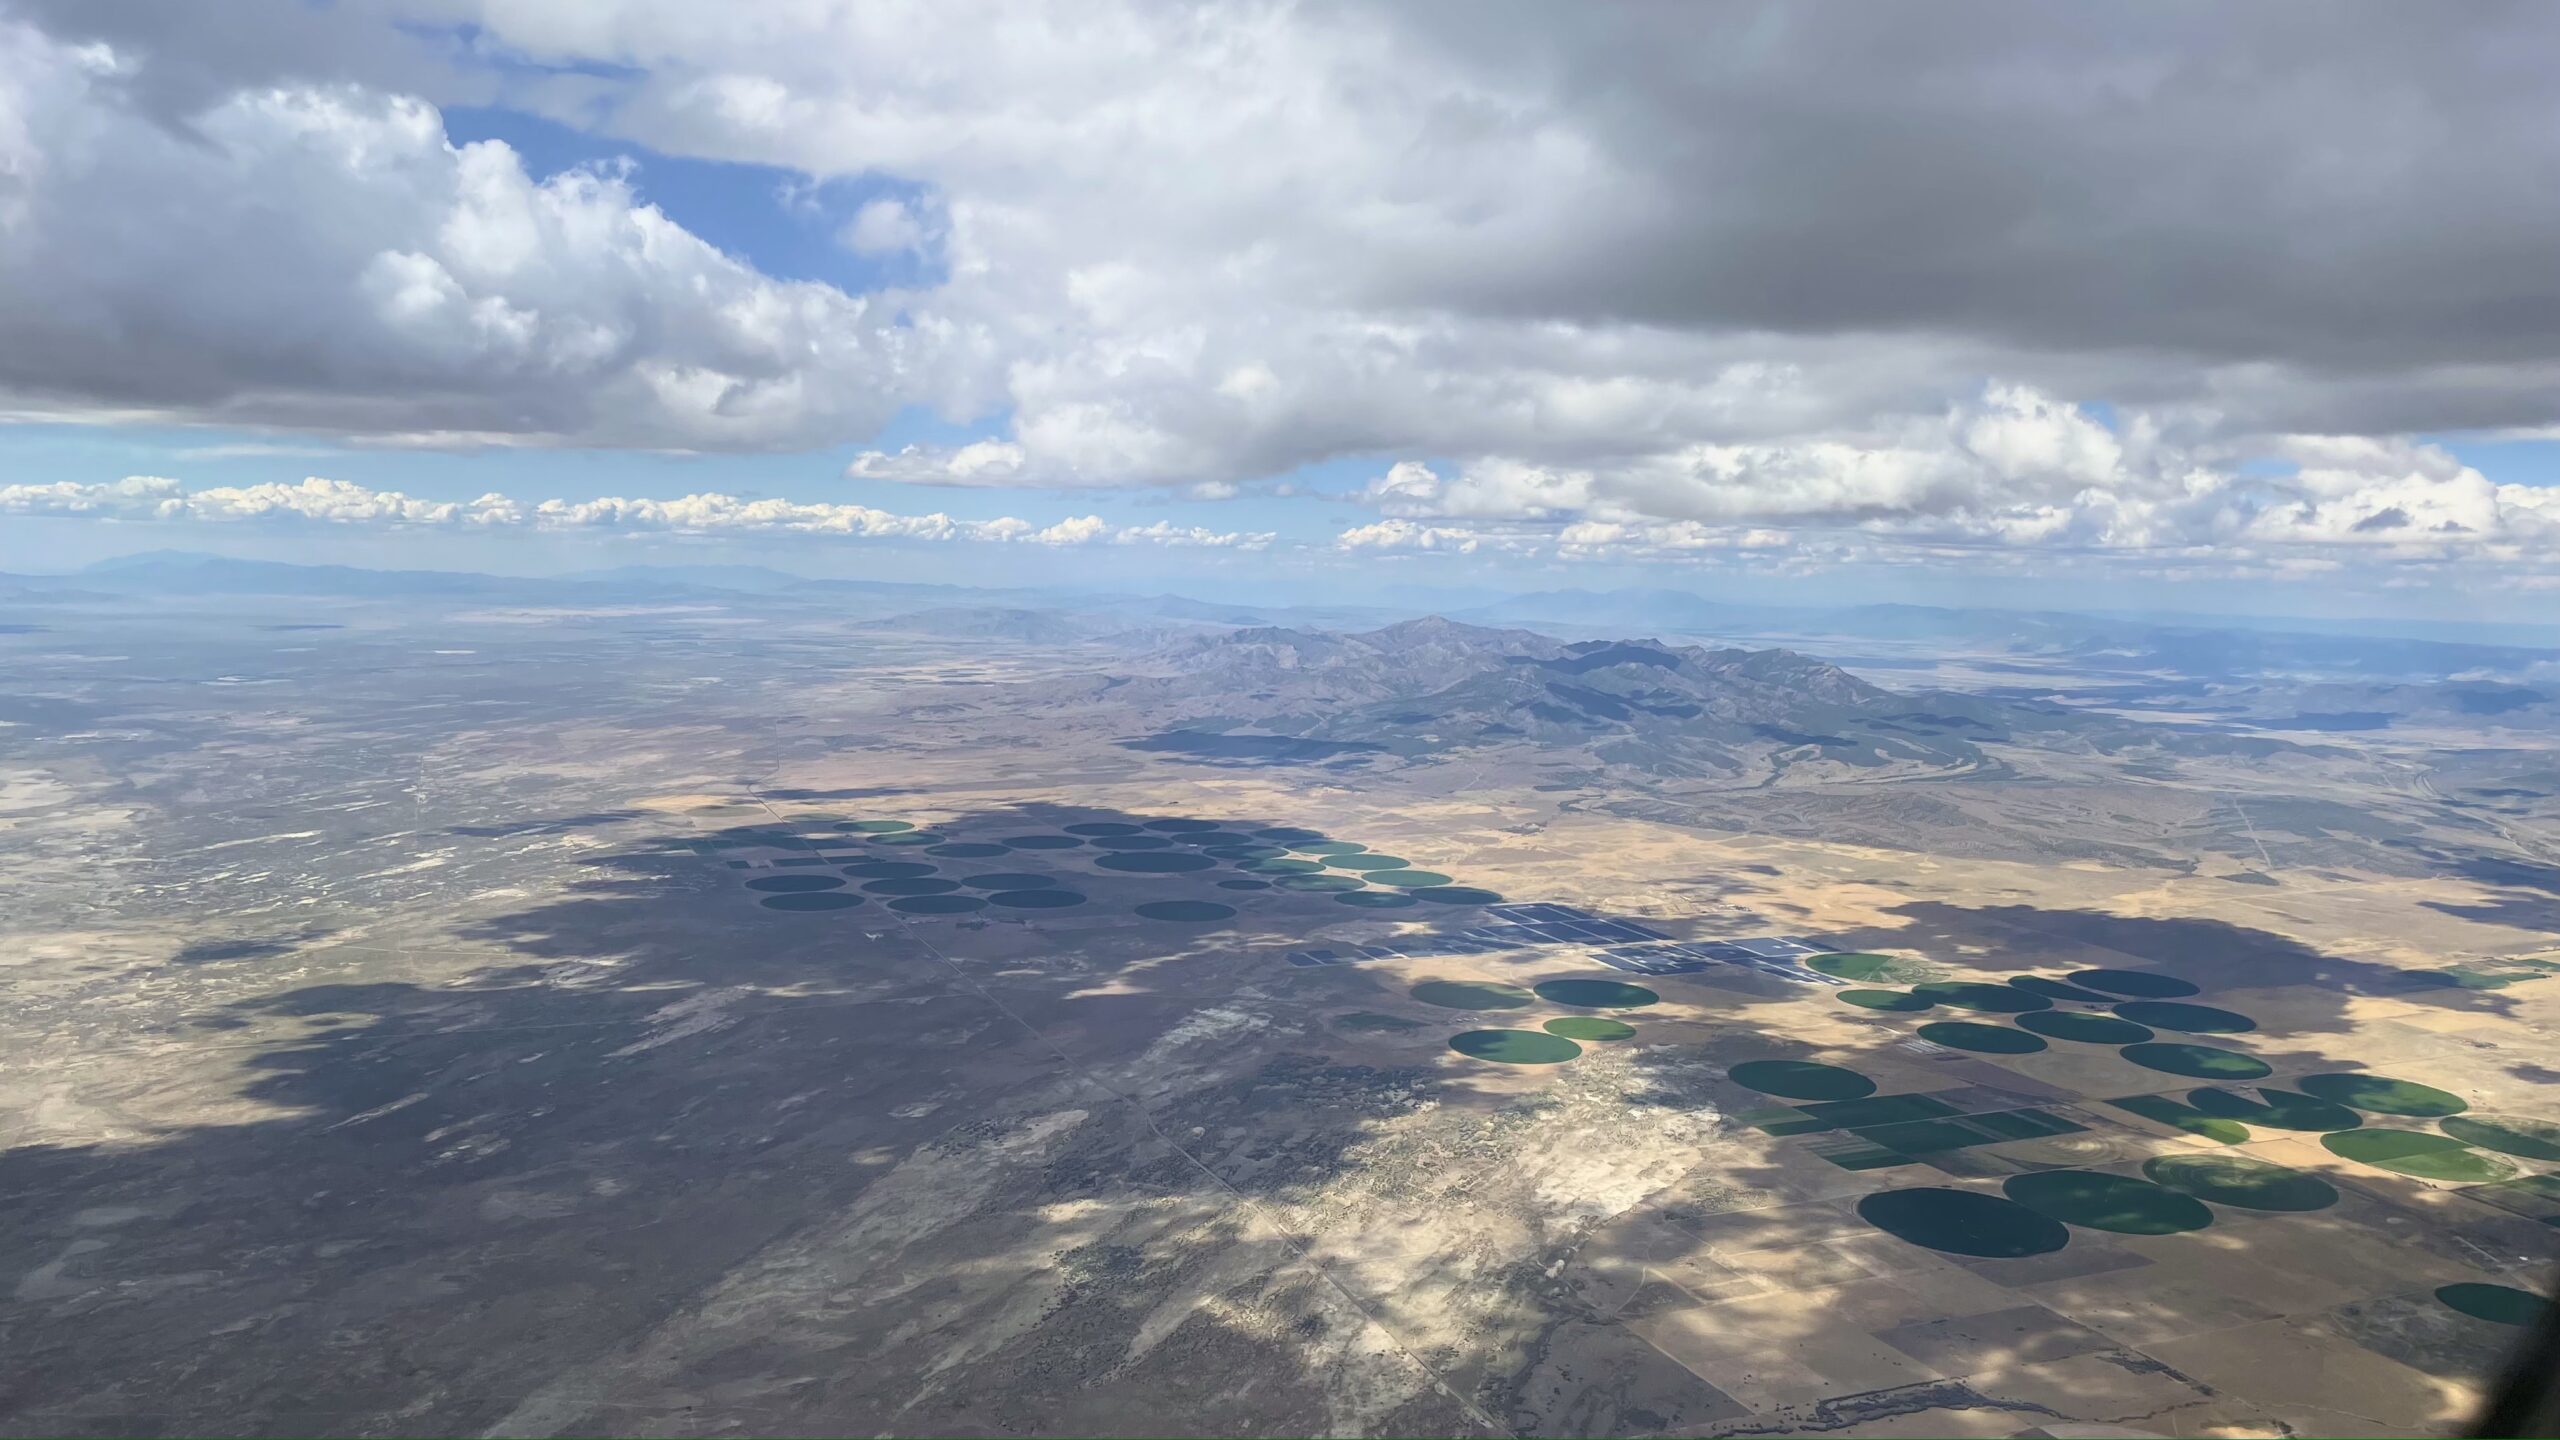

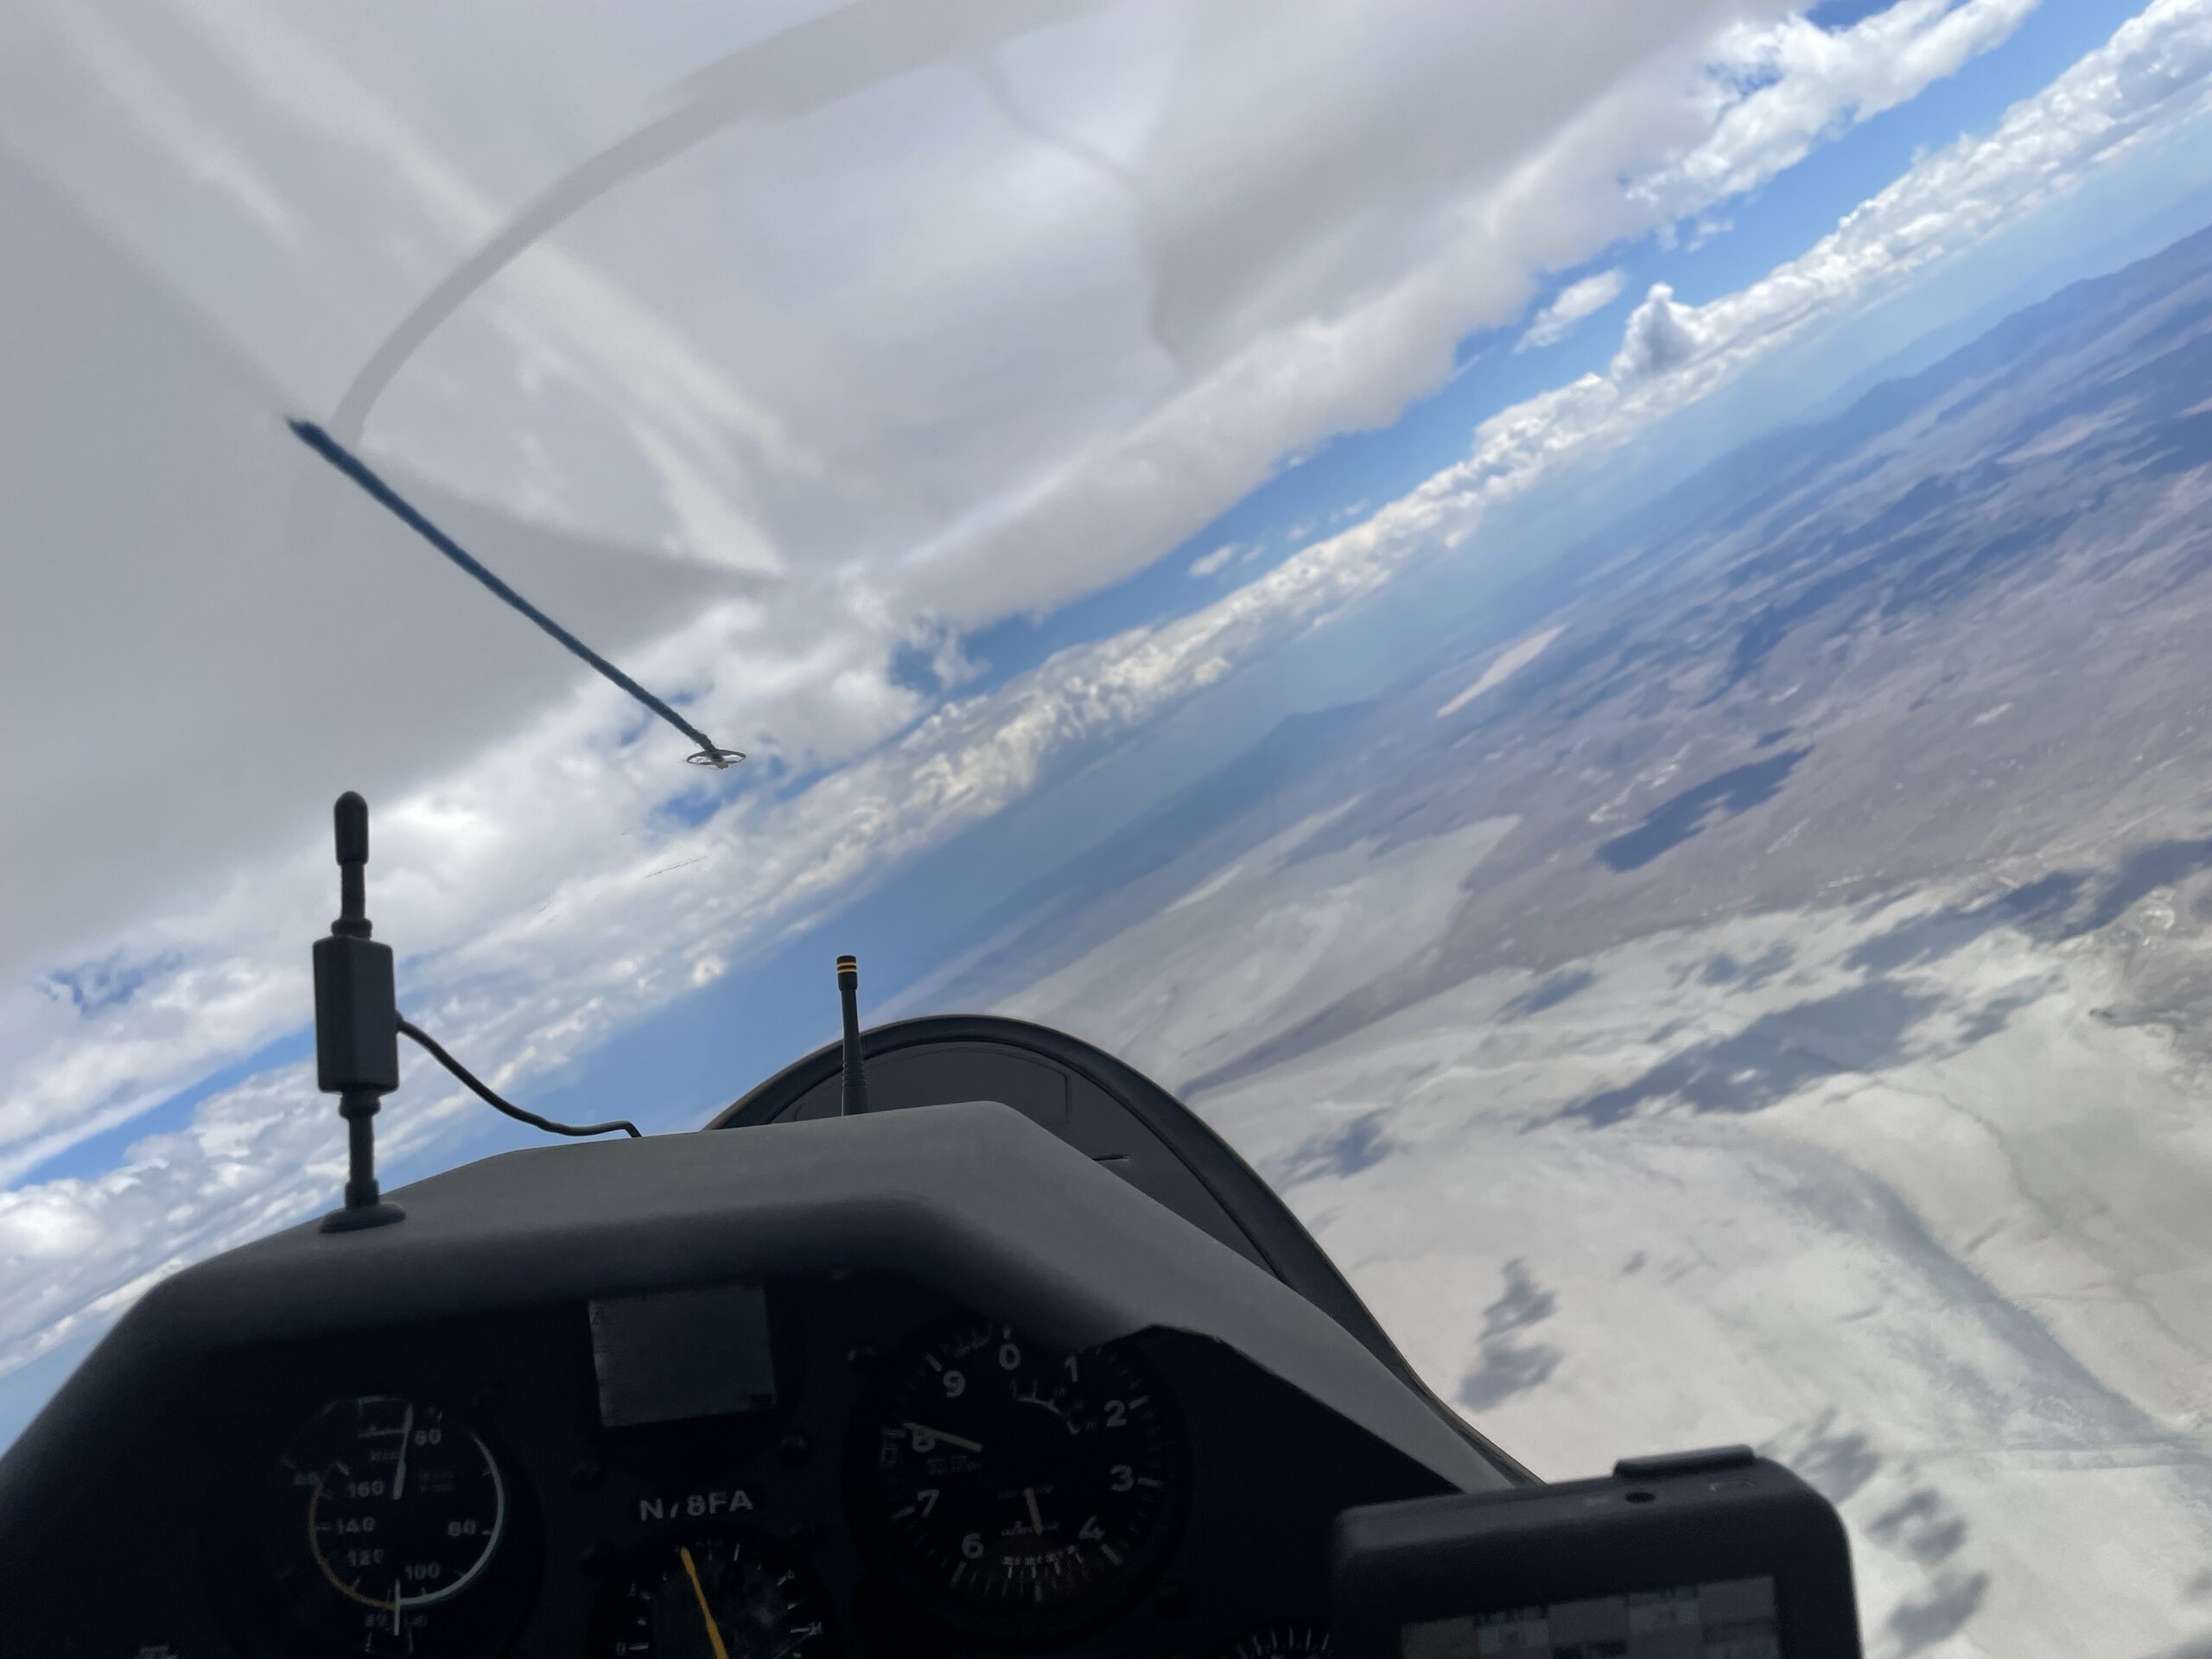
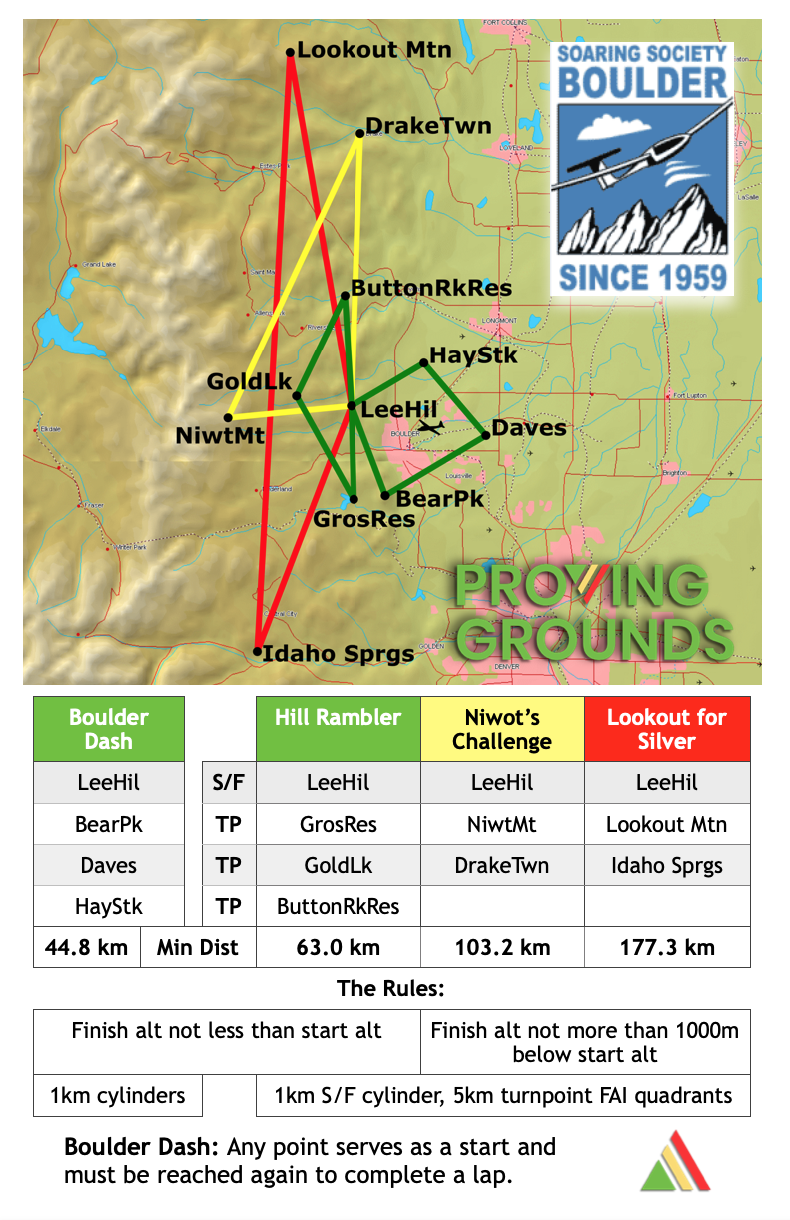
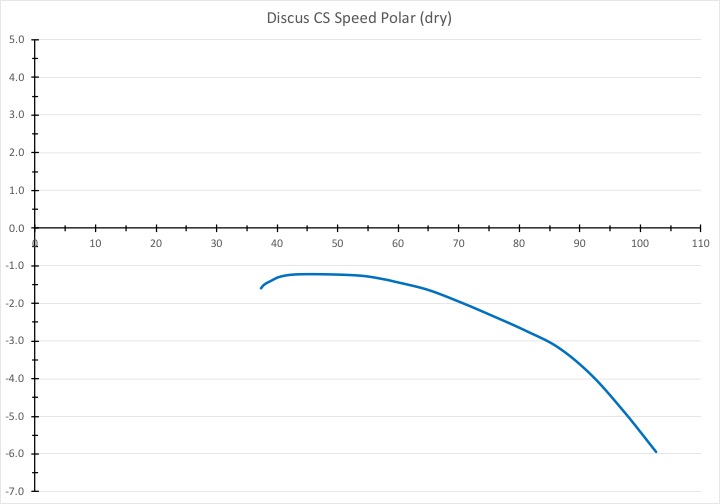
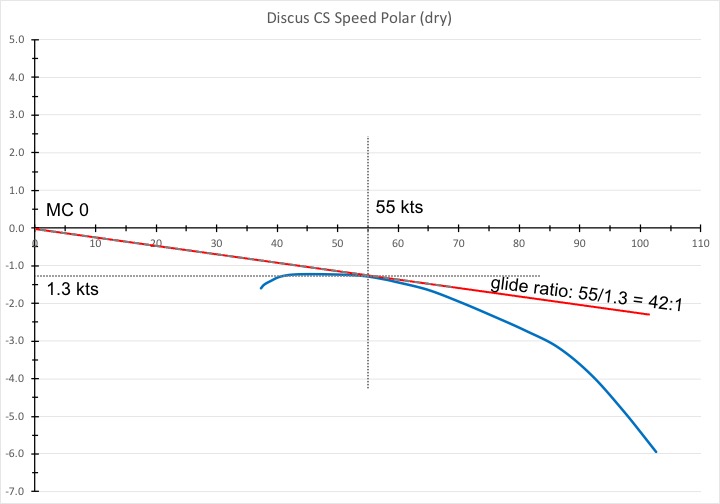
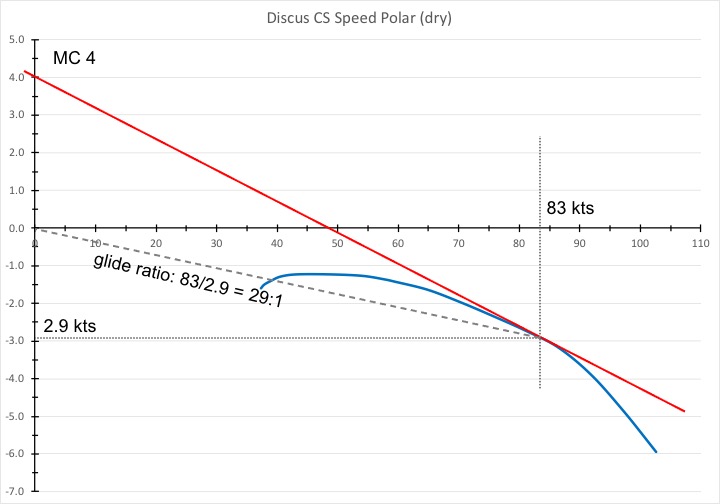
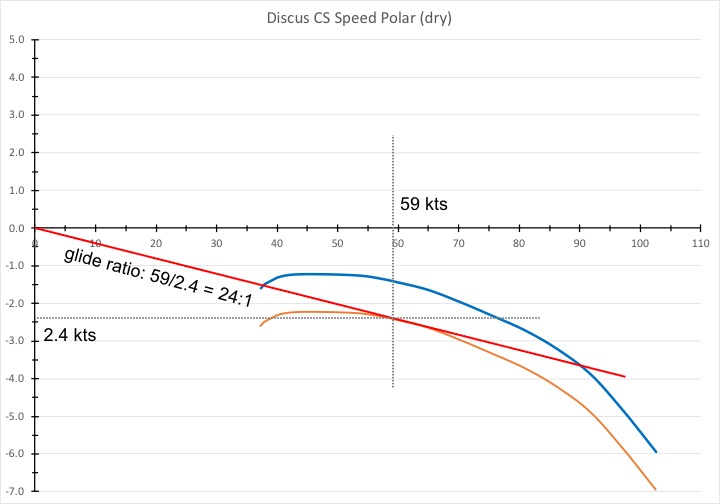
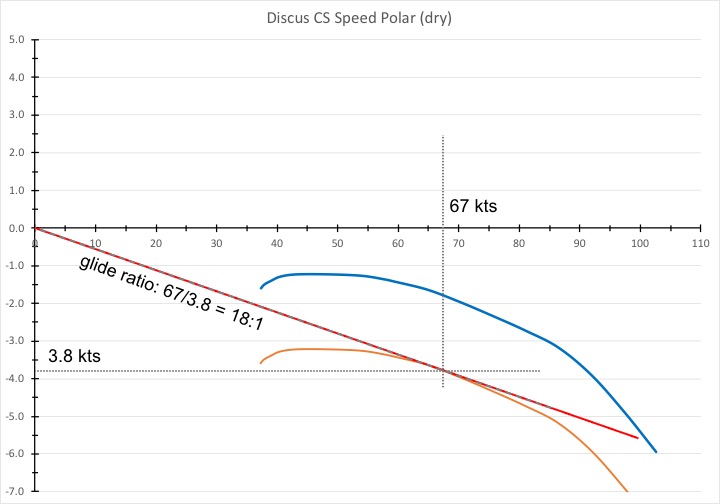
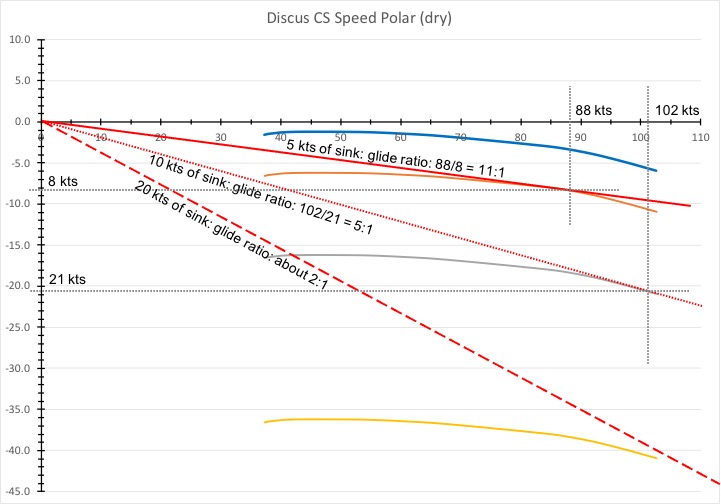
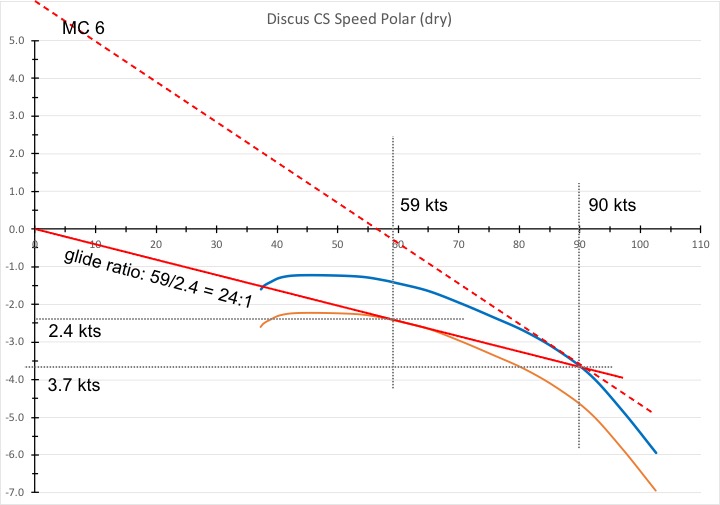
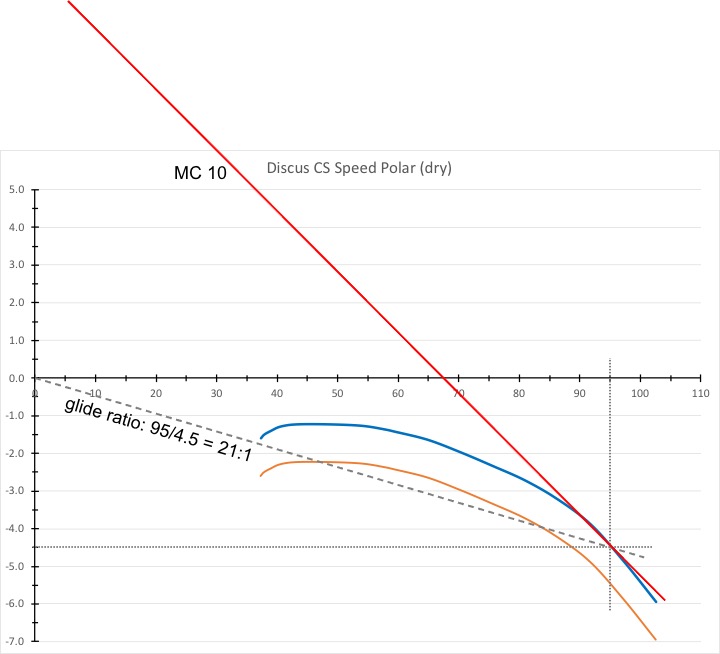
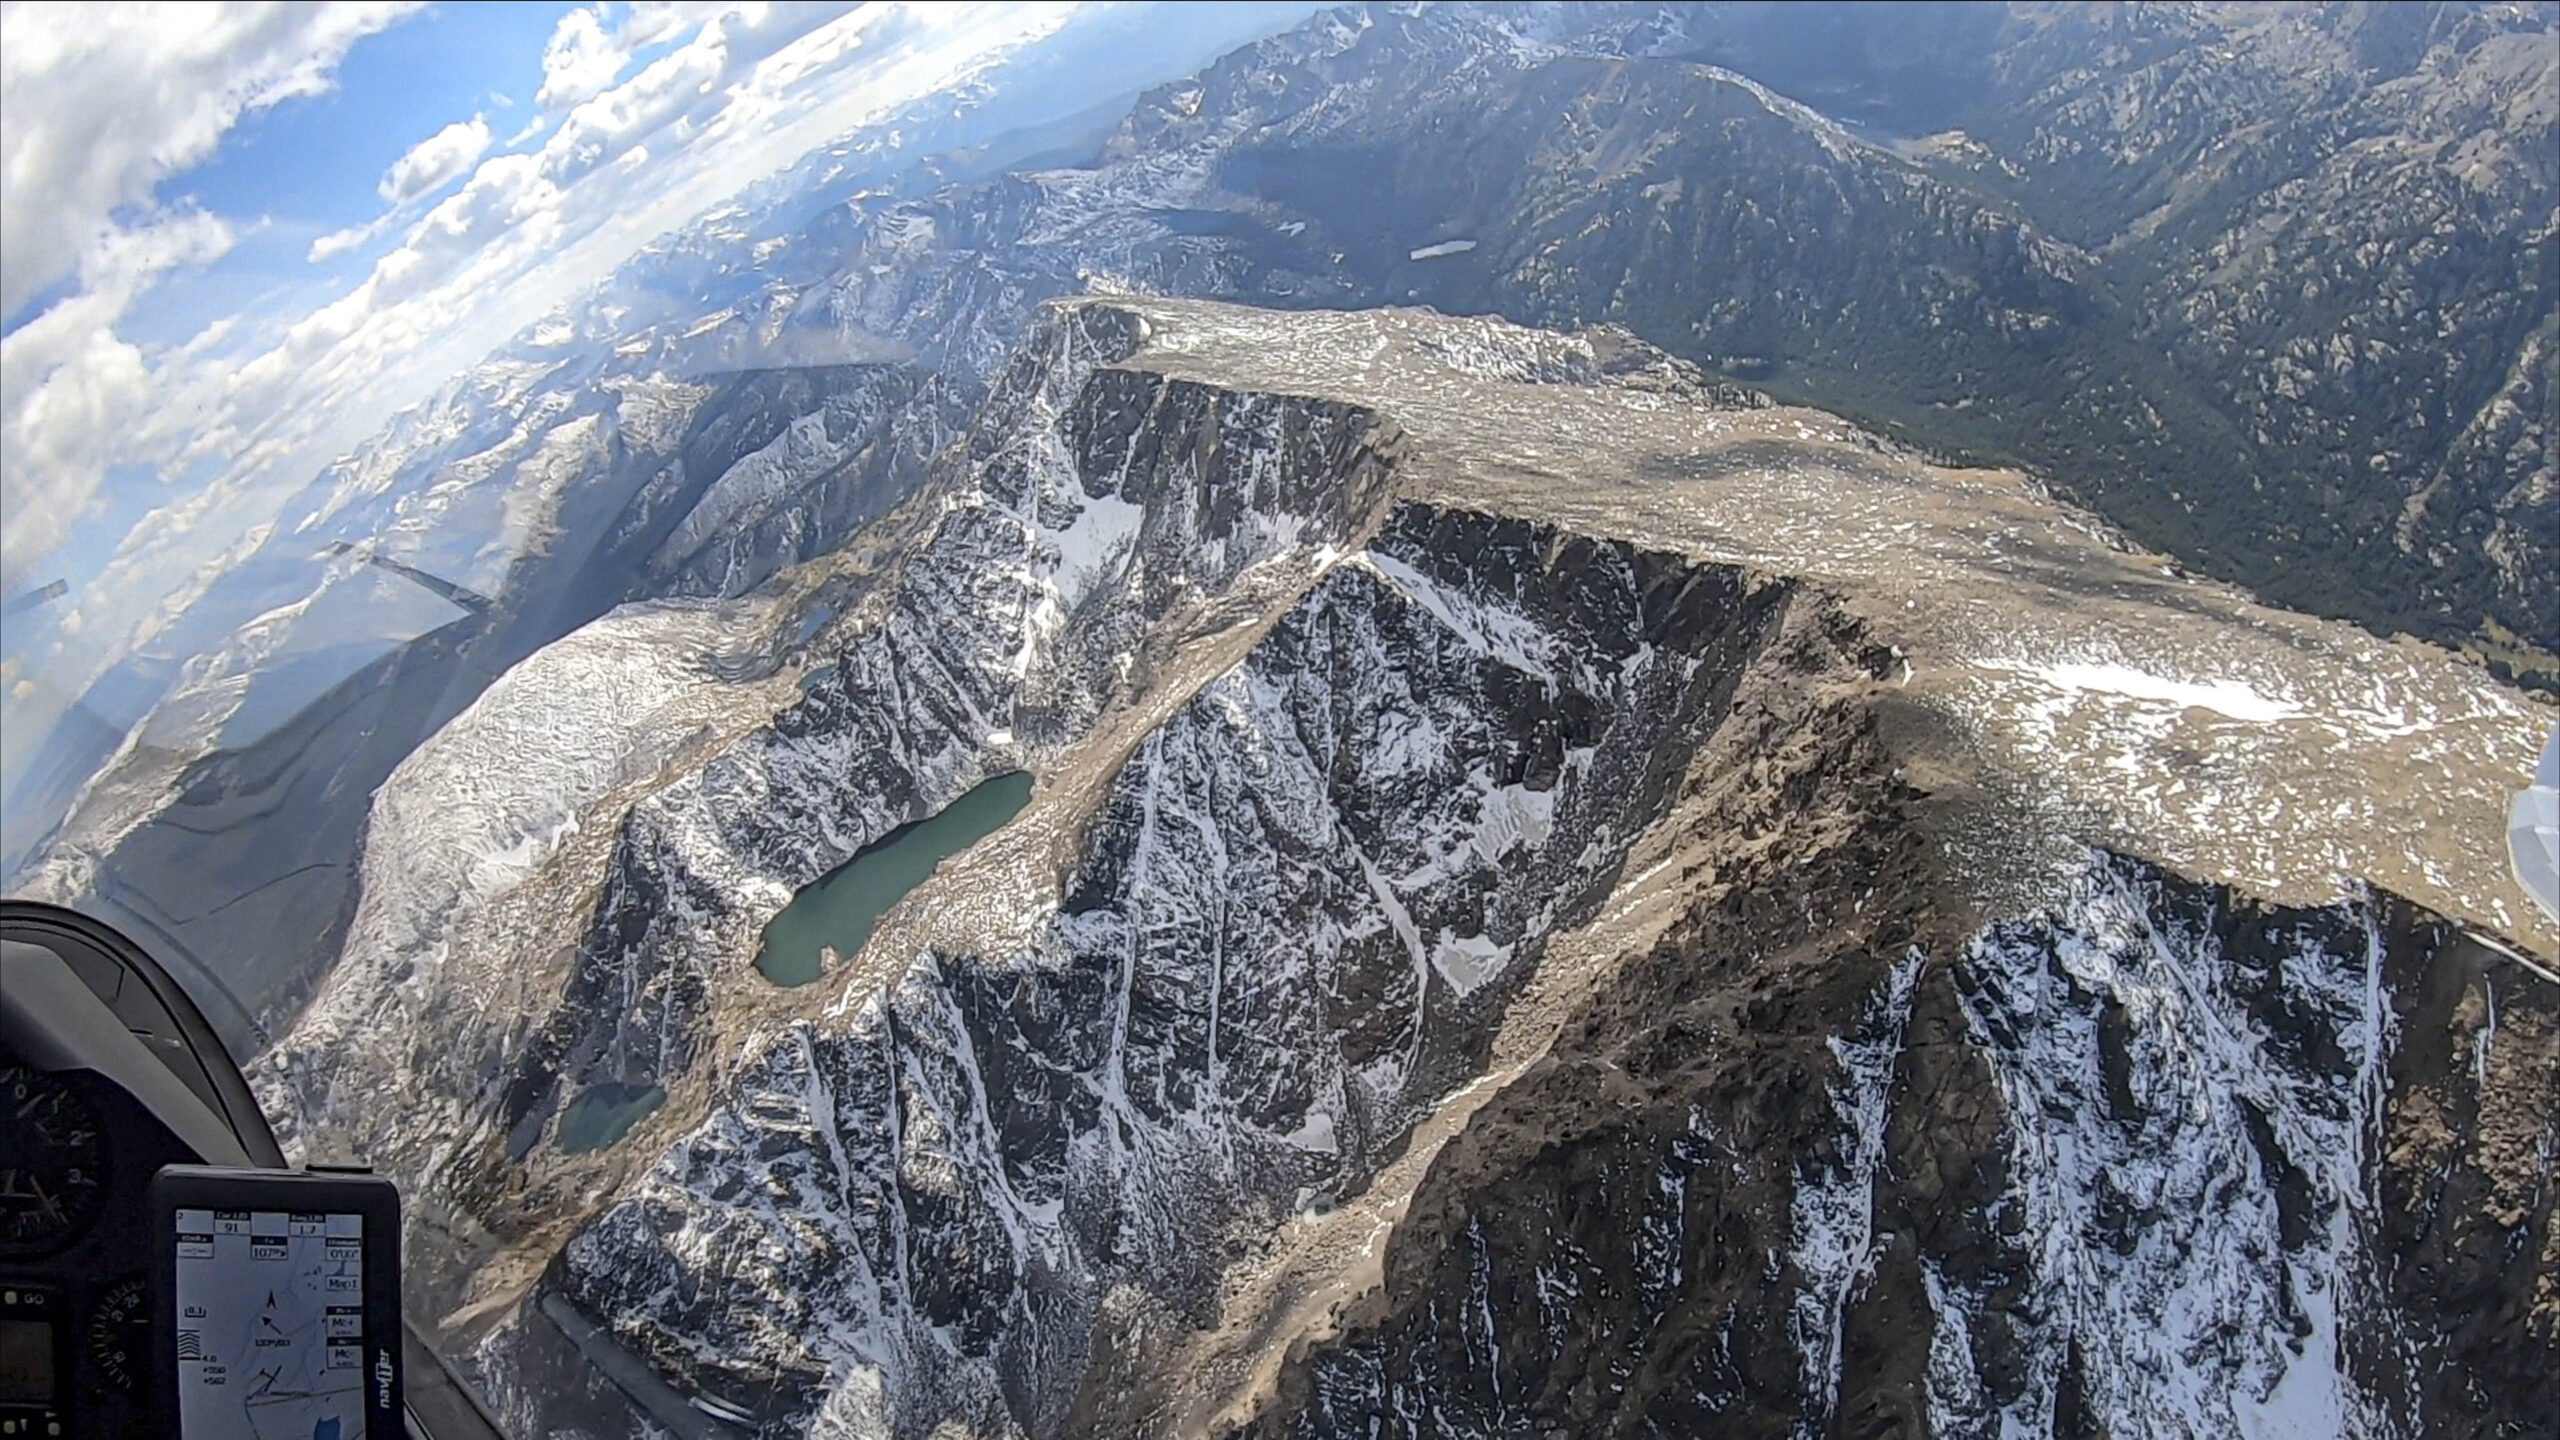
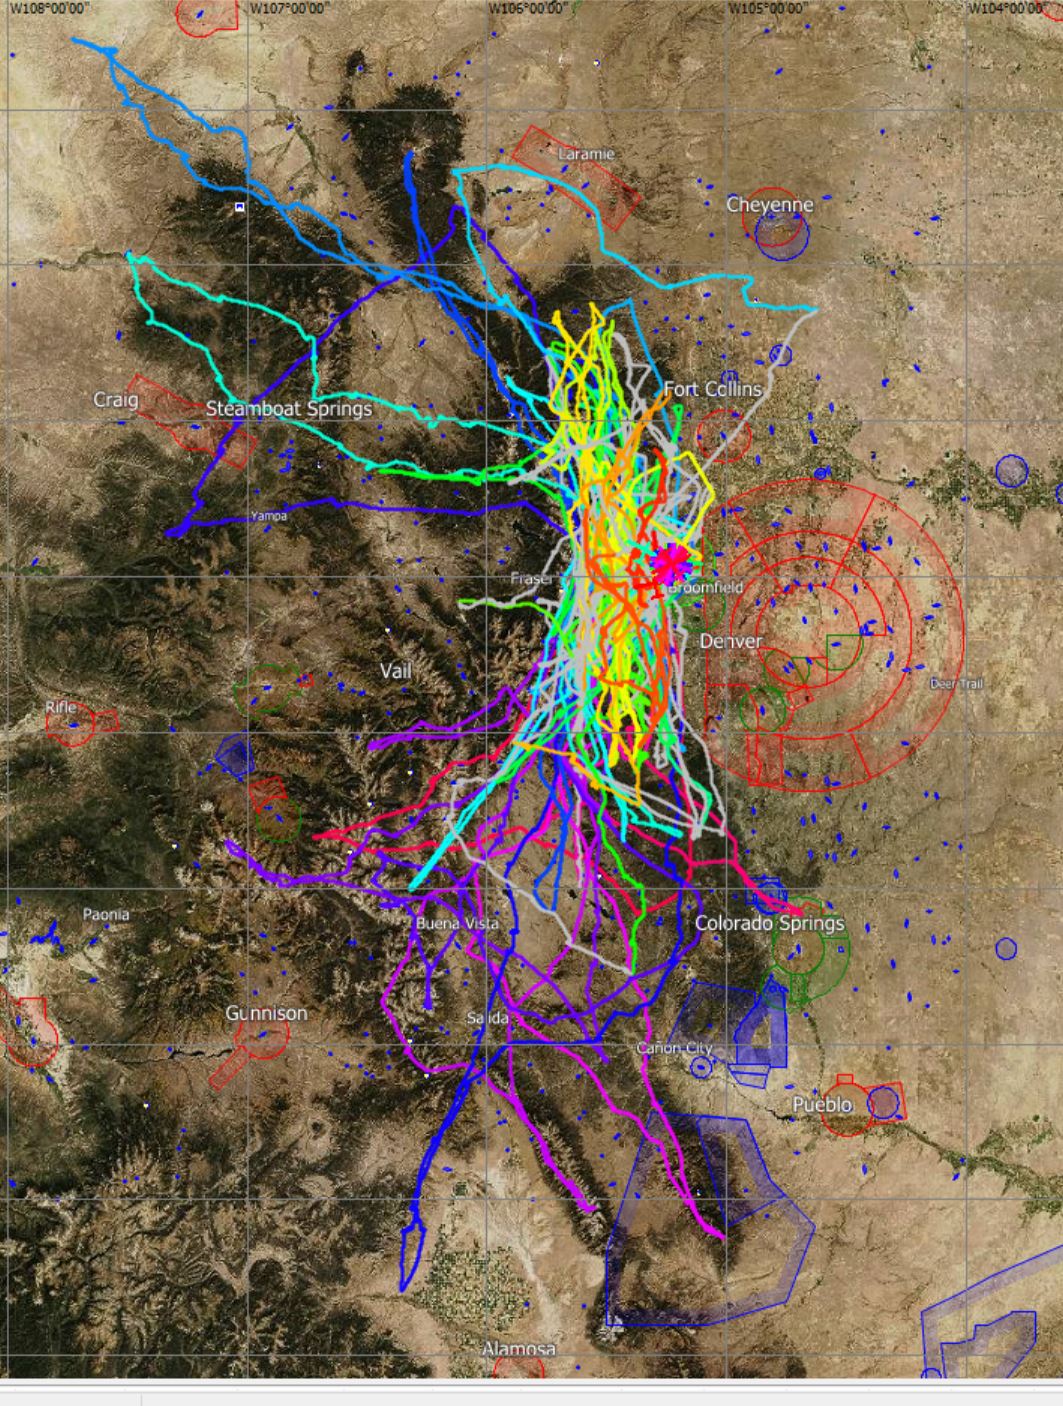
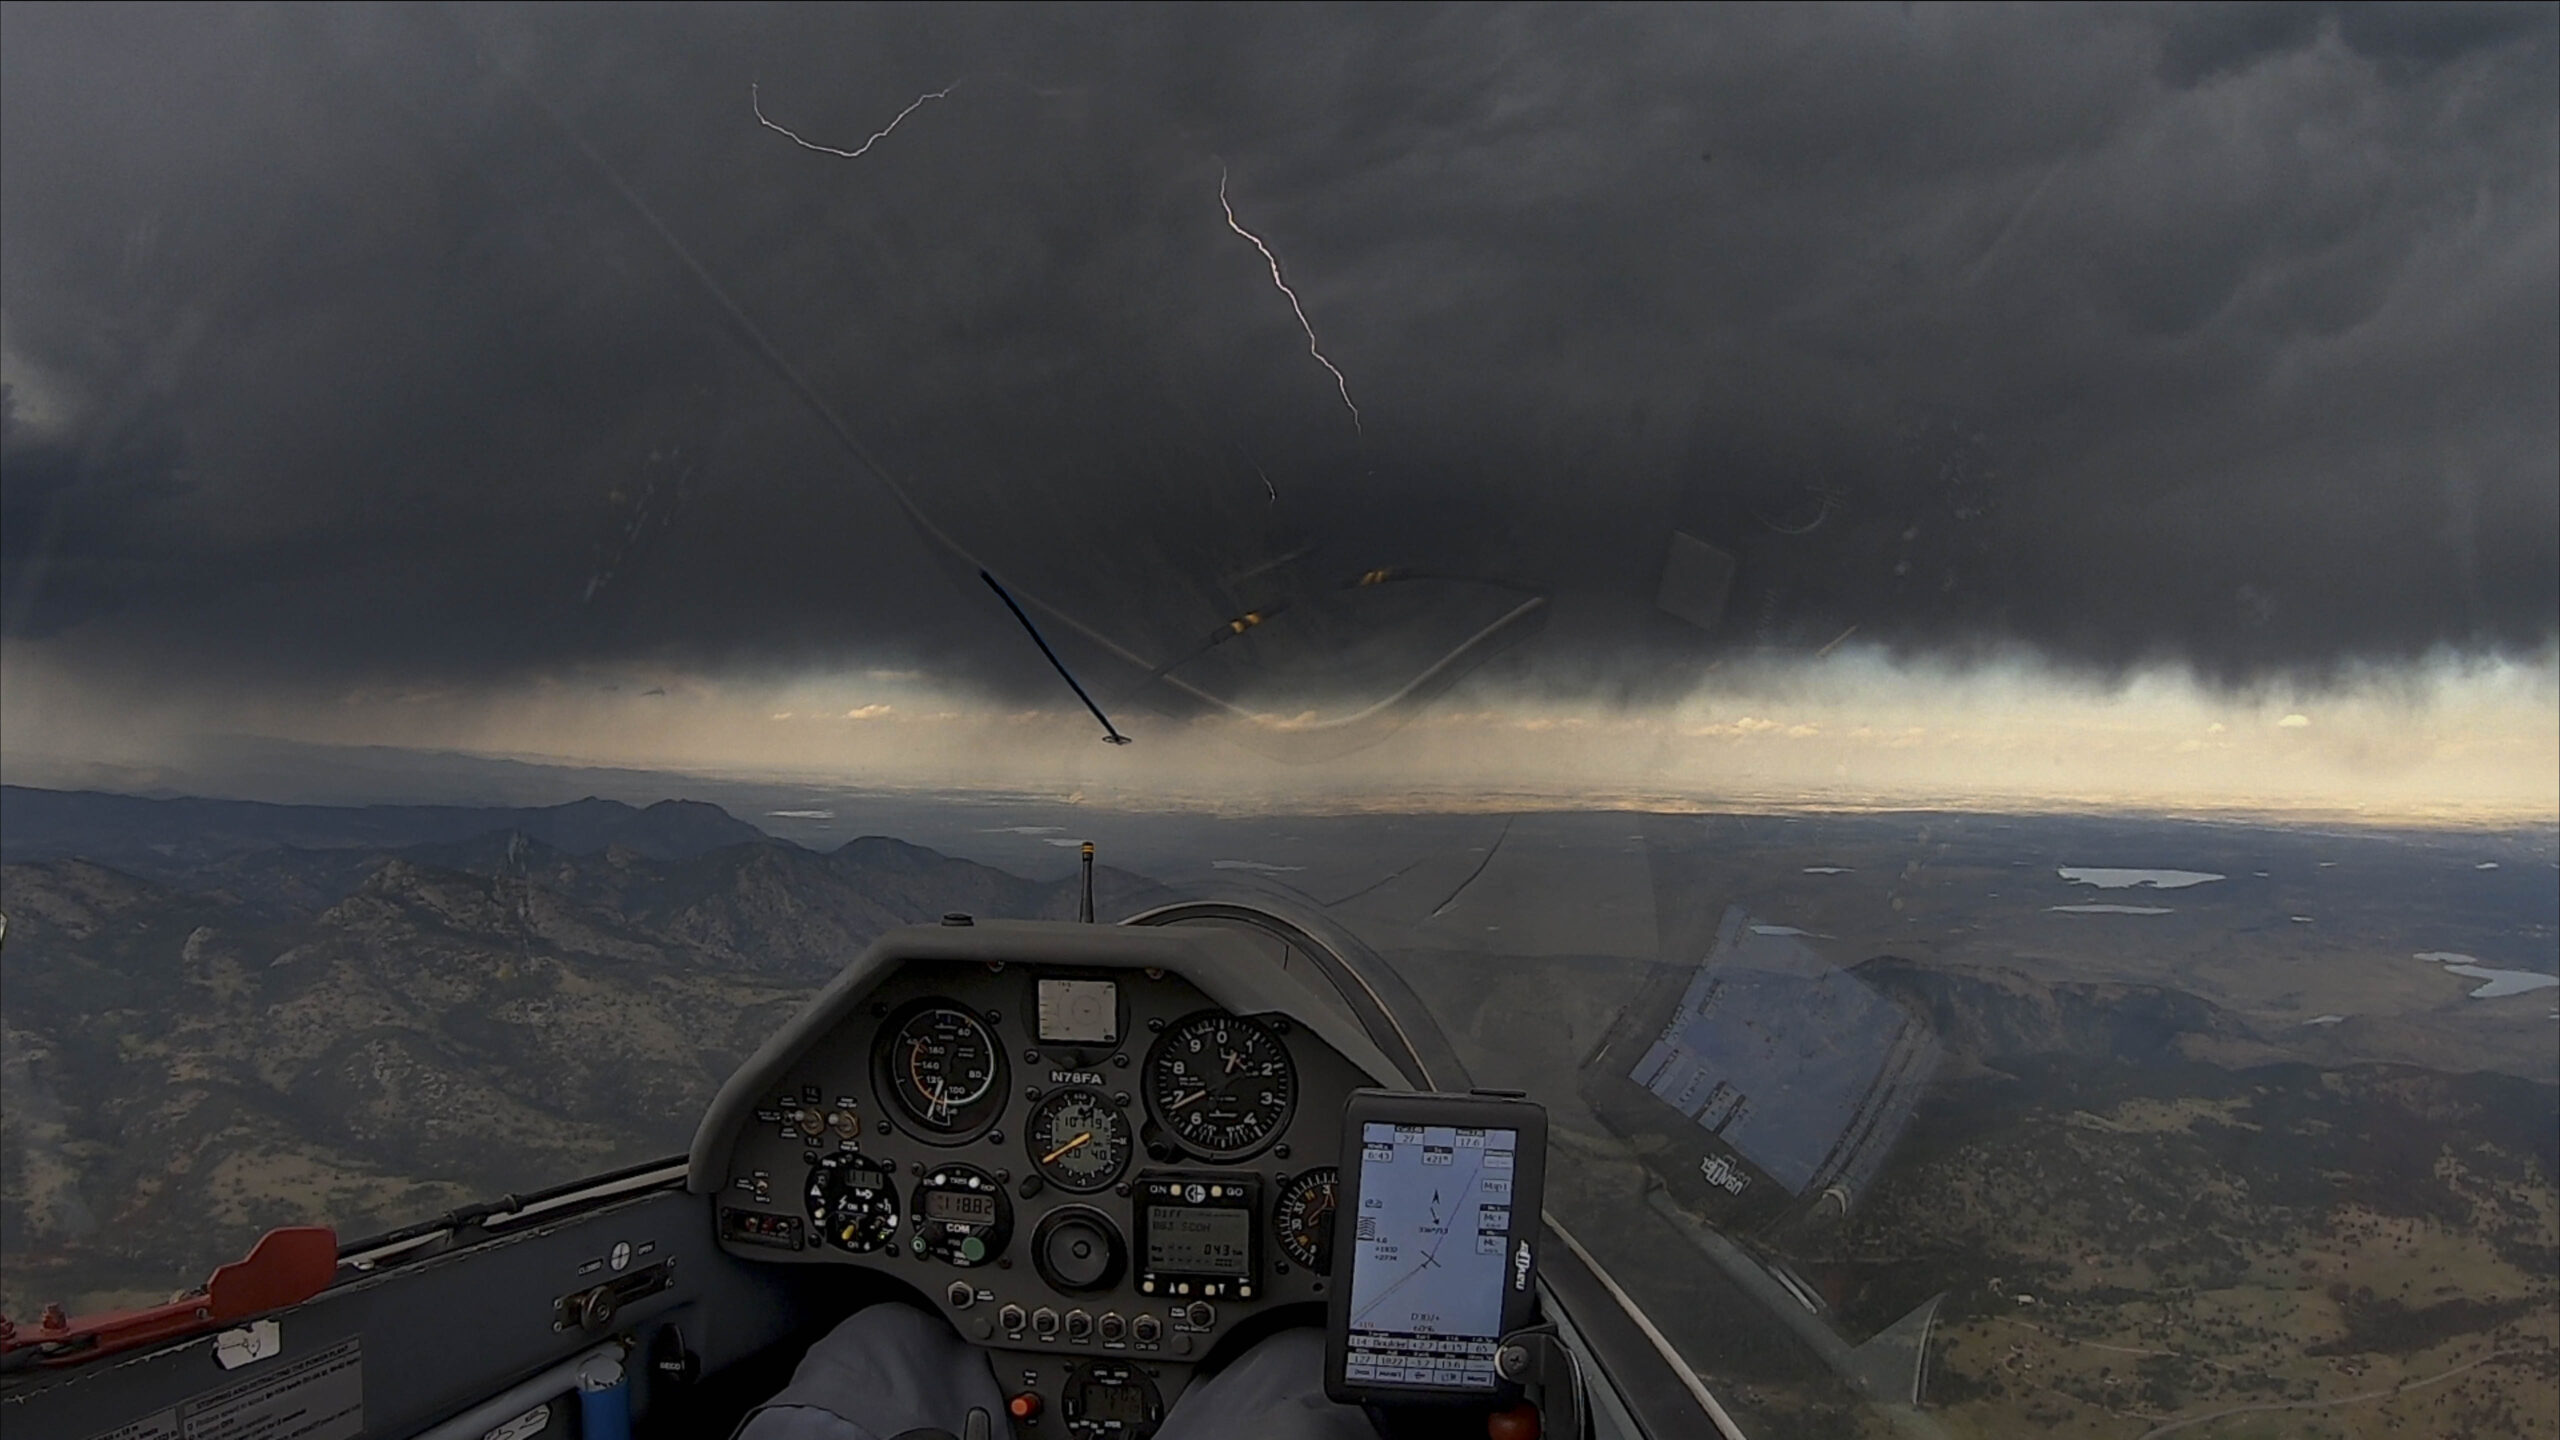
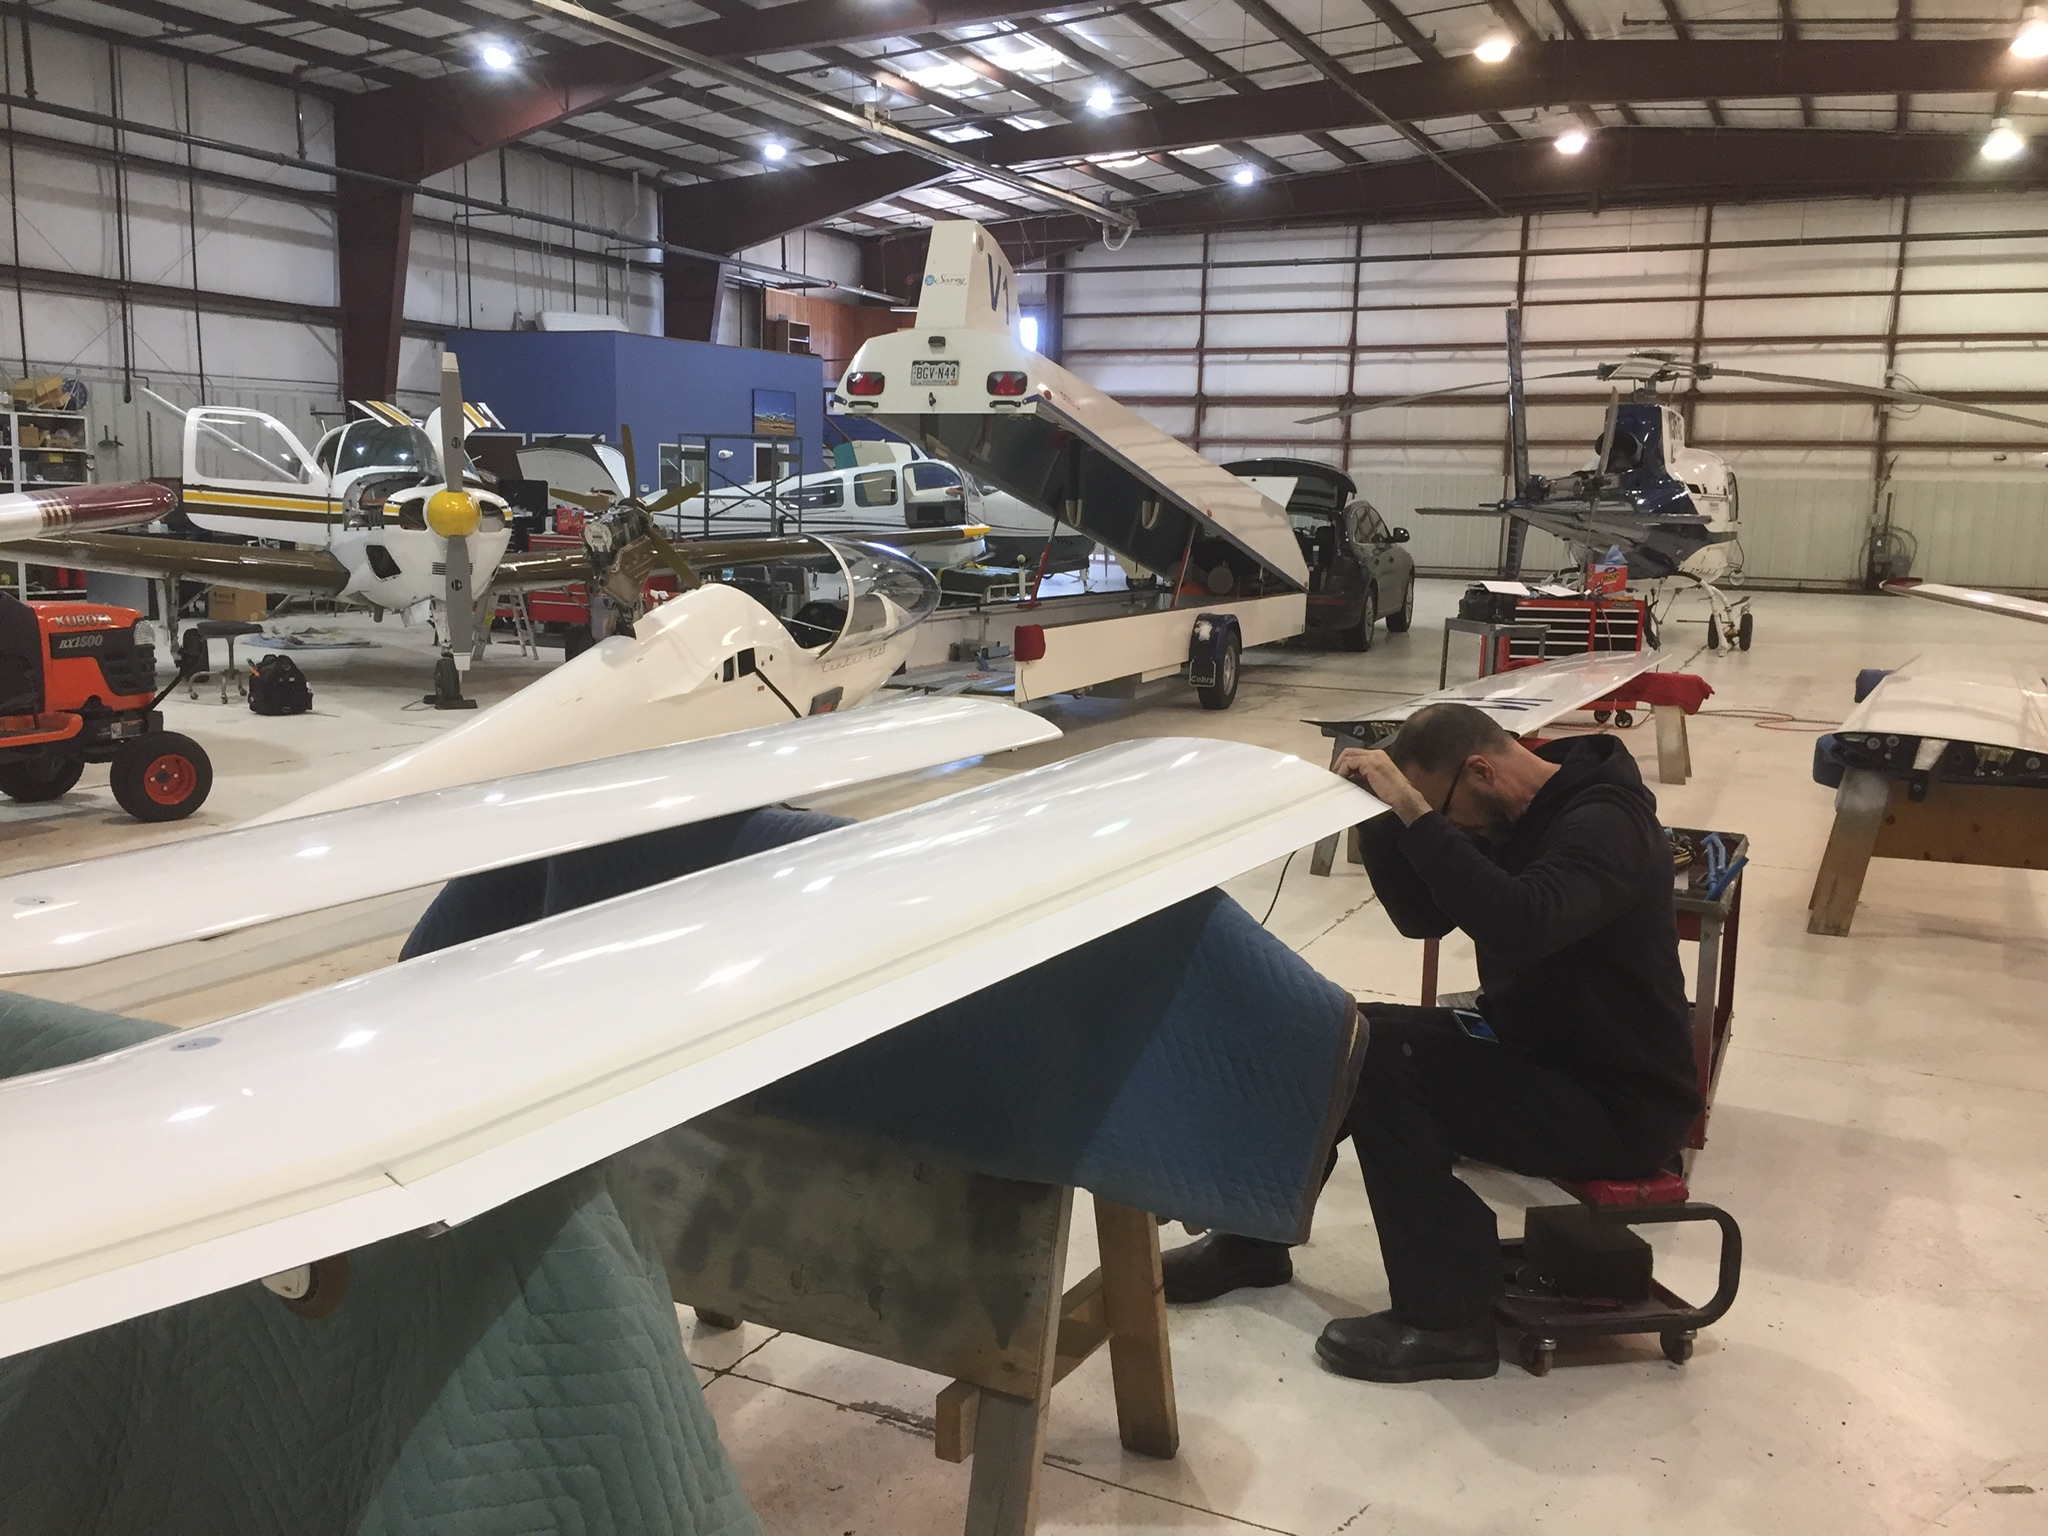
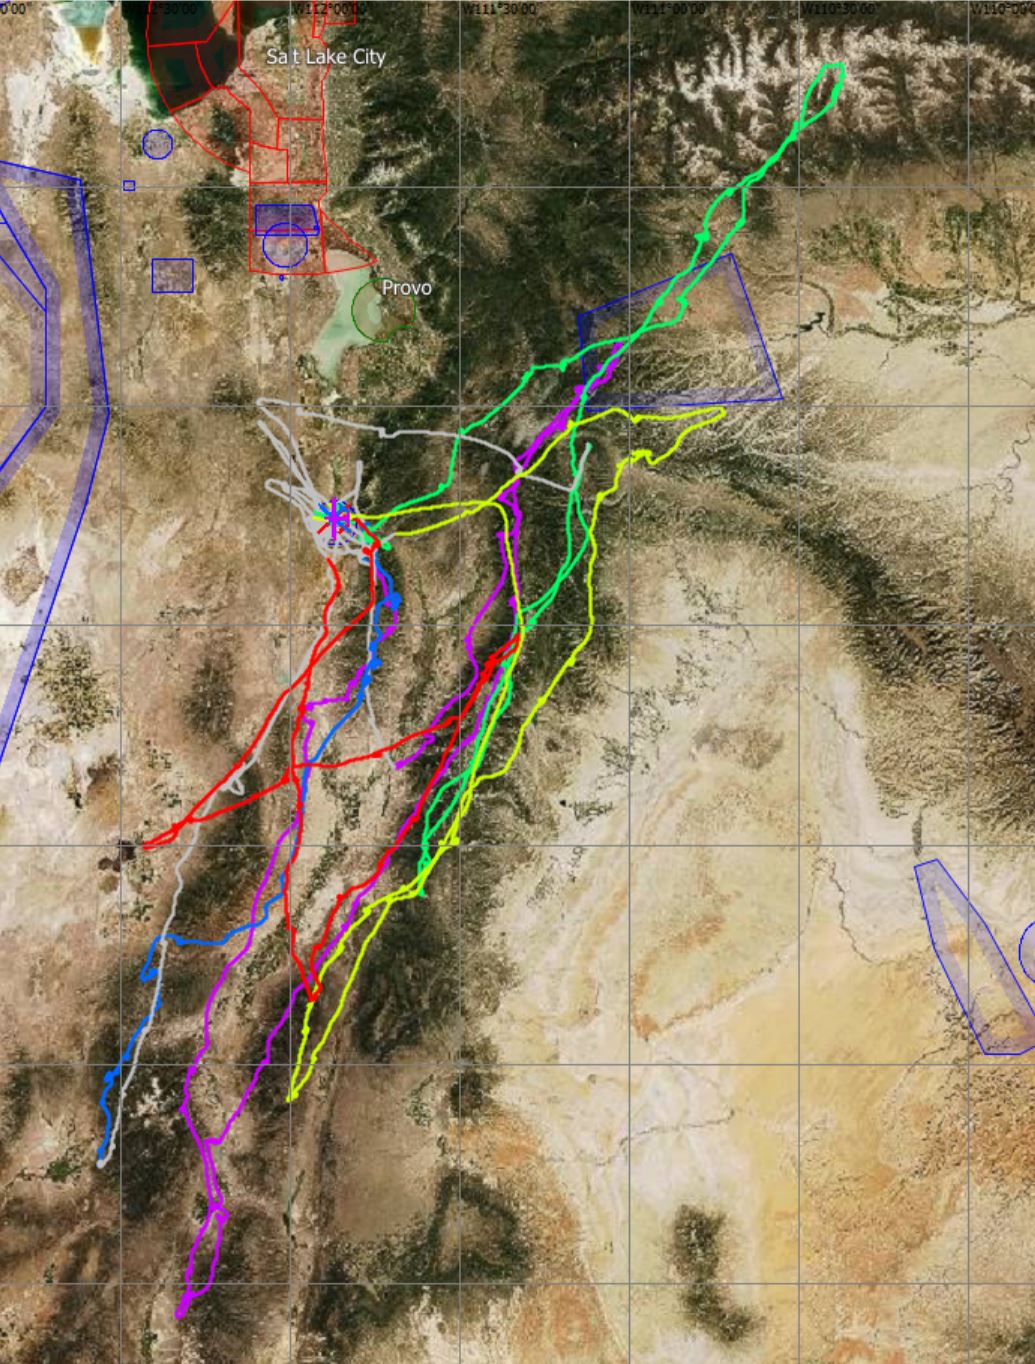

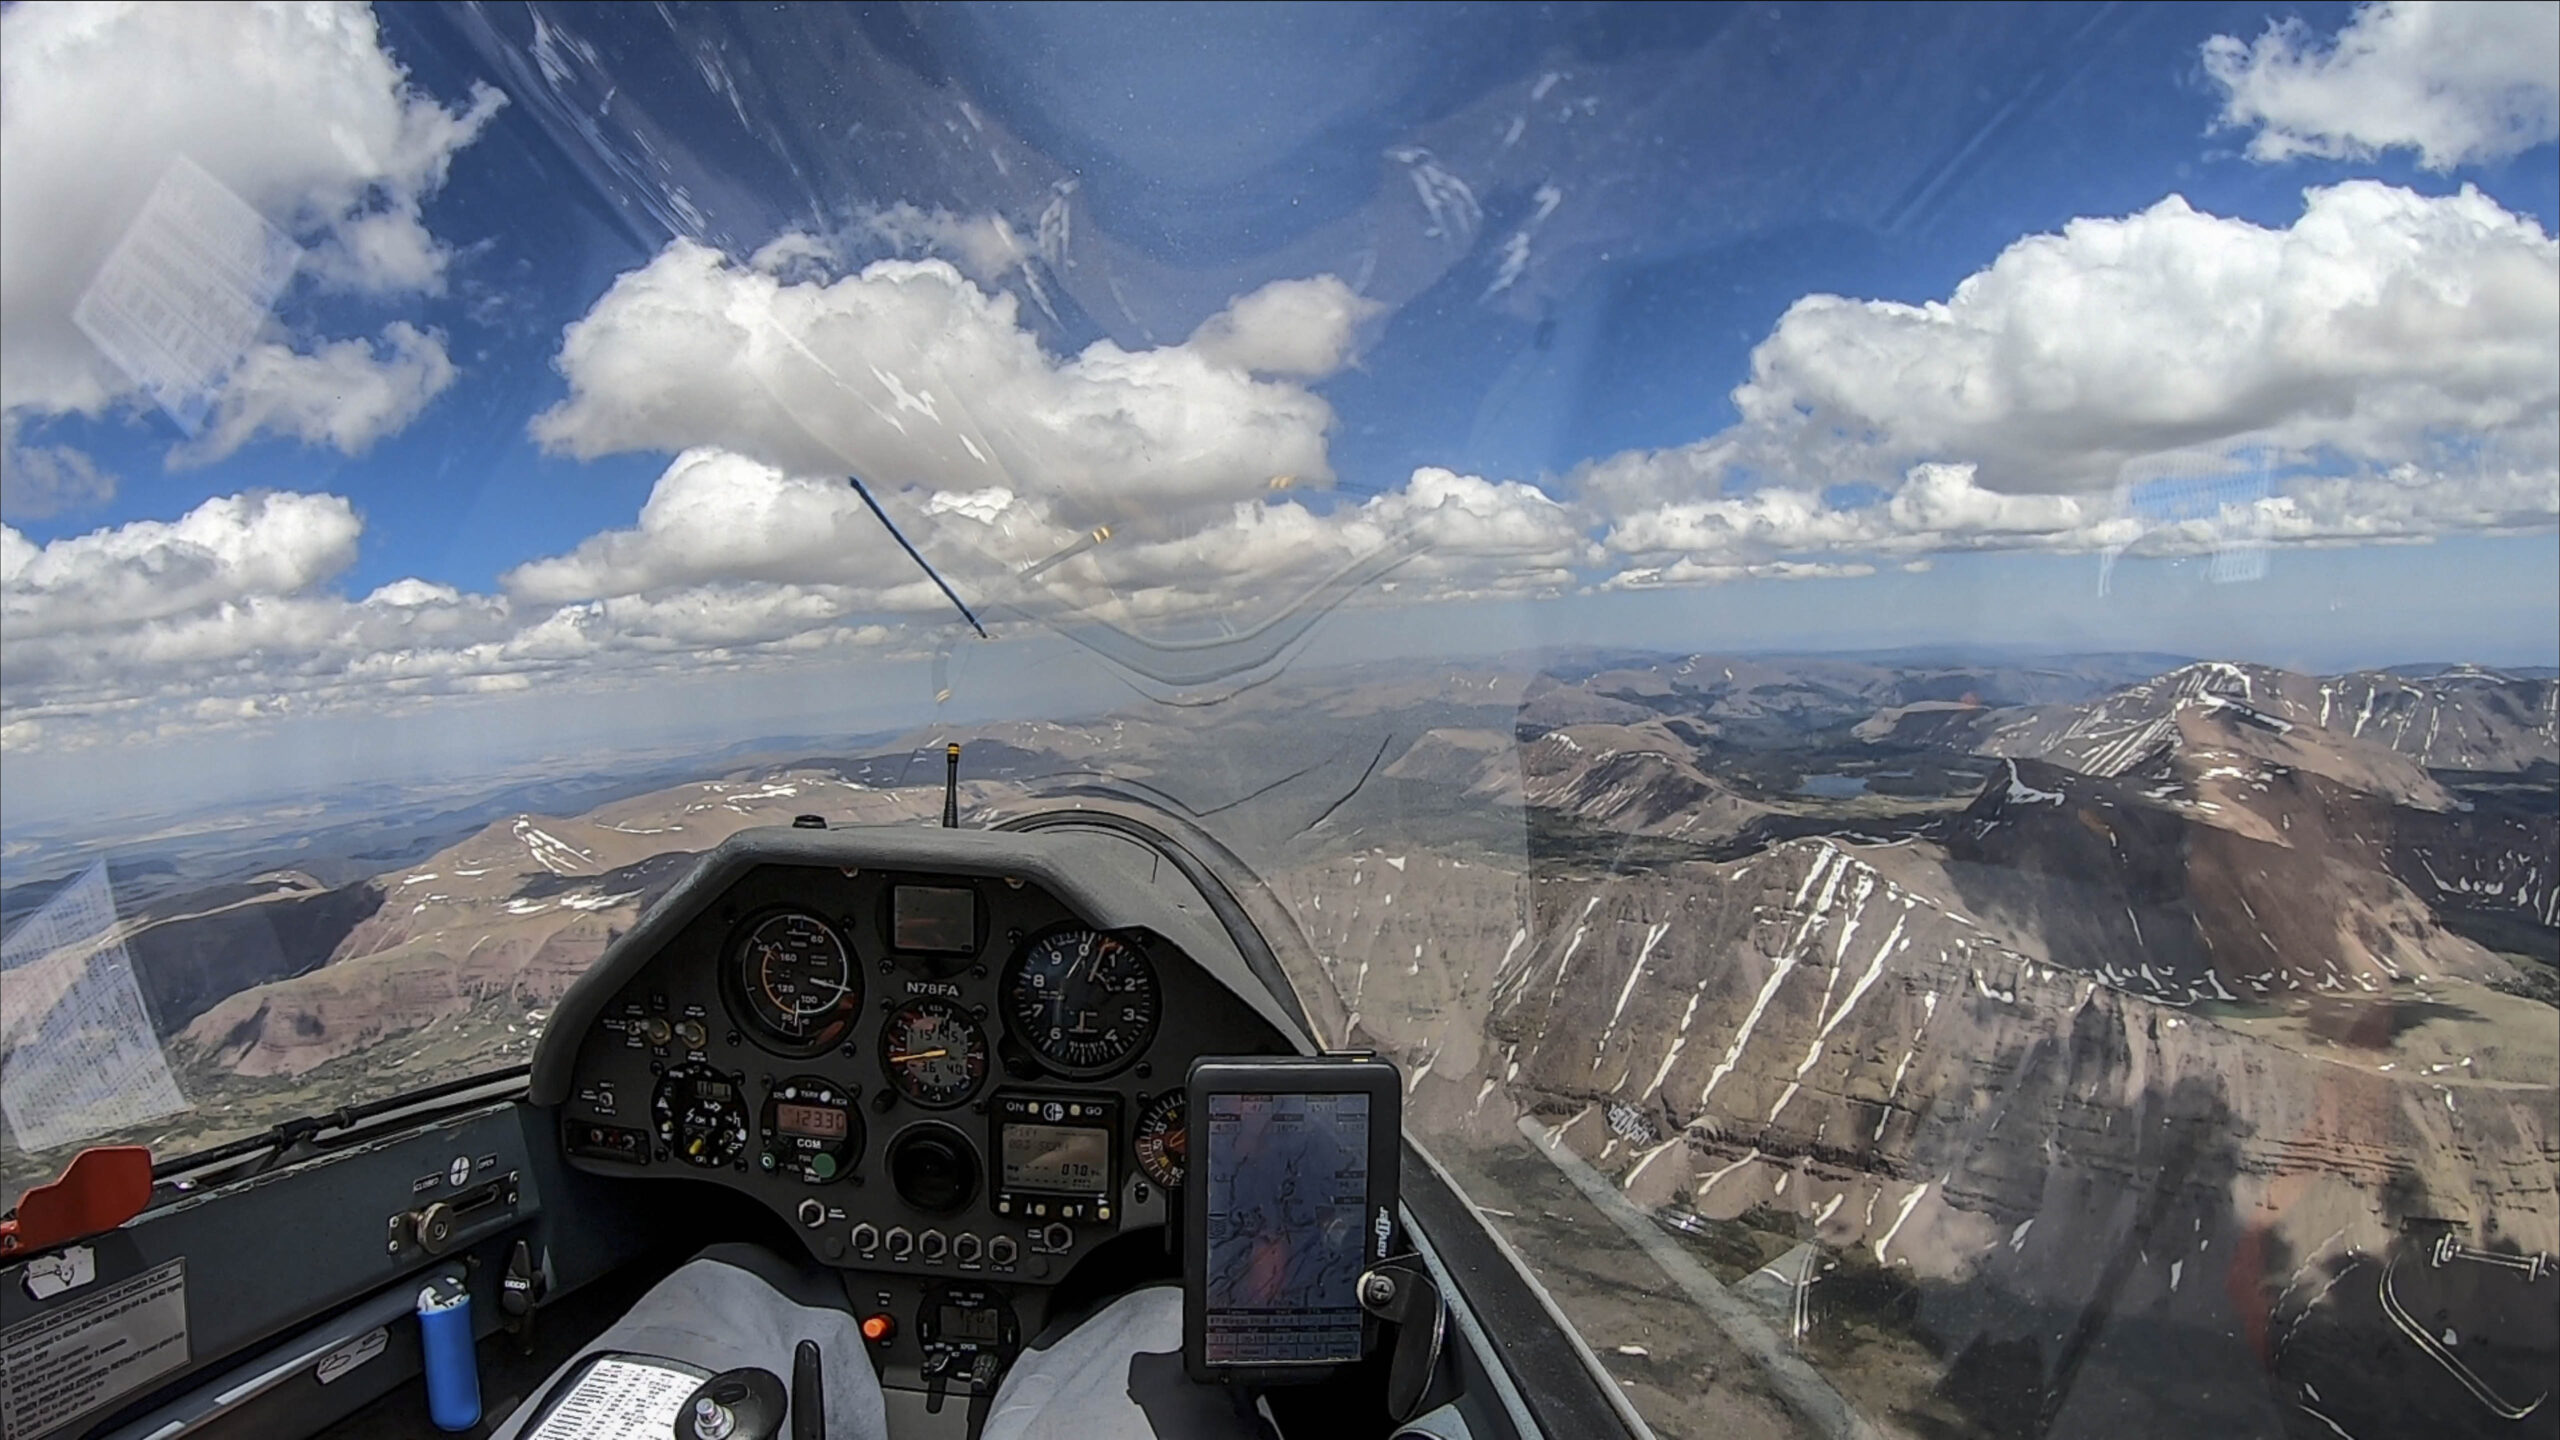
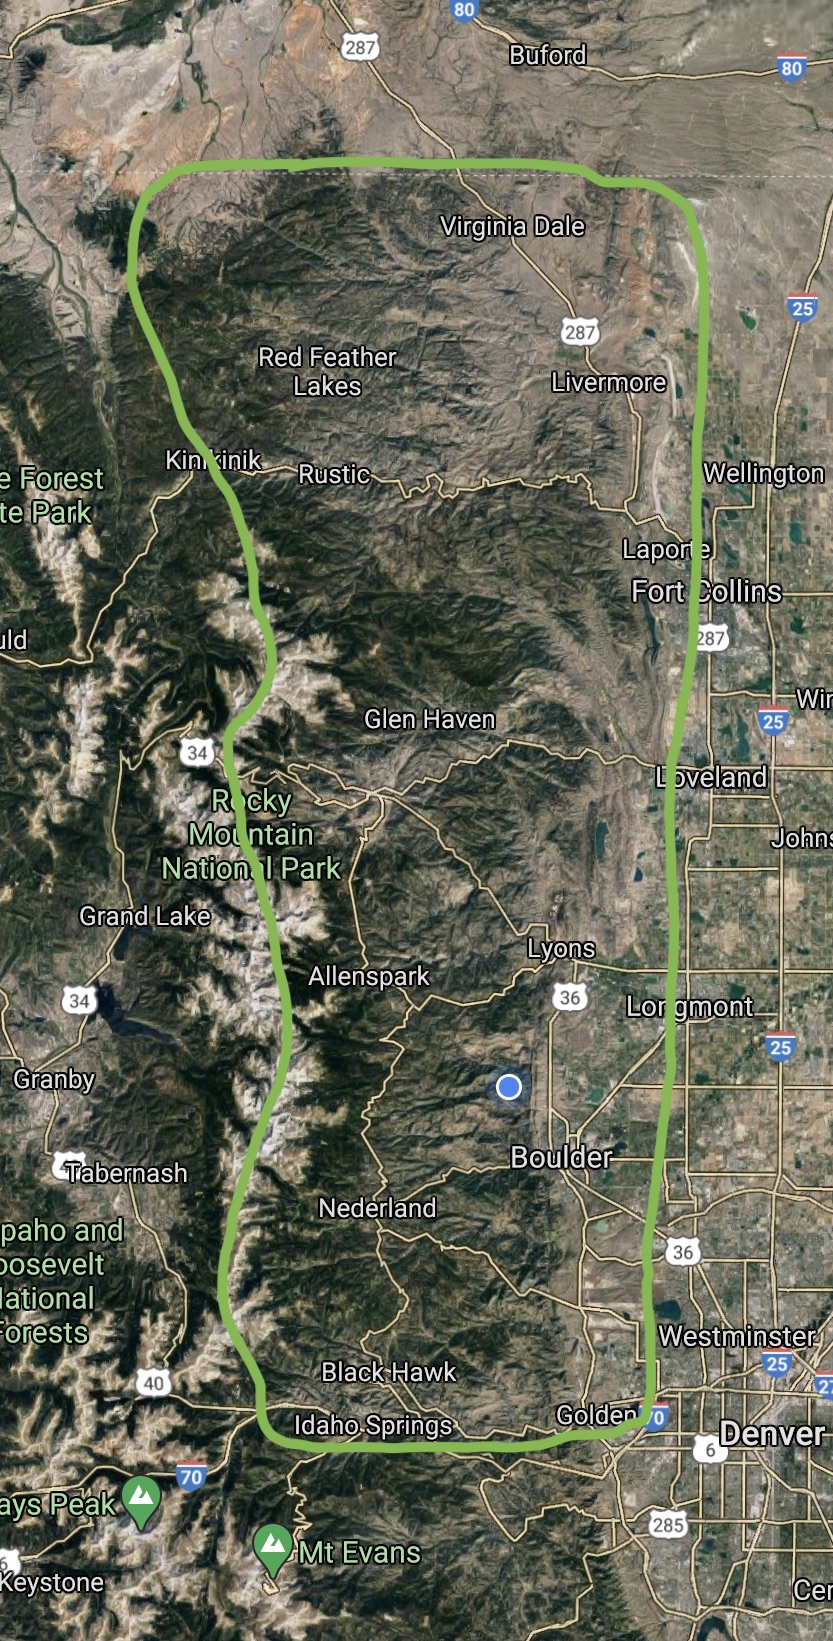
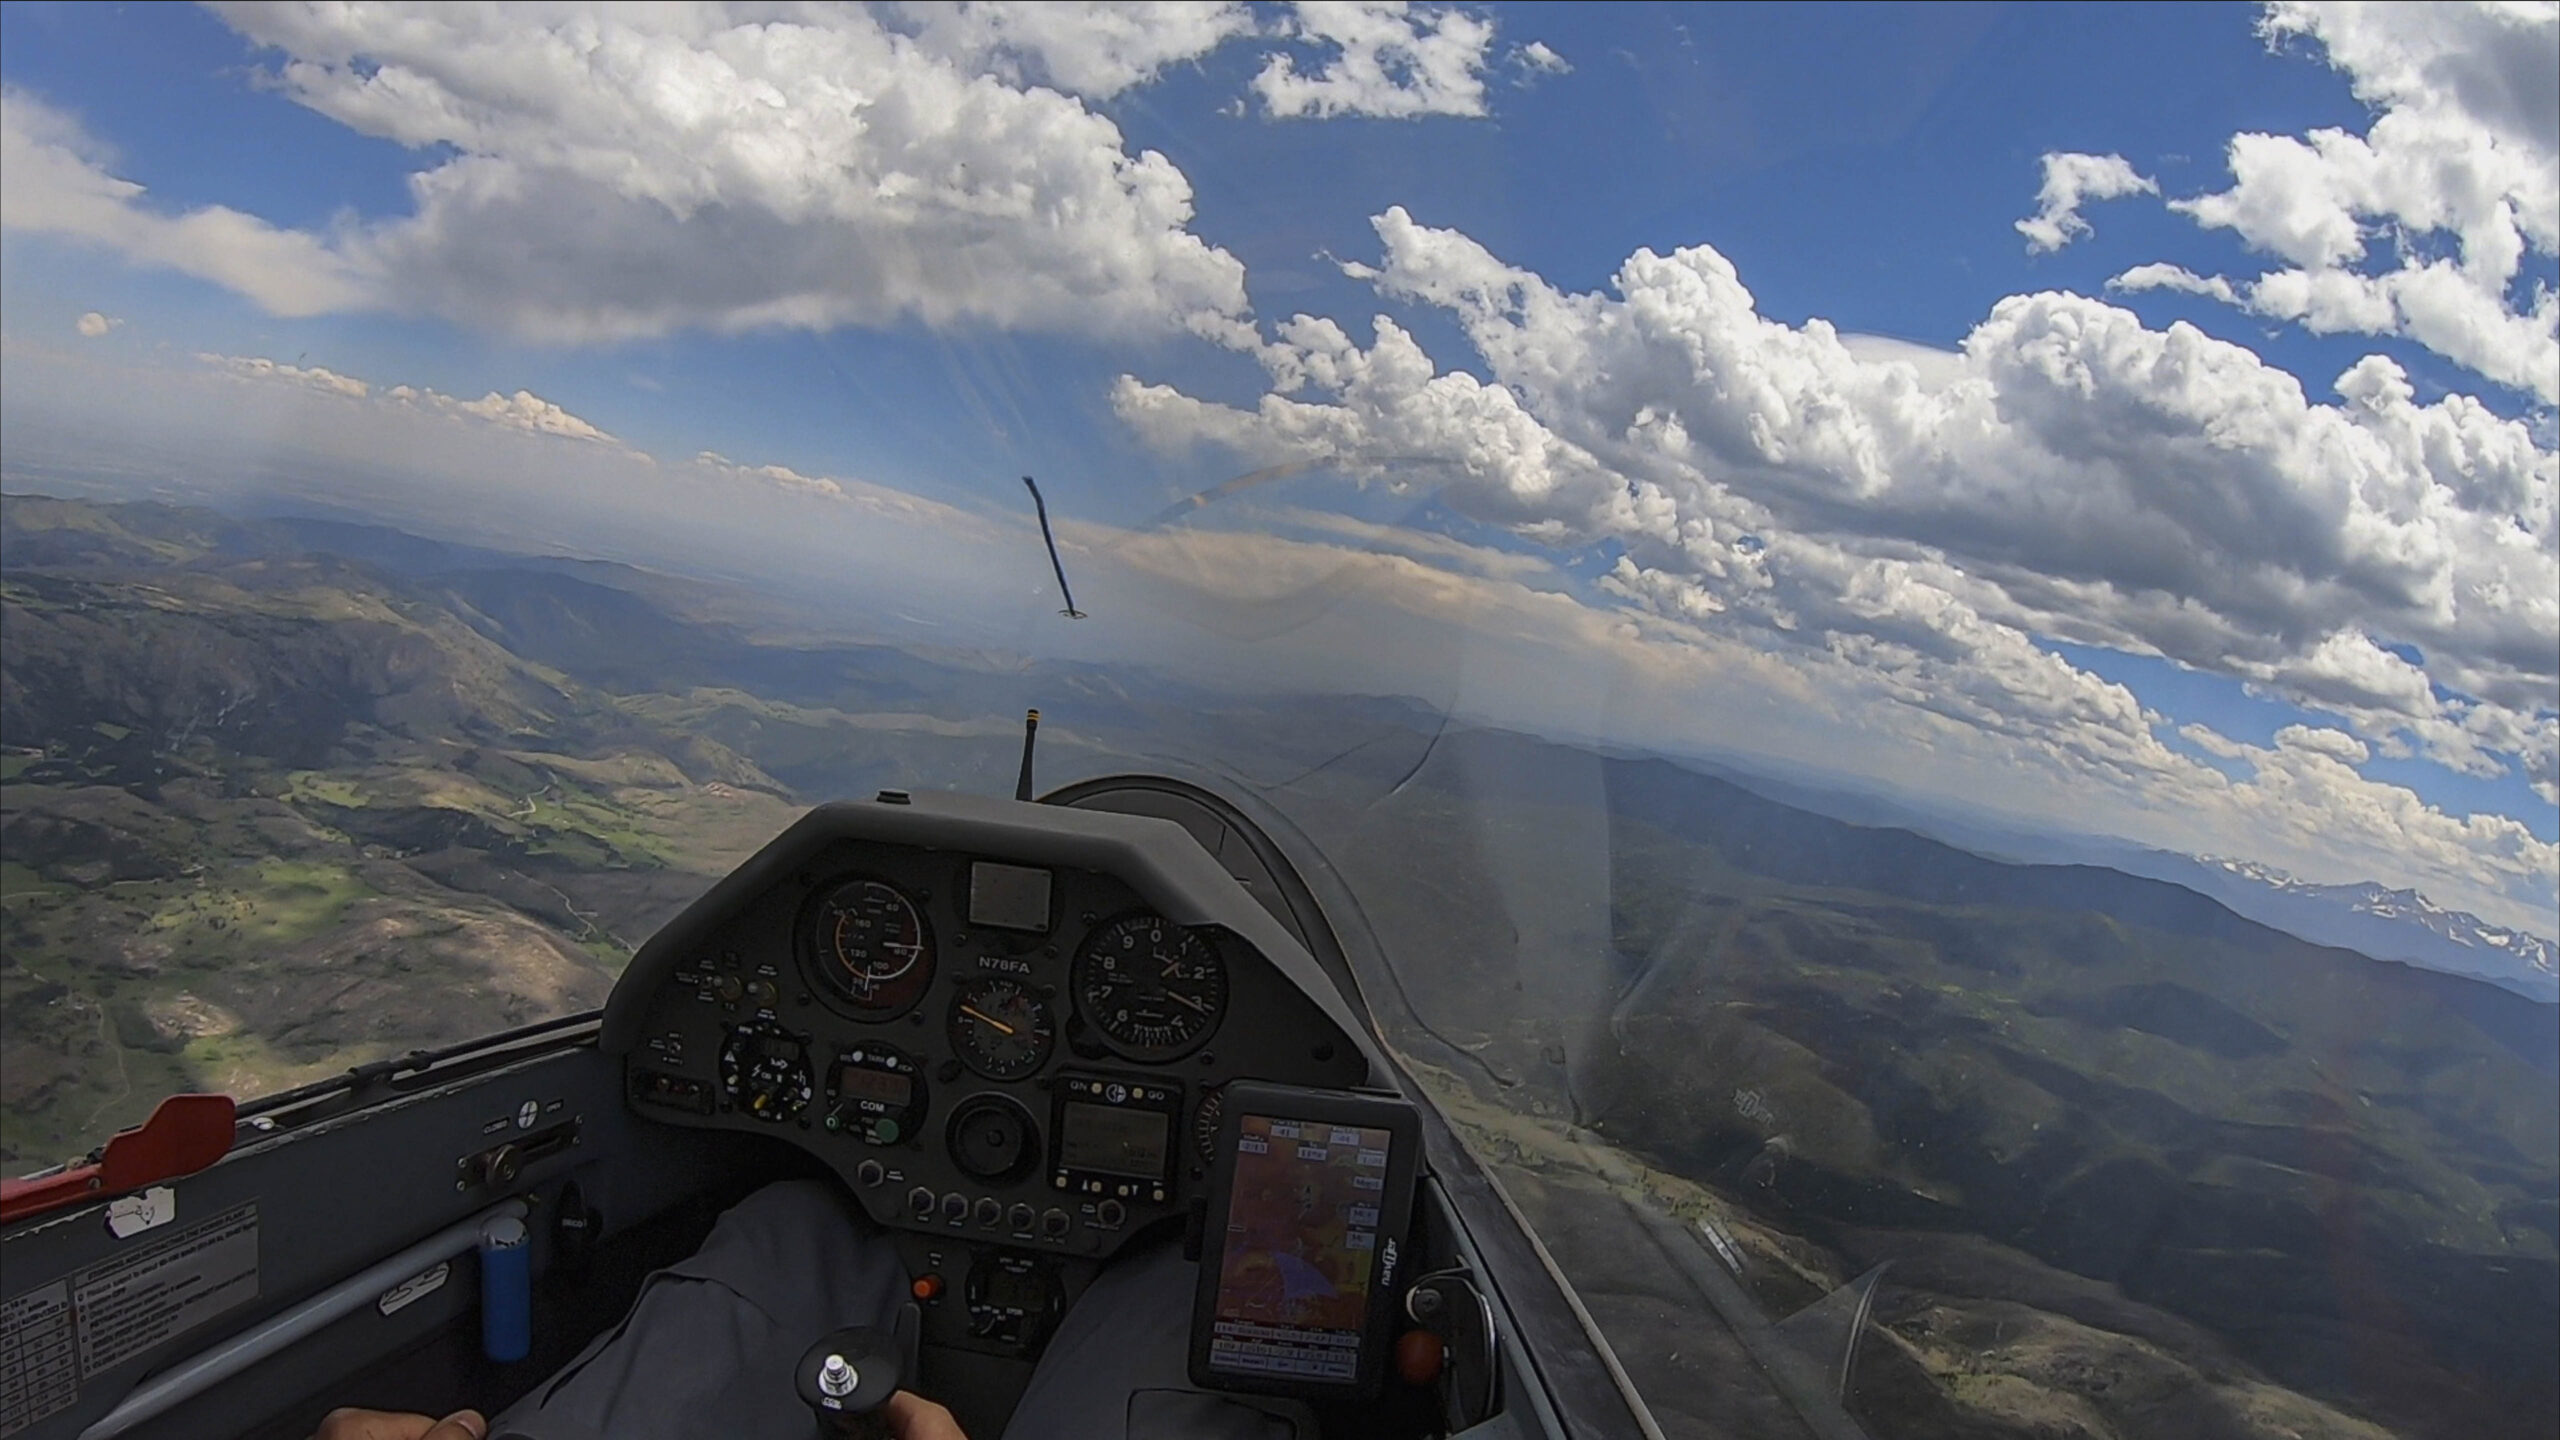


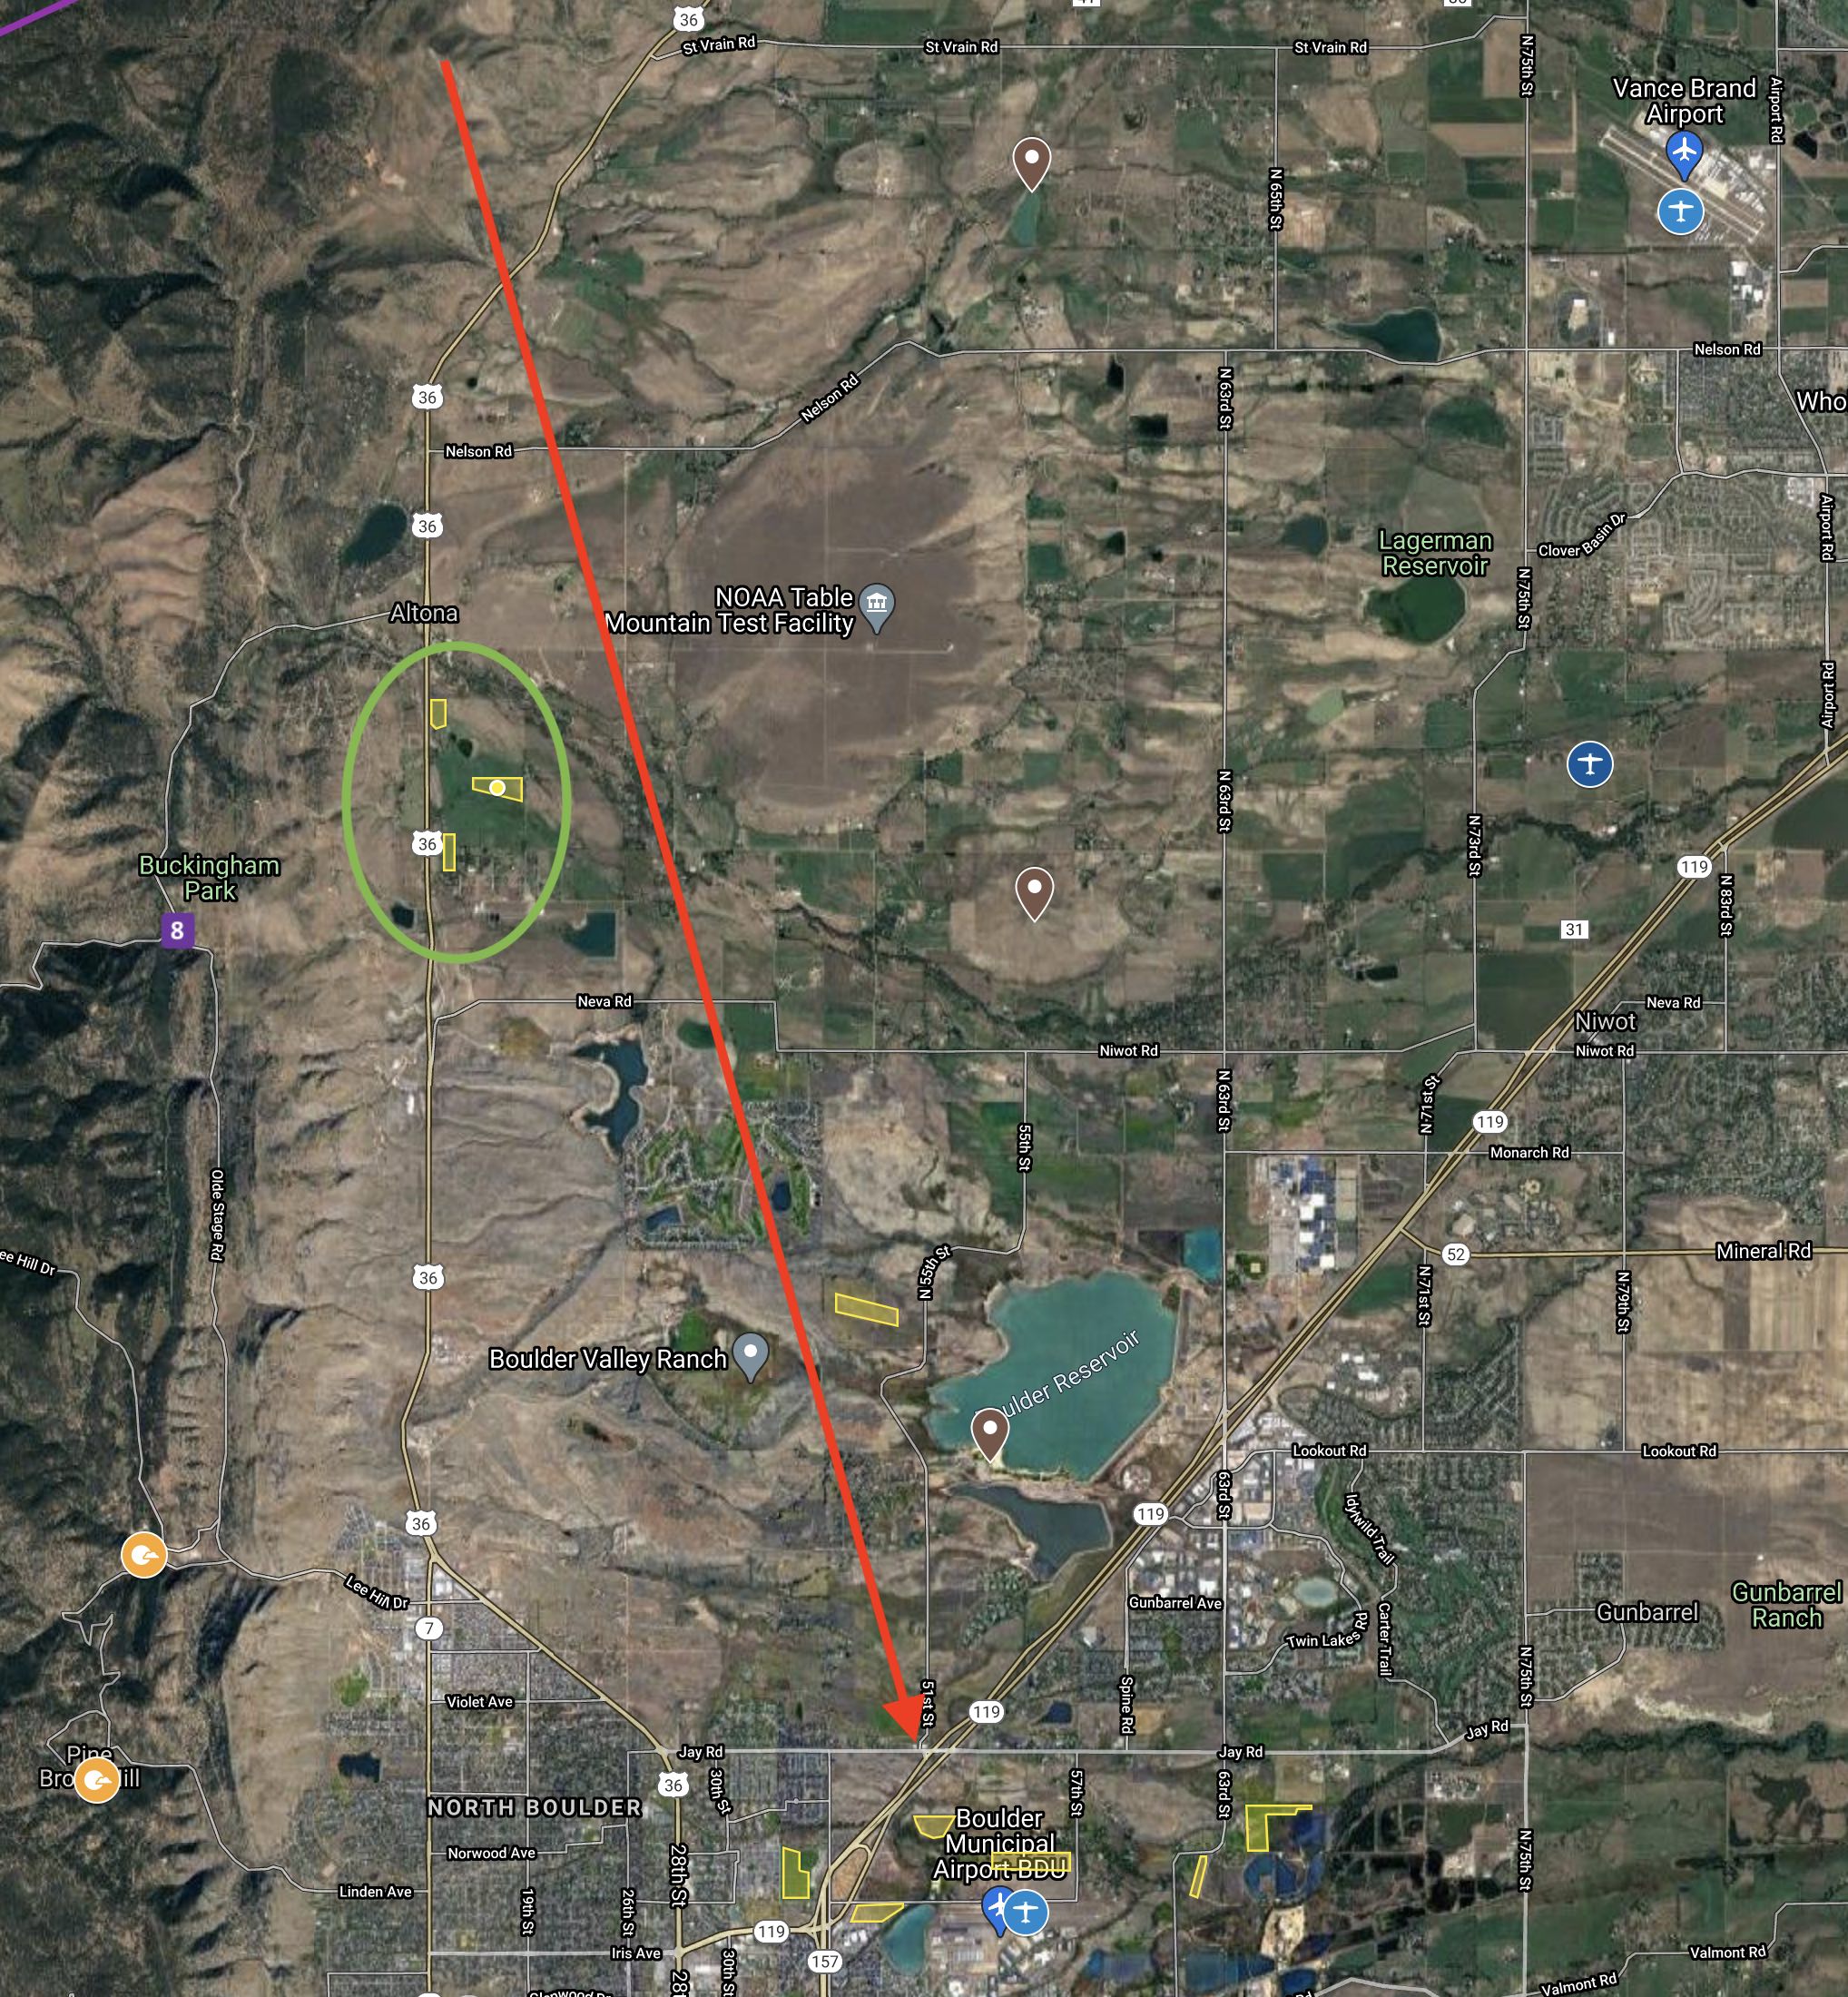
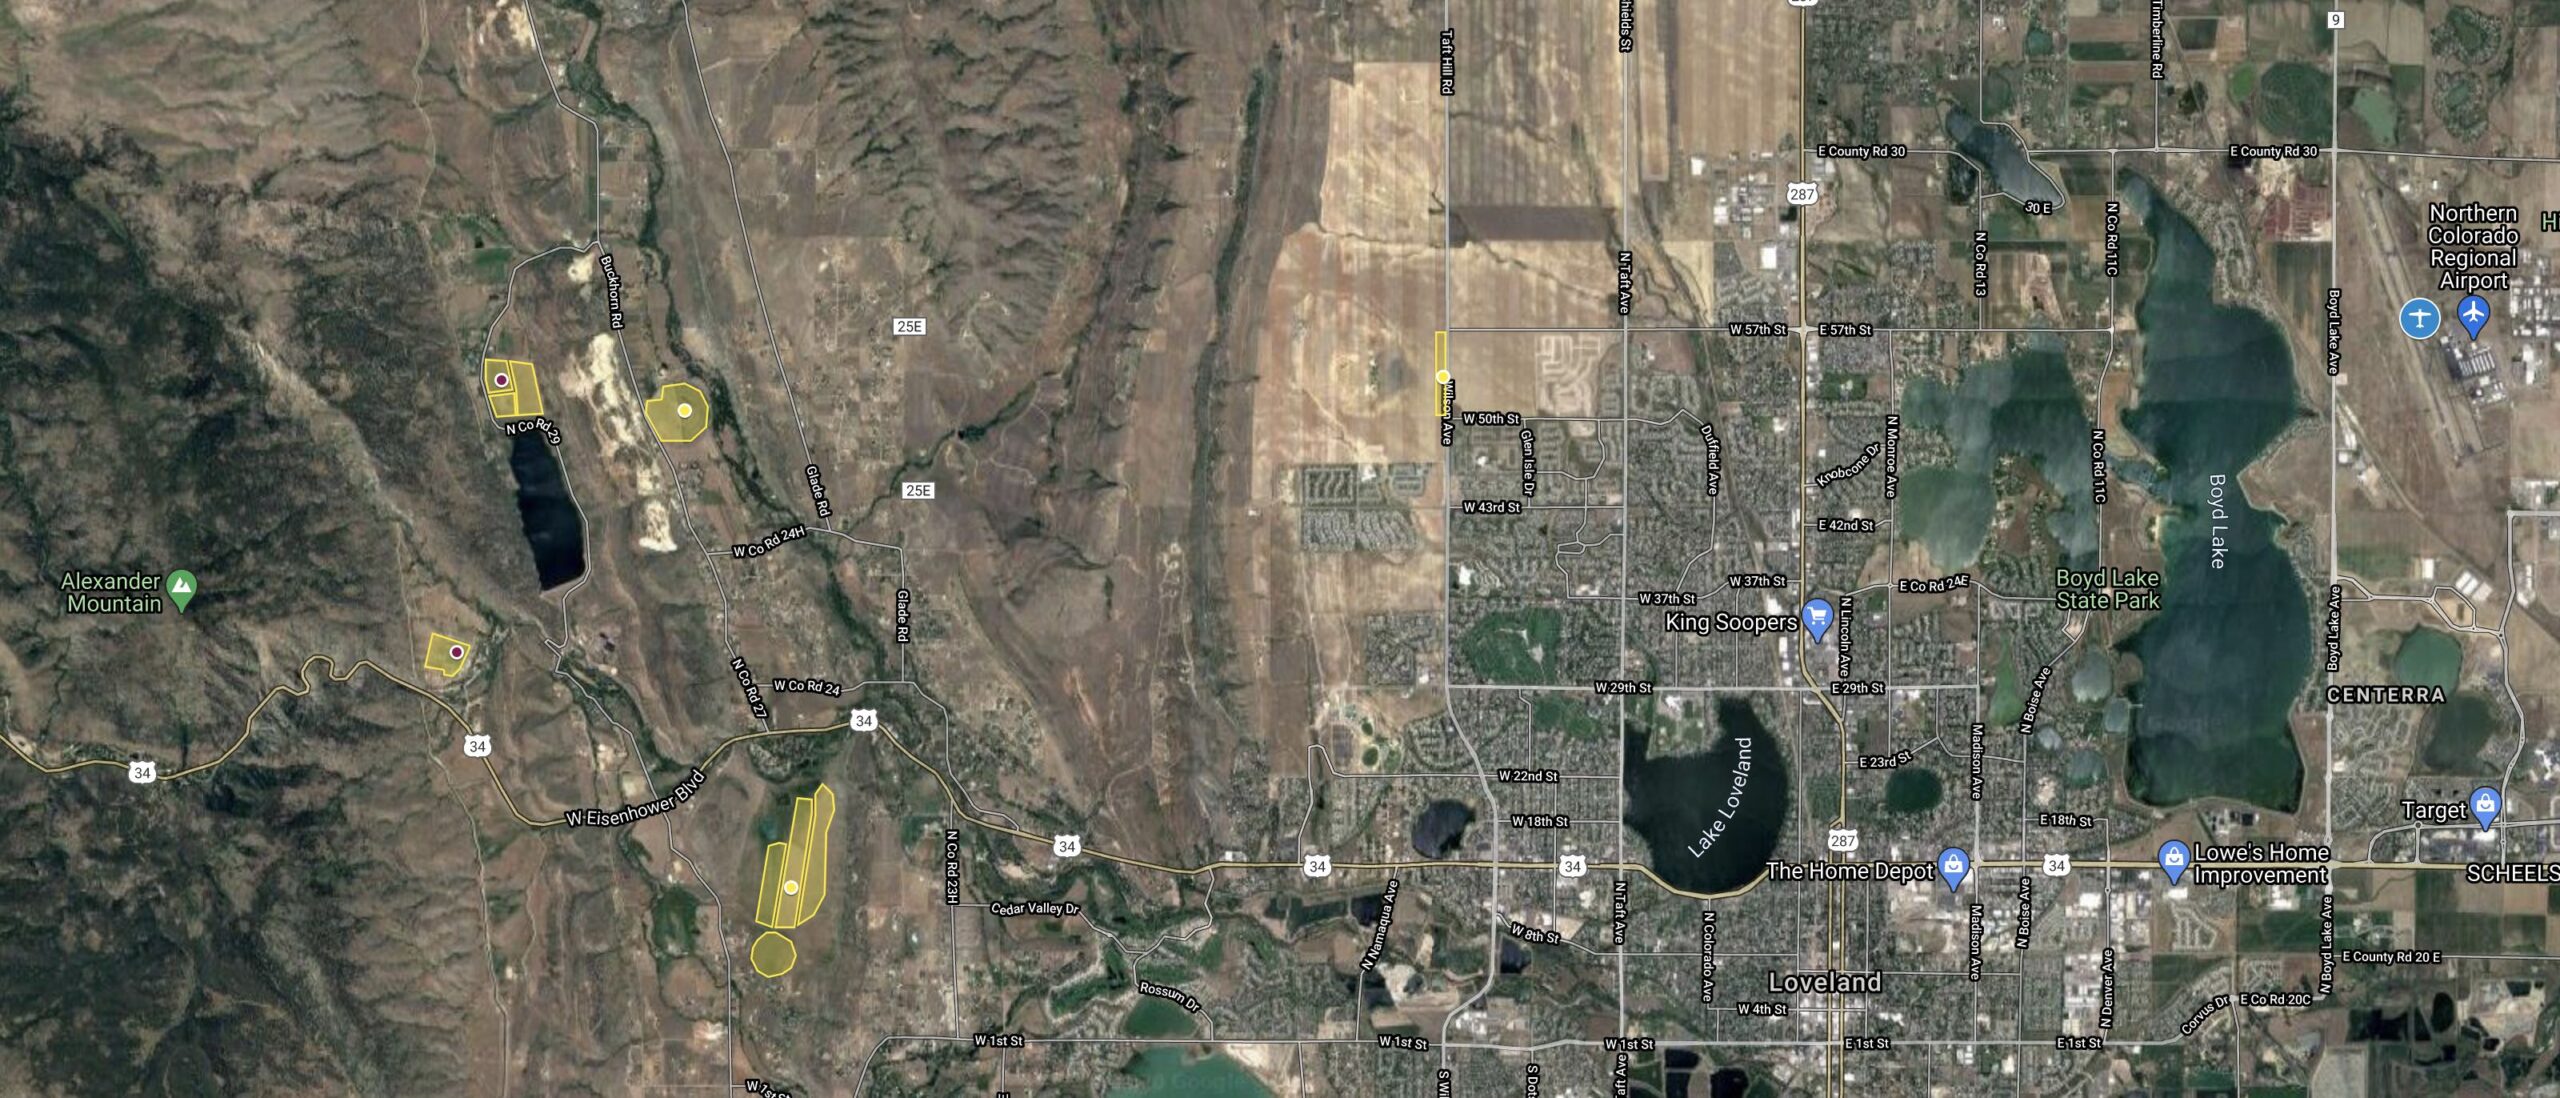
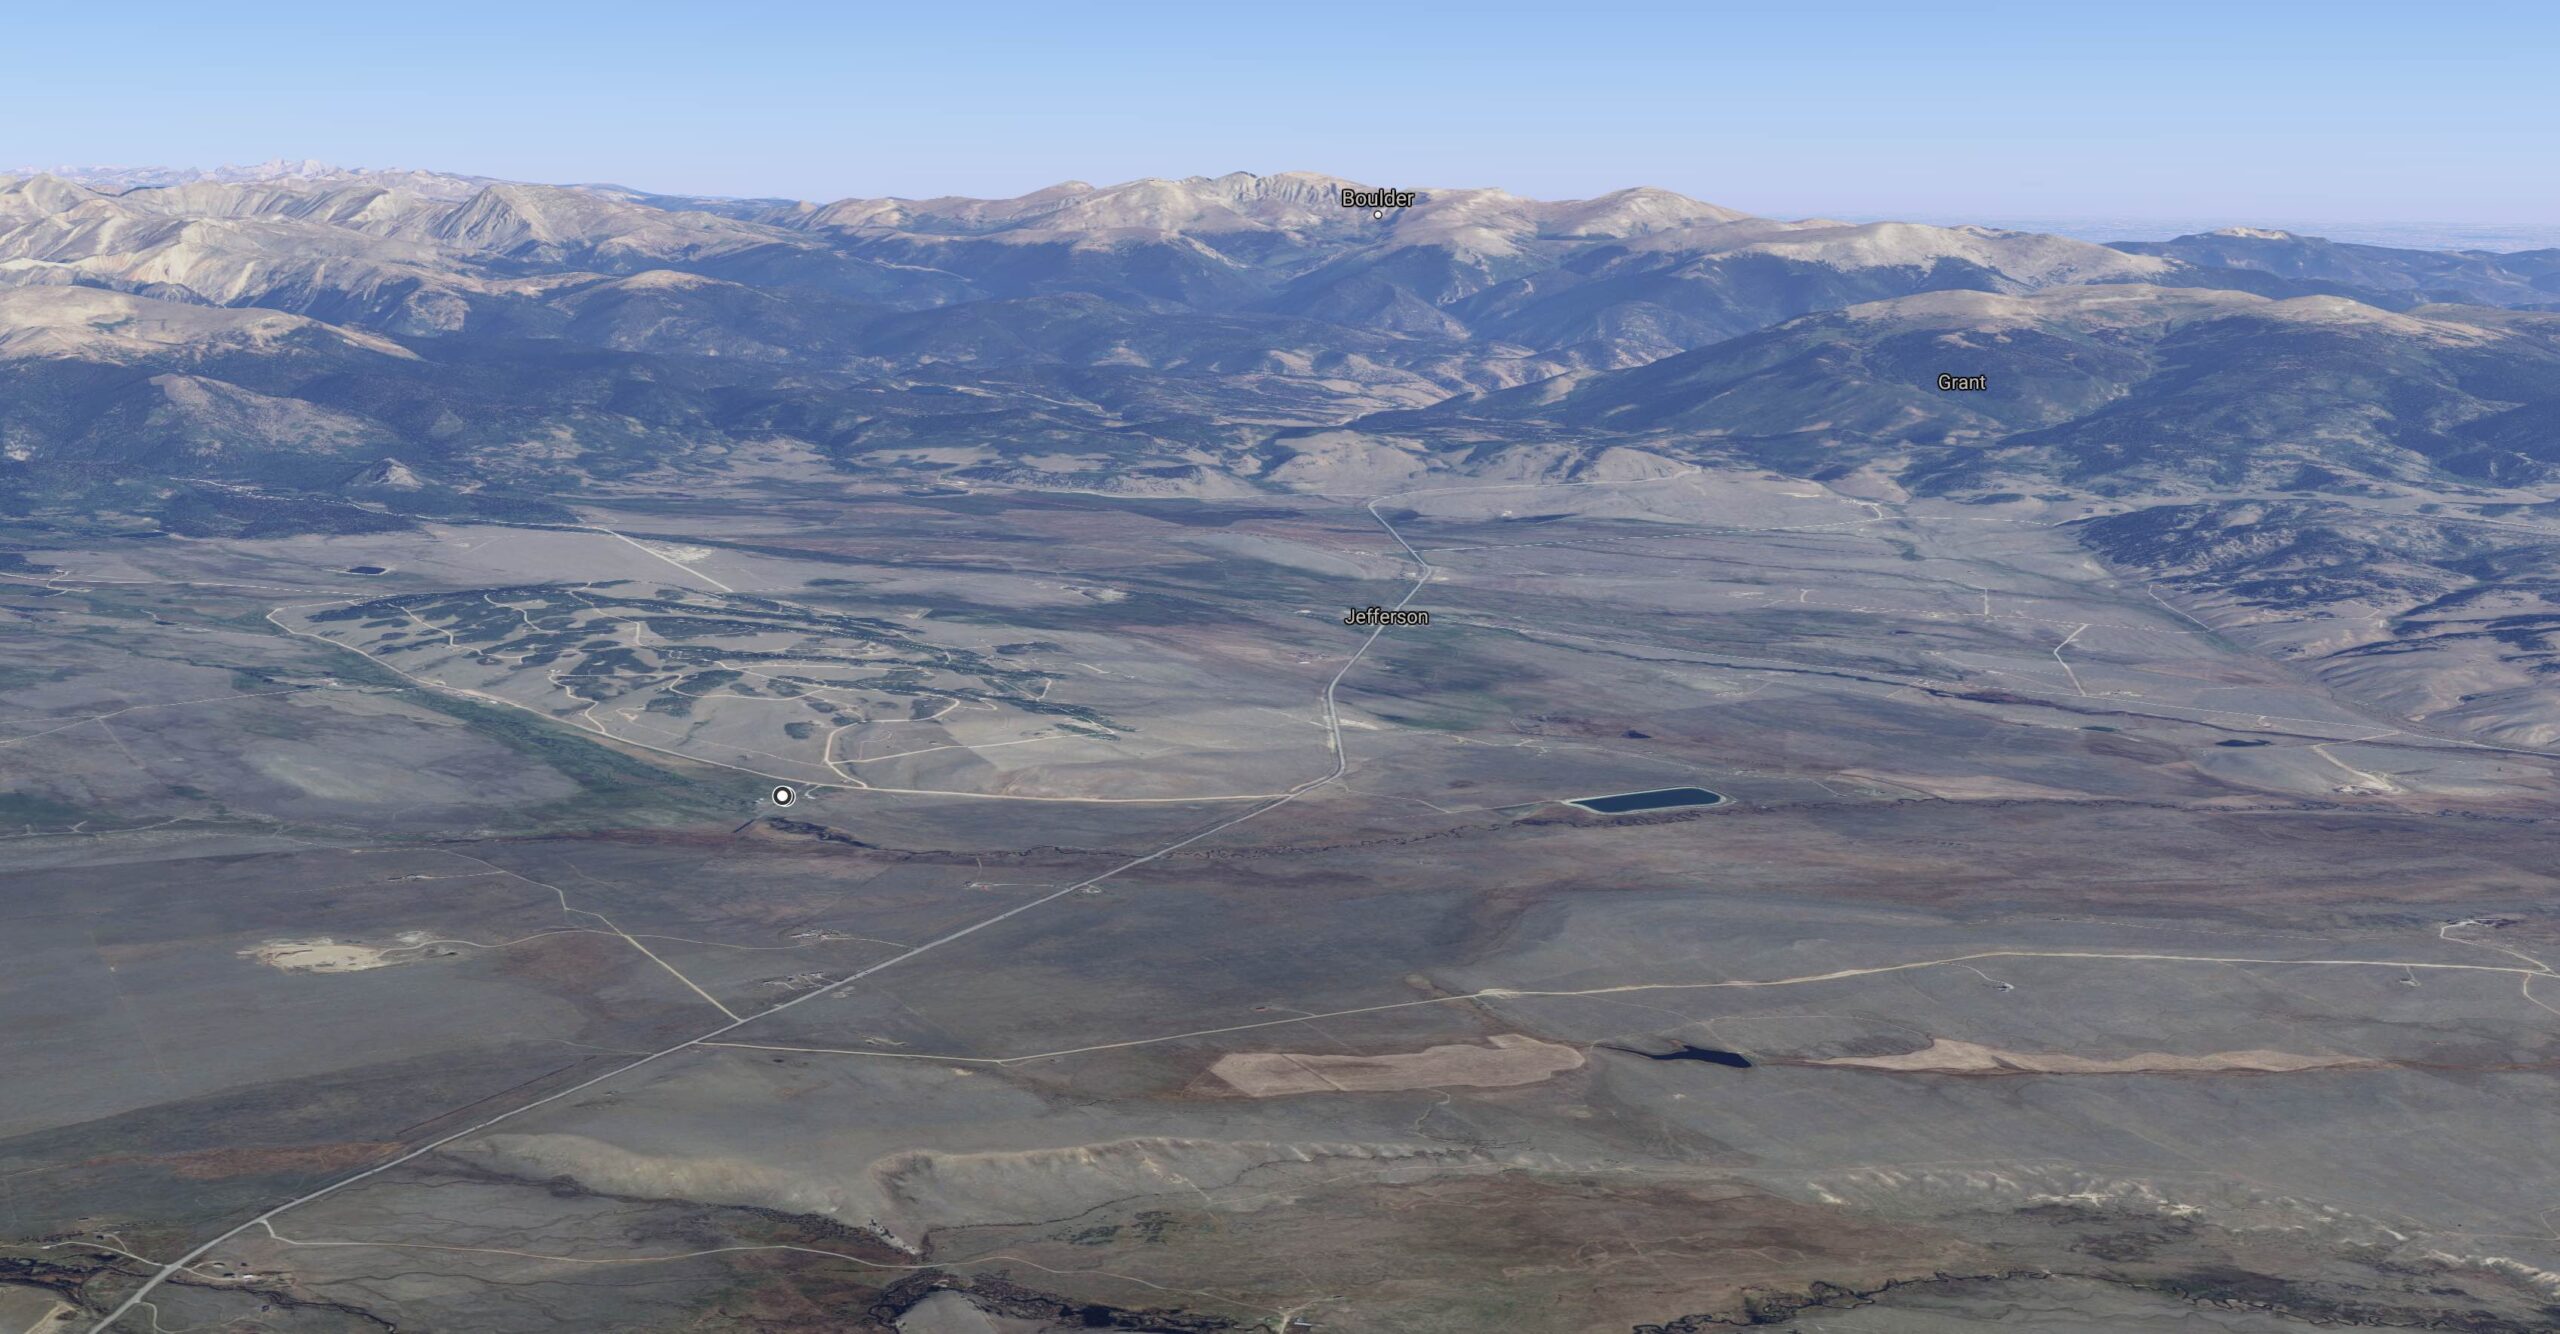

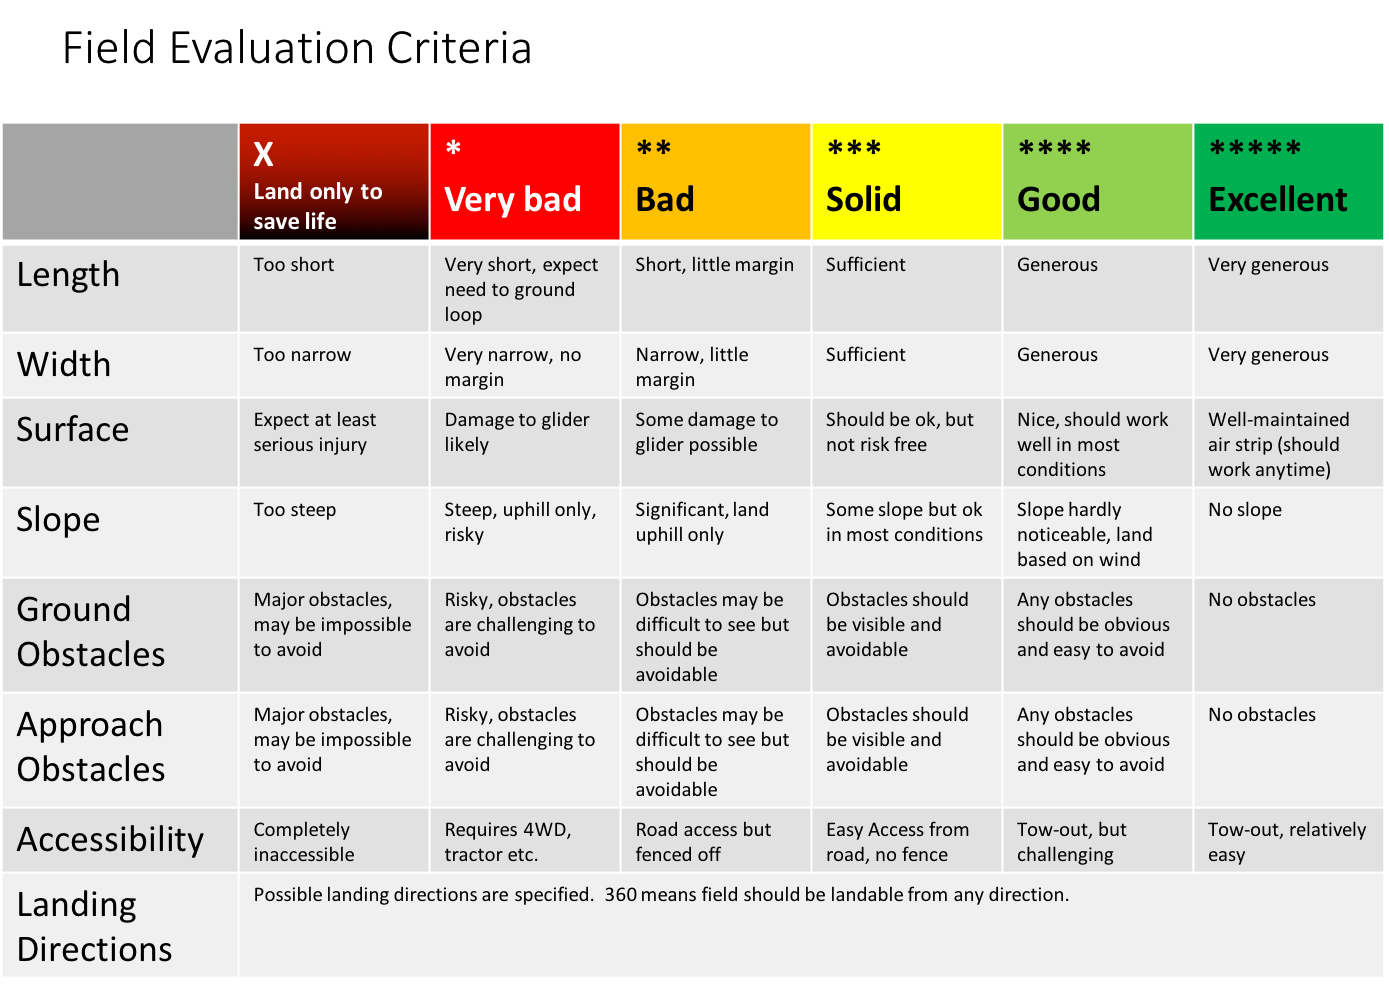
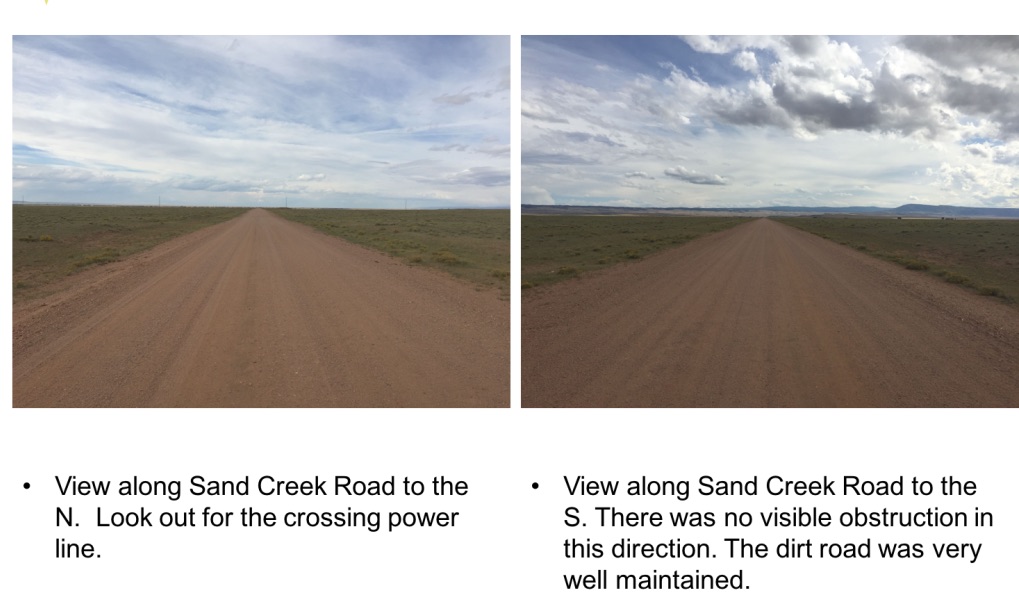
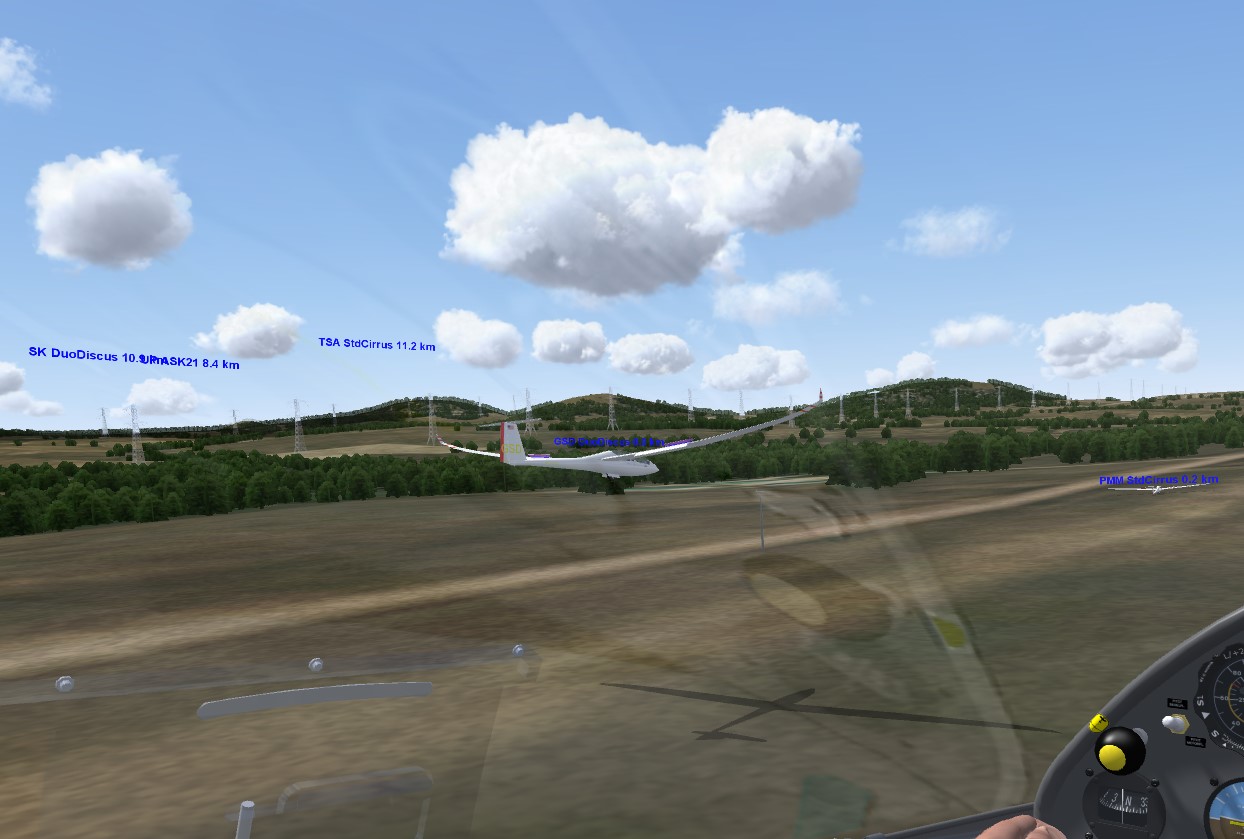
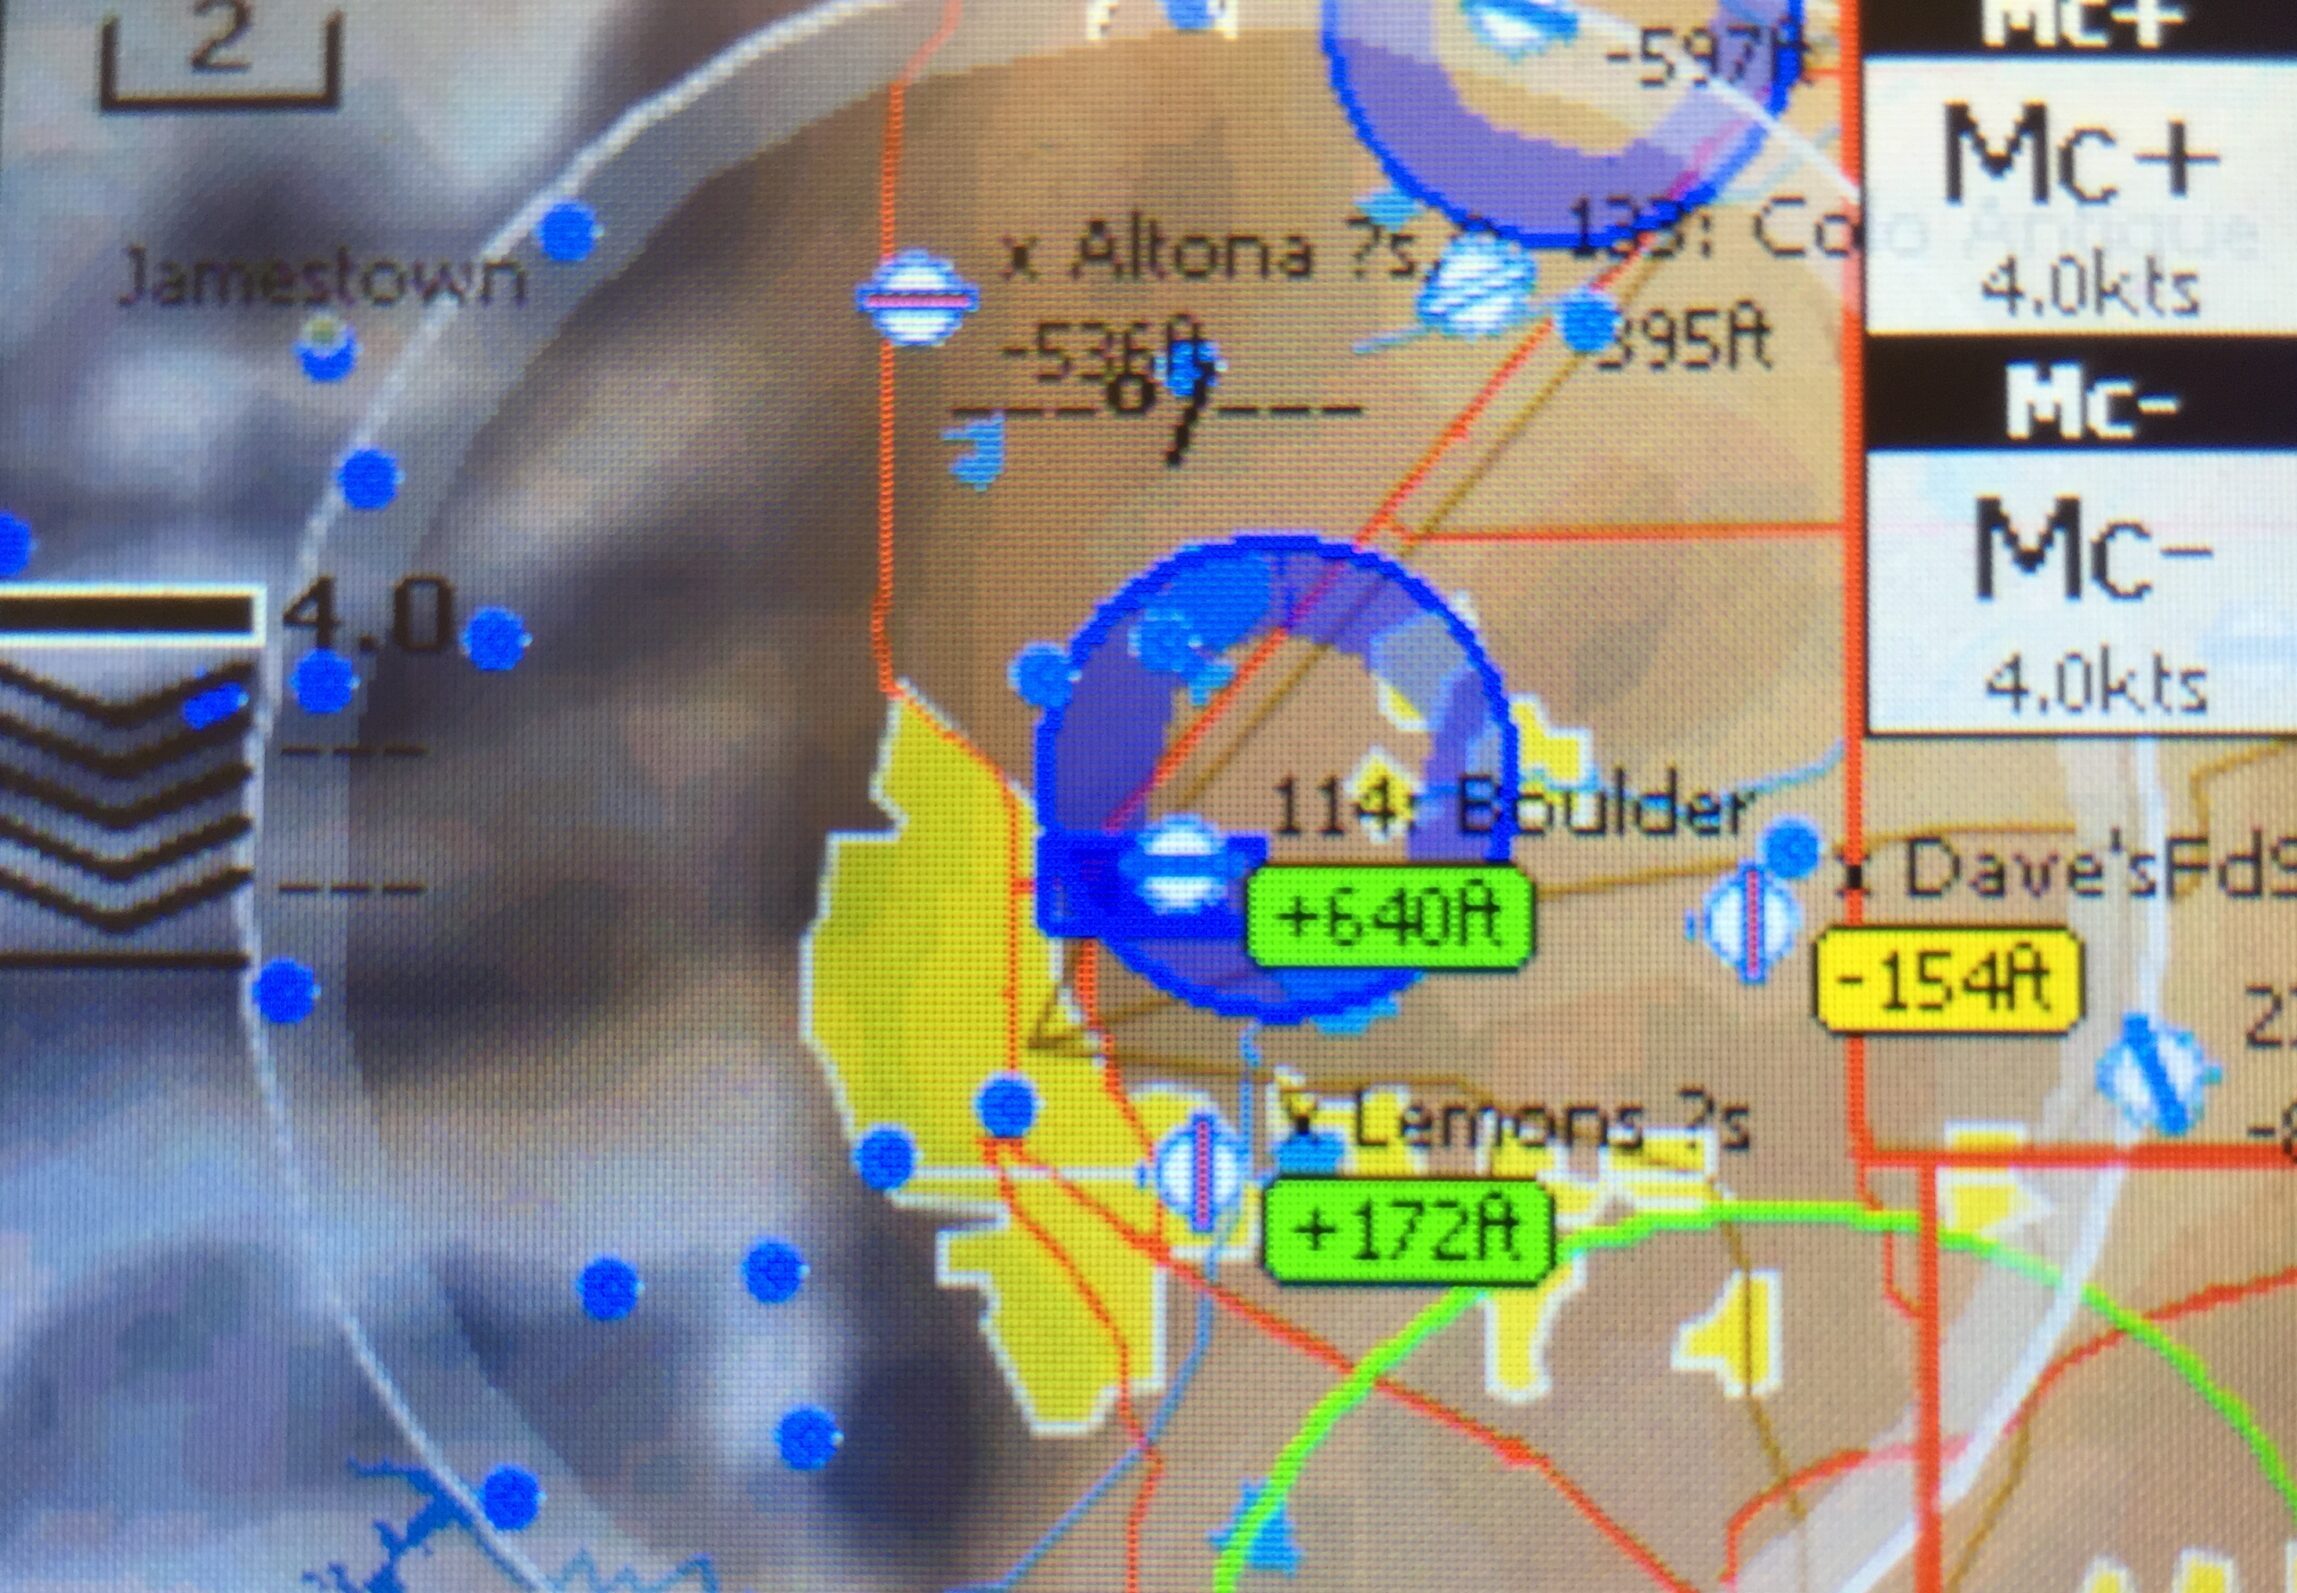
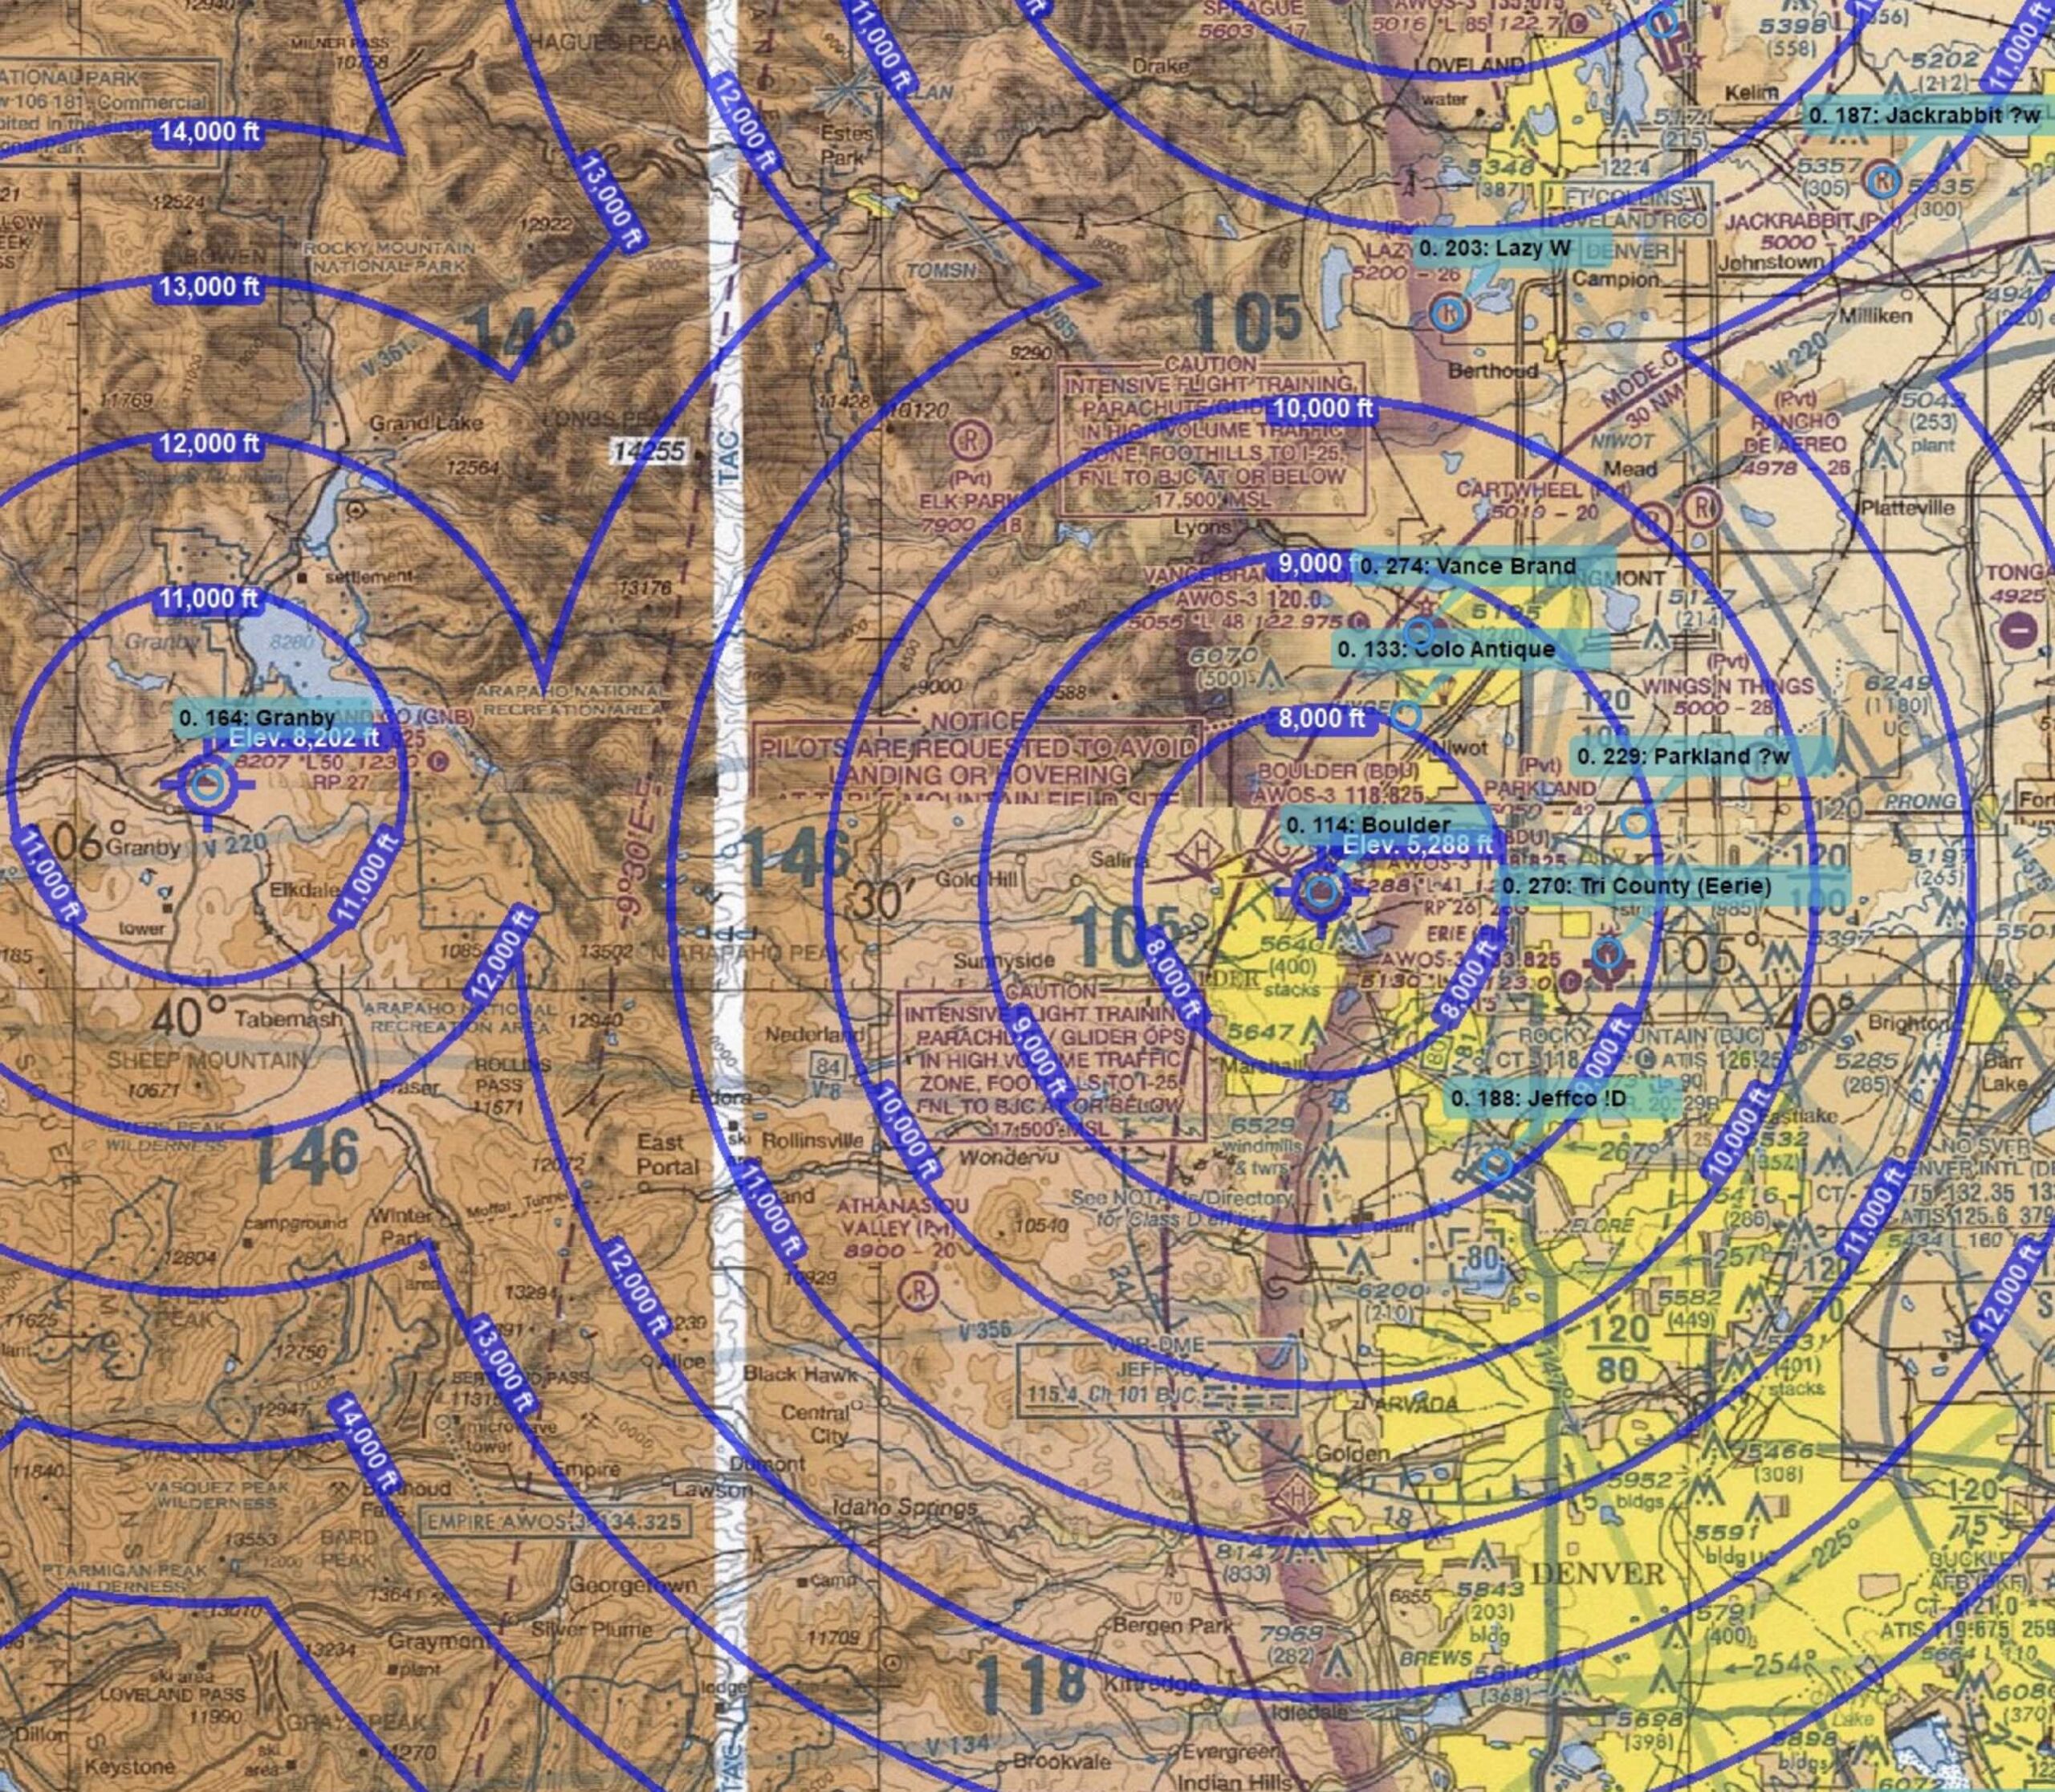
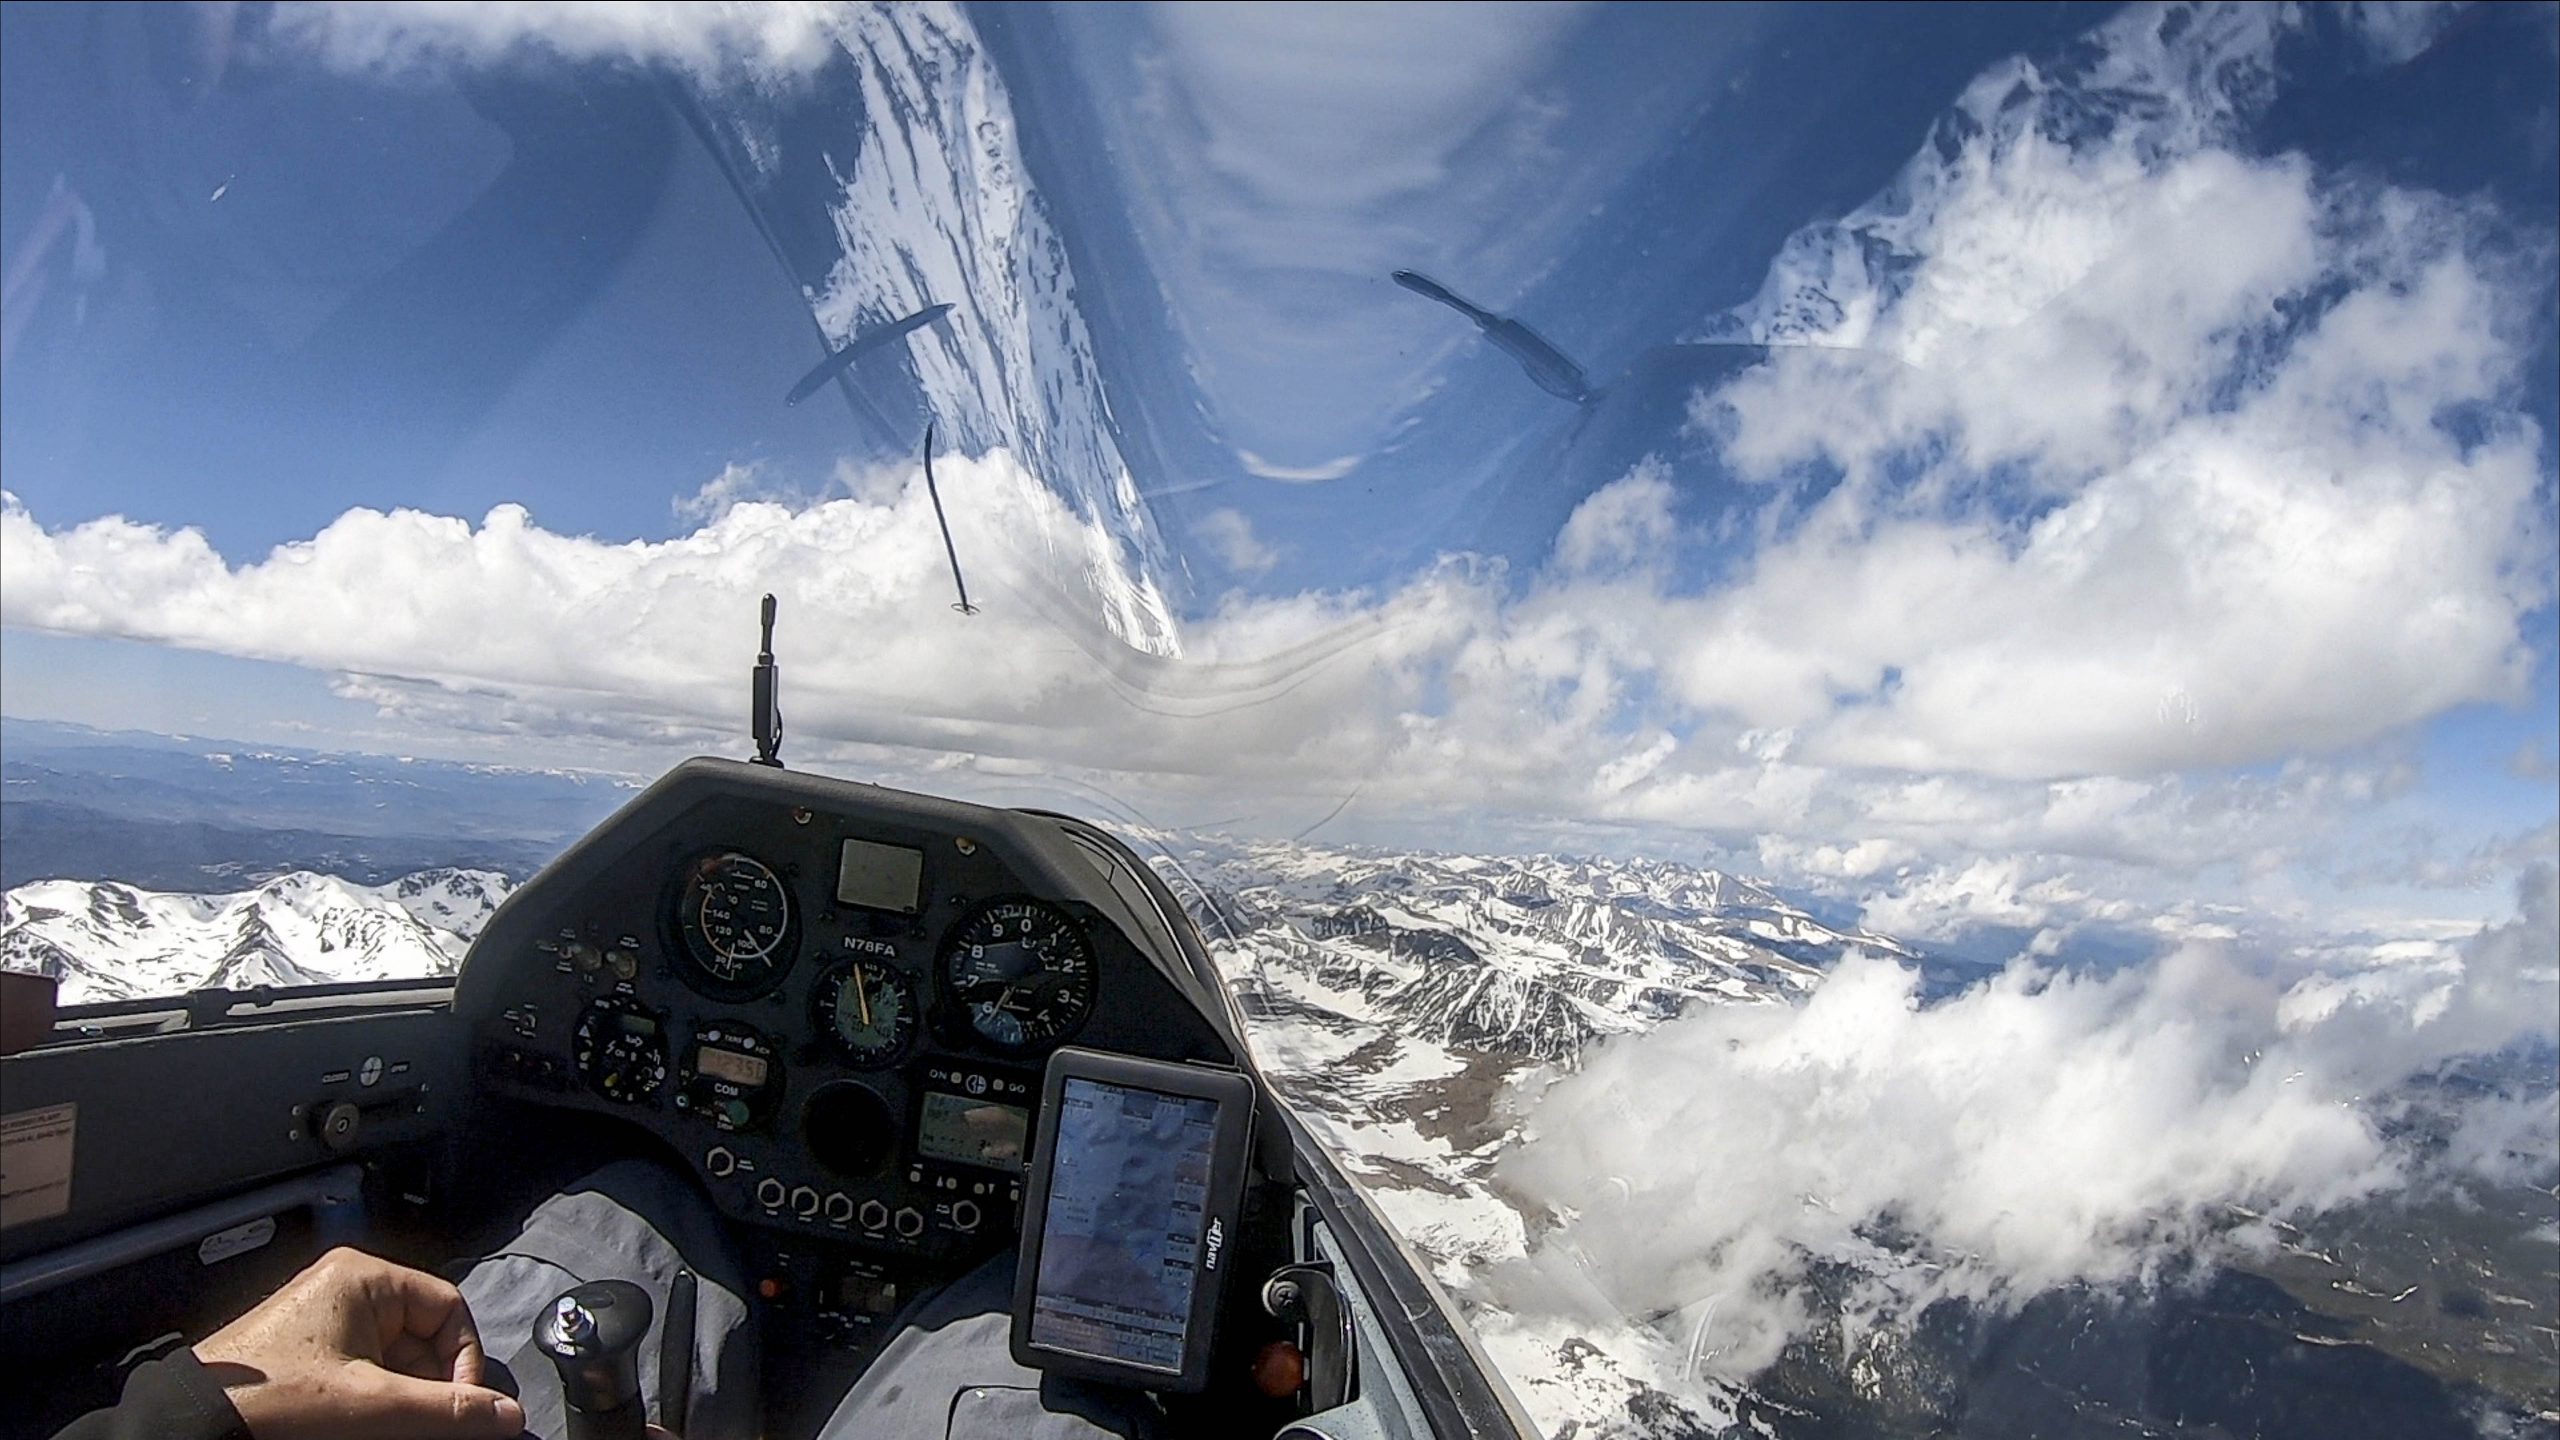
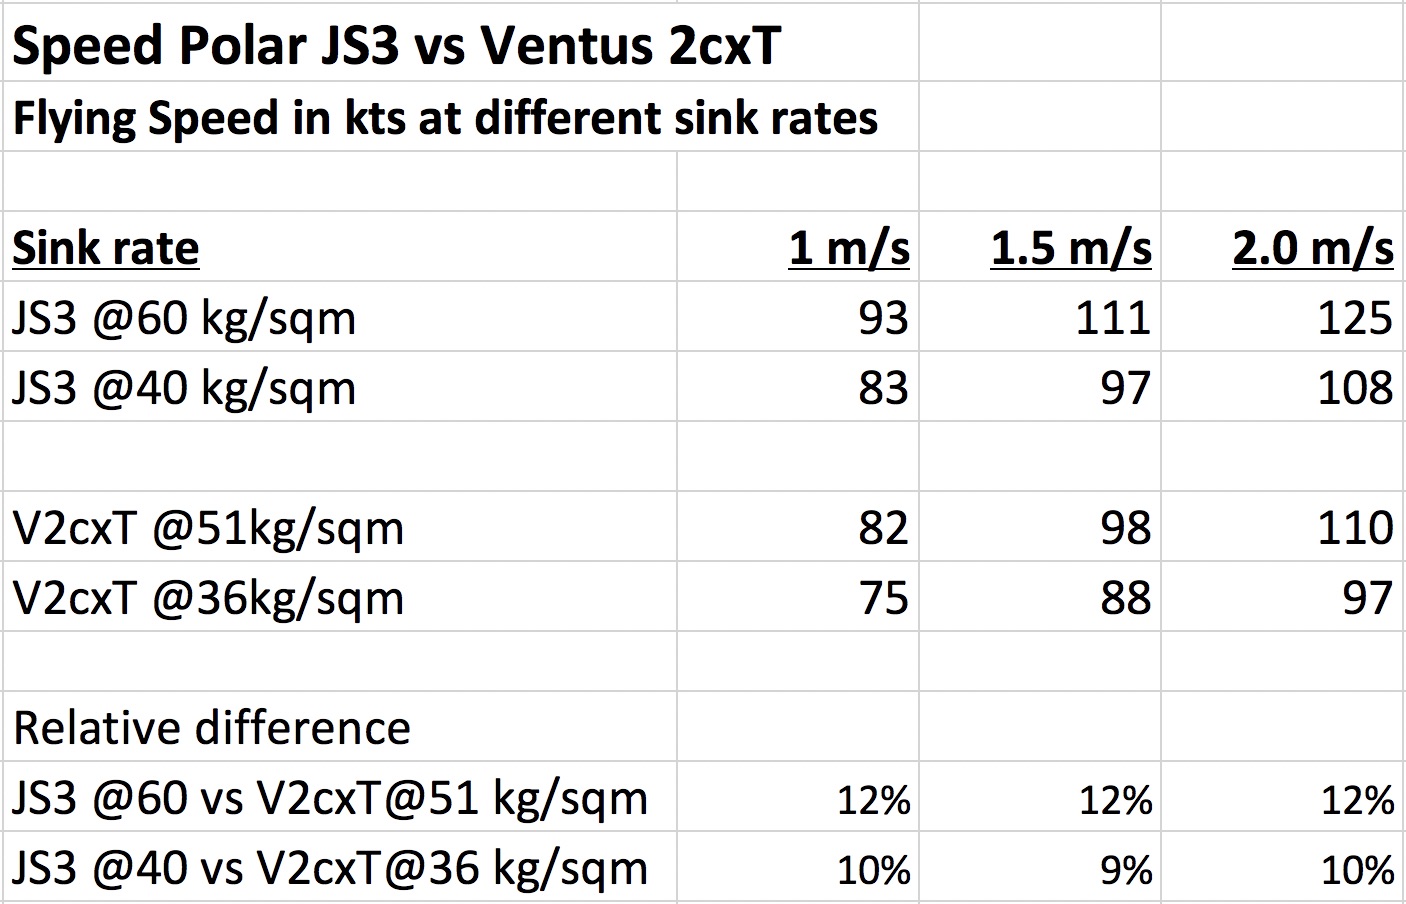
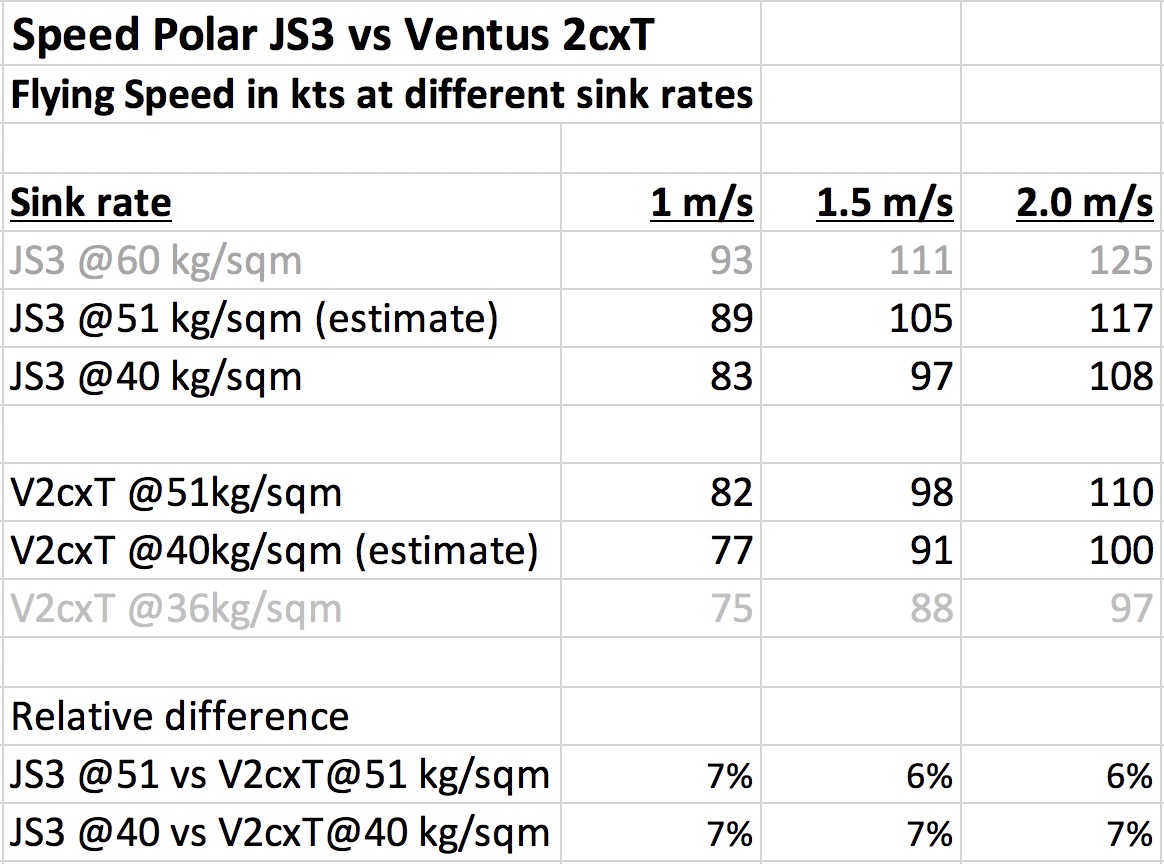
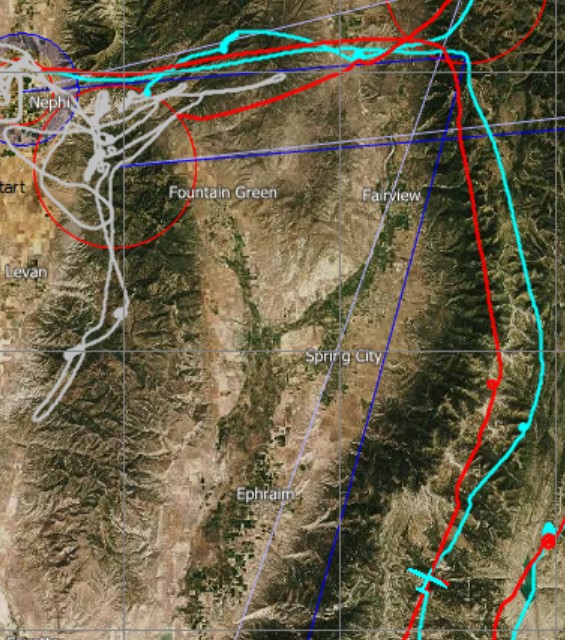
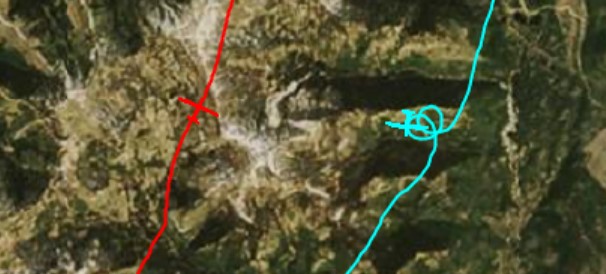
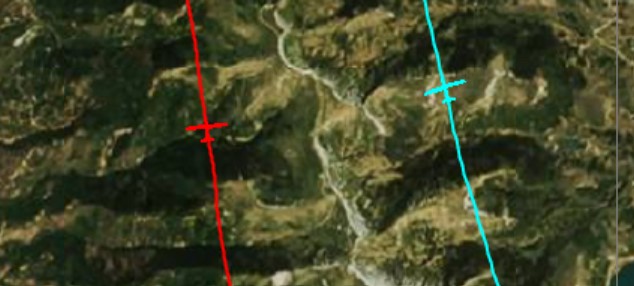
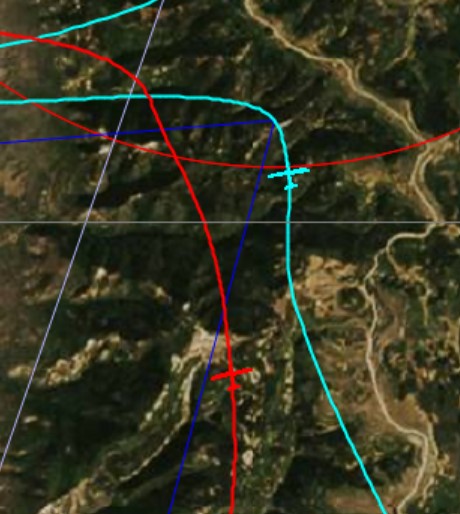
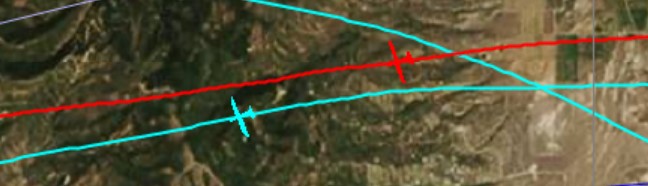
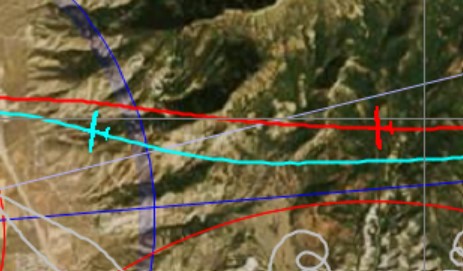
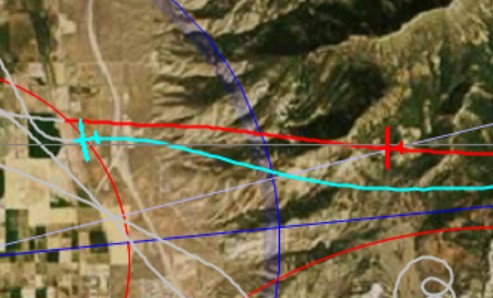
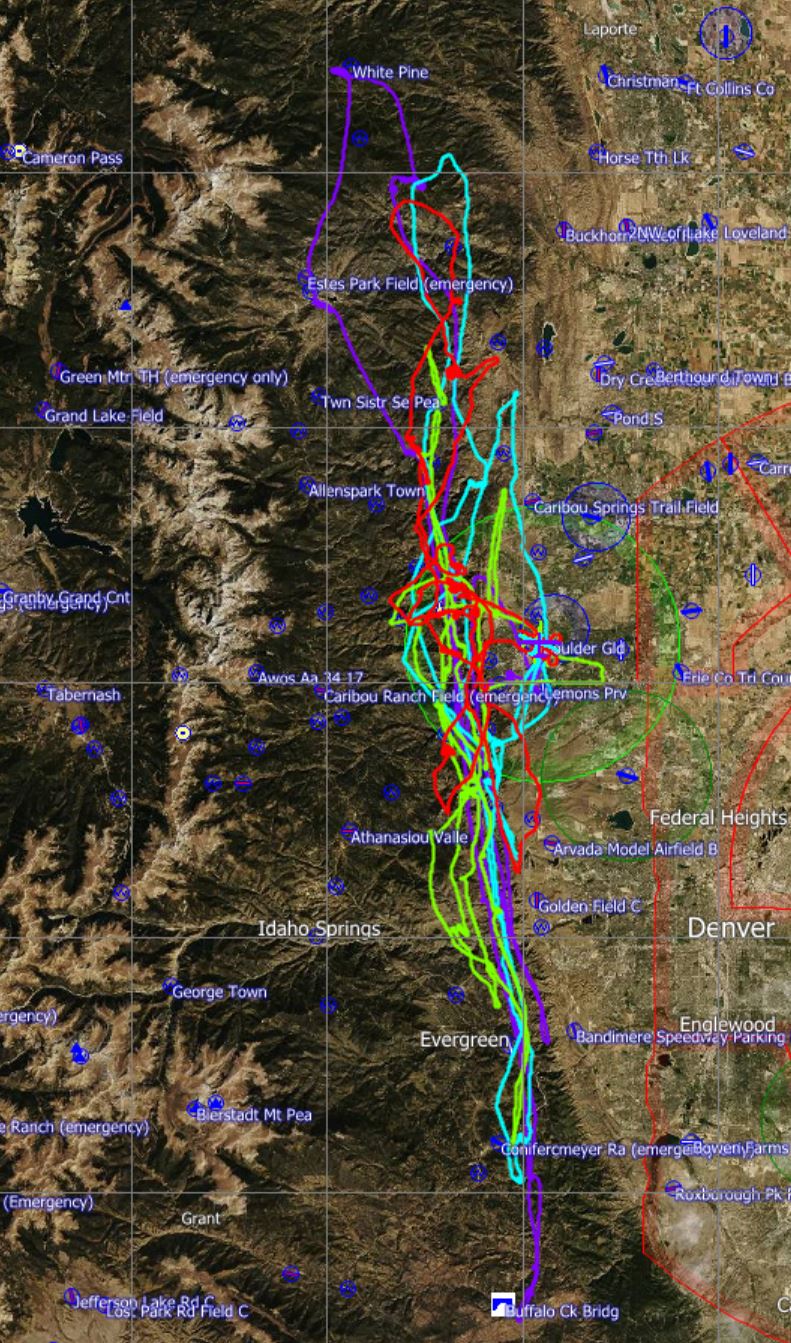
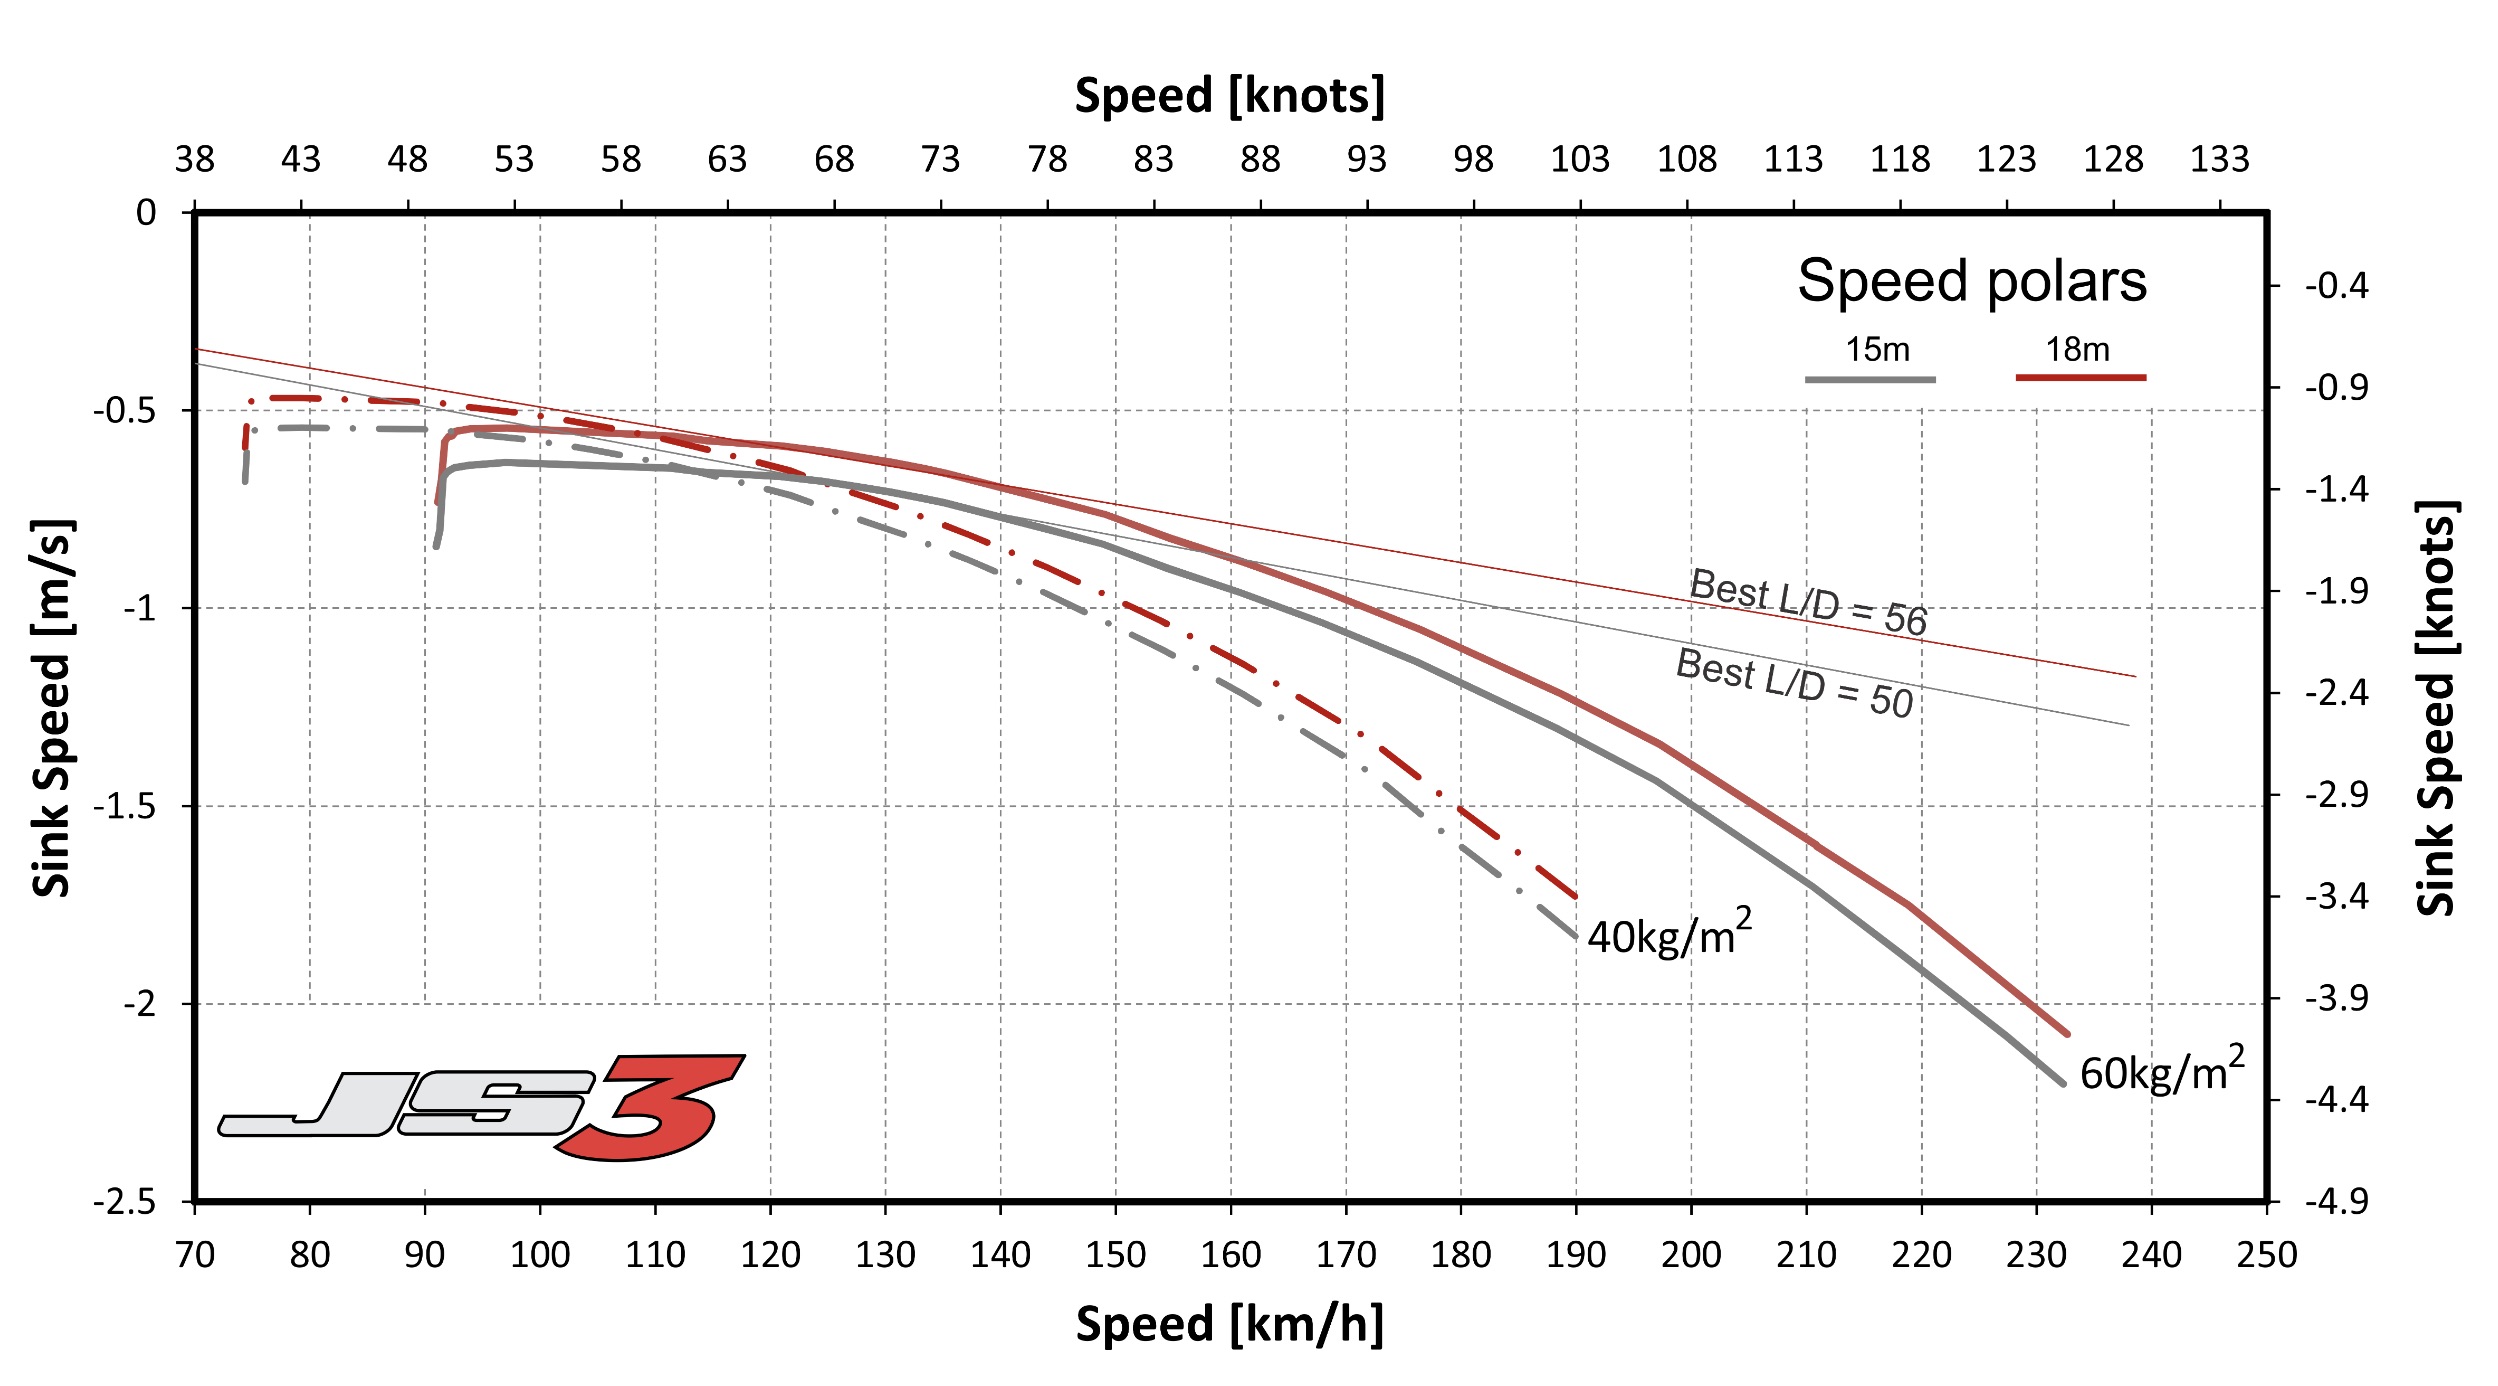