A little later than planned, here’s a review of my progress against the soaring goals I had set myself for 2022. Overall, I am pleased with my continued progress.
Goal #1 – Stay Safe by Heeding My Own Advice
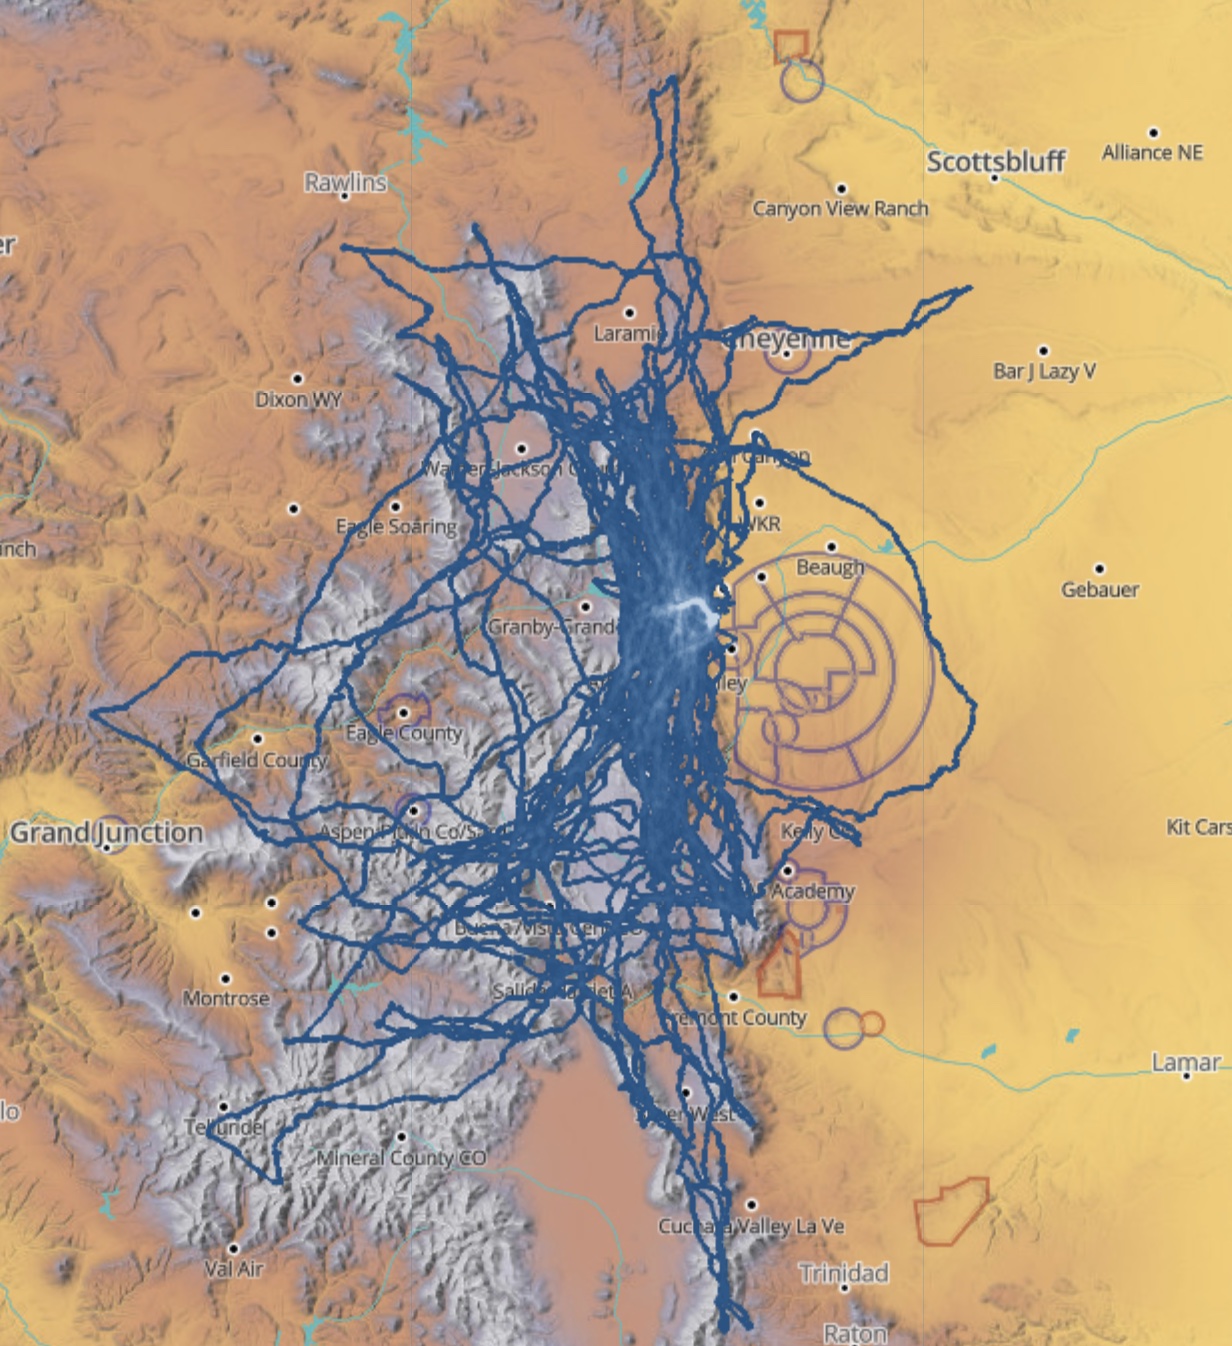
I think I can give myself an “A” on this one. In 2022, I flew more than 23,000 cross-country kilometers including 14,500 FAI triangle kilometers in 210 flight hours without accident or incident. I also cannot recall a situation that was objectively dangerous or even subjectively scary. I came close to landing out on two occasions but in both instances I had a suitable field picked out and within easy reach. I want to keep it that way.
Goal #2 – Continue to Improve My Soaring Skills
This one gets a “B+”. I flew 32 cross-country flights with an average flight distance per flight of 689 km. I did not fly any contests last year which means that the magnitude of my improvement is a bit difficult to measure. Among Boulder-based pilots I had the highest average cross-country speed at 116 kph for the year. My average for the 2.5 hour Speed League Segments was 130 kph, a major improvement over my 2021 average of 110 kph. I think key contributions to my speed improvements were my focus on flying more precisely during cruise portions of the flight, and flying a bit lower along powerful lift lines to minimize situations where I had to destroy energy near the top of the permissible airspace. This used to be a significant issue for me in prior years but only occurred rarely in 2022.
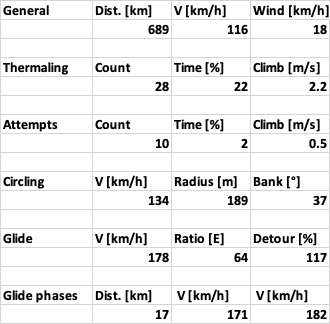
Of note is the glide performance for the entire year with an average achieved glide ratio of 64:1 across all flights while cruising at an average speed of 178 kph. In still air, my glider’s glide ratio at this speed is 33:1 so I obviously did a reasonably good job at cruising in lift. If I remove the first and the last leg of each flight (the first is usually focused on climbing out after tow release and the last one often destroys energy by returning high and descending with spoilers) my actual achieved glide ratio was even higher at 81:1 – definitely a key contributor to the good average speed.
My thermaling also got better. I spent 22% of my flight time thermalling and another 2% in thermaling attempts. My average climb rate for the entire year was 2.2 m/s (4.3 kt). I still thermaled a bit more to the right than to the left but my comfort level with left hand turns improved considerably. My average bank angle for all thermals throughout the entire year was 37 degrees, perhaps still a few degrees less from what many consider the “ideal” of 40 degrees. My average thermalling speed adjusted to sea level was 102 kph, just ~3 kph above my glider’s stall speed at 37 degree bank and full wing loading (99 kph at sea level with flaps in neutral). Considering that most thermalling is in flap position +2 (and not in neutral) I might still be going slightly too fast in the turns – but certainly not by much!
[Here’s the math for anyone interested: my actual average thermalling speed for the whole year was 134 kph at an average altitude of ~14,000 ft. Adjusted to sea level this is ~102 kph depending on air temperature. My glider’s stall speed in straight flight at max wing loading is 93 kph with flaps in neutral position. At a bank angle of 37 degrees the load factor is 1.066 (1 divided by cos(37)), i.e. the turning stall speed with neutral flaps is 93 x 1.066 = 99 kph. My actual altitude-adjusted speed of 102 kph is about 3 kph faster than stall speed with neutral flaps. This is estimated 10 kph faster than stall speed with flaps in position +2. The polar drops off sharply as stall speed is approached, so flying at 5-10 kph above stall speed in +2 flaps is probably ideal for circling so my average thermalling speed seemed to be about right.]
Some of my other specific performance goals turned out a bit hard to measure. E.g., one important goal was to avoid weak thermals and measure this by calculating the time spent in weak thermals. My specific target metric was to spend less than ~25% of thermalling time (after task start) in climbs that are less than 50% of the average climb rate for the day.
Unfortunately, I did not find an analysis tool that could easily calculate this. WeGlide provides the climb performance for each leg of each flight. Looking at that, I could not find any glaring issues. However, what would be needed is a tool that groups together the time spent in weak thermals and compare that weak thermal average to the thermal average of the day. Perhaps a software provider could develop such a tool. I would find it very insightful.
To get a better sense of the magnitude of my improvements I will need to fly more contests and obtain more direct comparisons with other pilots.
Goal #3 – Flight Achievement Goals
I can give myself an “A” in this category. I had set the goal to achieve 5 of a portfolio of 12 ambitious achievement goals. I accomplished 6 of them and overachieved on some of these goals:
- I became the first pilot to complete a declared 1000 km FAI triangle in Colorado; thereby setting new Colorado open class distance records for overall distance, free triangle distance, and distance of up to 3 turnpoints. This flight also earned me rank #9 for the year in the worldwide OLC Barron-Hilton-Cup competition.
- Set new Colorado open class speed records for 500 km out and return speed, 750km triangle speed, and 1000km triangle speed
- Not only bagged some additional 14ers peaks but completed the entire Colorado 14er Challenge
- Achieved my 1000 km Diplome
- Completed not one but two return flights from Boulder to the border of New Mexico
- Became the second pilot to successfully circumnavigate the Denver Class B airspace
The portfolio goals that I did not accomplish were:
- Border to Border Challenge (Boulder to NM, WY and return) – tried and failed three times
- Flight from Boulder to Nephi, UT or to Moriarty, NM – and returning the next day – never tried
- In the OLC+ Championship worldwide I finished in position 68, missing my goal of getting into the top 50; in the US I finished in position 13, missing my goal of breaking into the top 10
- In the OLC Speed Championship worldwide I finished in position 57, missing my goal of breaking into the top 50; and in the US I finished in position 20, accomplishing my target of breaking into the top 25.
- I flew no contests in 2022.
My Speed League contribution was a bit mixed. I only flew on 7 Speed League Weekends. When I did, I managed to always score among the top three Boulder pilots, achieving my goal of scoring among the top 3 Boulder pilots at least 75% of the time. Bob Faris made once again the biggest contribution to SSB’s Speed League result by flying on 12 weekends and scoring first 5 times.
Goal #4 – Giving Back
I would say this one gets an “A-“. I did not write nearly as much as I had hoped but I was able to reach worldwide audiences with my presentations at Late Night Soaring and at the annual Austrian glider pilot’s convention. I also presented to individual clubs and some of my articles were translated into French and Spanish. In addition, a tremendous amount of work went into community work in Boulder to address local challenges as club president.
Coming Next: My Soaring Goals for 2023
Mr. Ceipek, thank you for sharing your knowledge and insight into our dynamic atmosphere. I have spent many hours reviewing your soaring and safety videos. It is a great help for someone that is new to the sport. (Soloed 9/17/22). Thank you for your effort in providing these materials!
Hi Doug – thanks for the kind words and good luck on your own soaring journey. One great thing about it is that we never stop learning!
You also inspired many pilots in the Soaring Society of Boulder. My students talk about your achievements and want to soar better.
Congrats again on the 1,000k declared triangle in Colorado!
I am not sure how you improve on the 2022 achievements, but look forward to watching and reading.
I’m taking your advice to set goals each season and it’s definitely helped me progress. Soloed last month. Looking forward to next season.