There are several things to consider when forecasting wave conditions:
(i) the direction and strength of the wind: is it strong enough and blowing at the right angle over the ridges? does it increase with altitude? is there wind shear aloft that could destroy the wave flow?
(ii) the stability of the air at the level of the ridge tops and the depth of the convective layer throughout the day: will the convective layer be shallow enough that the wind pushes the air down the lee slopes or will the convection reach well above the tops of the ridges such that thermals will destroy the wave flow during the day?
(iii) the moisture content of the air at different altitudes: will there be rotor and/or lenticular clouds? will the rotor clouds be shallow enough that climbing into wave is possible?
- What are some basic tools to use to forecast wave conditions?
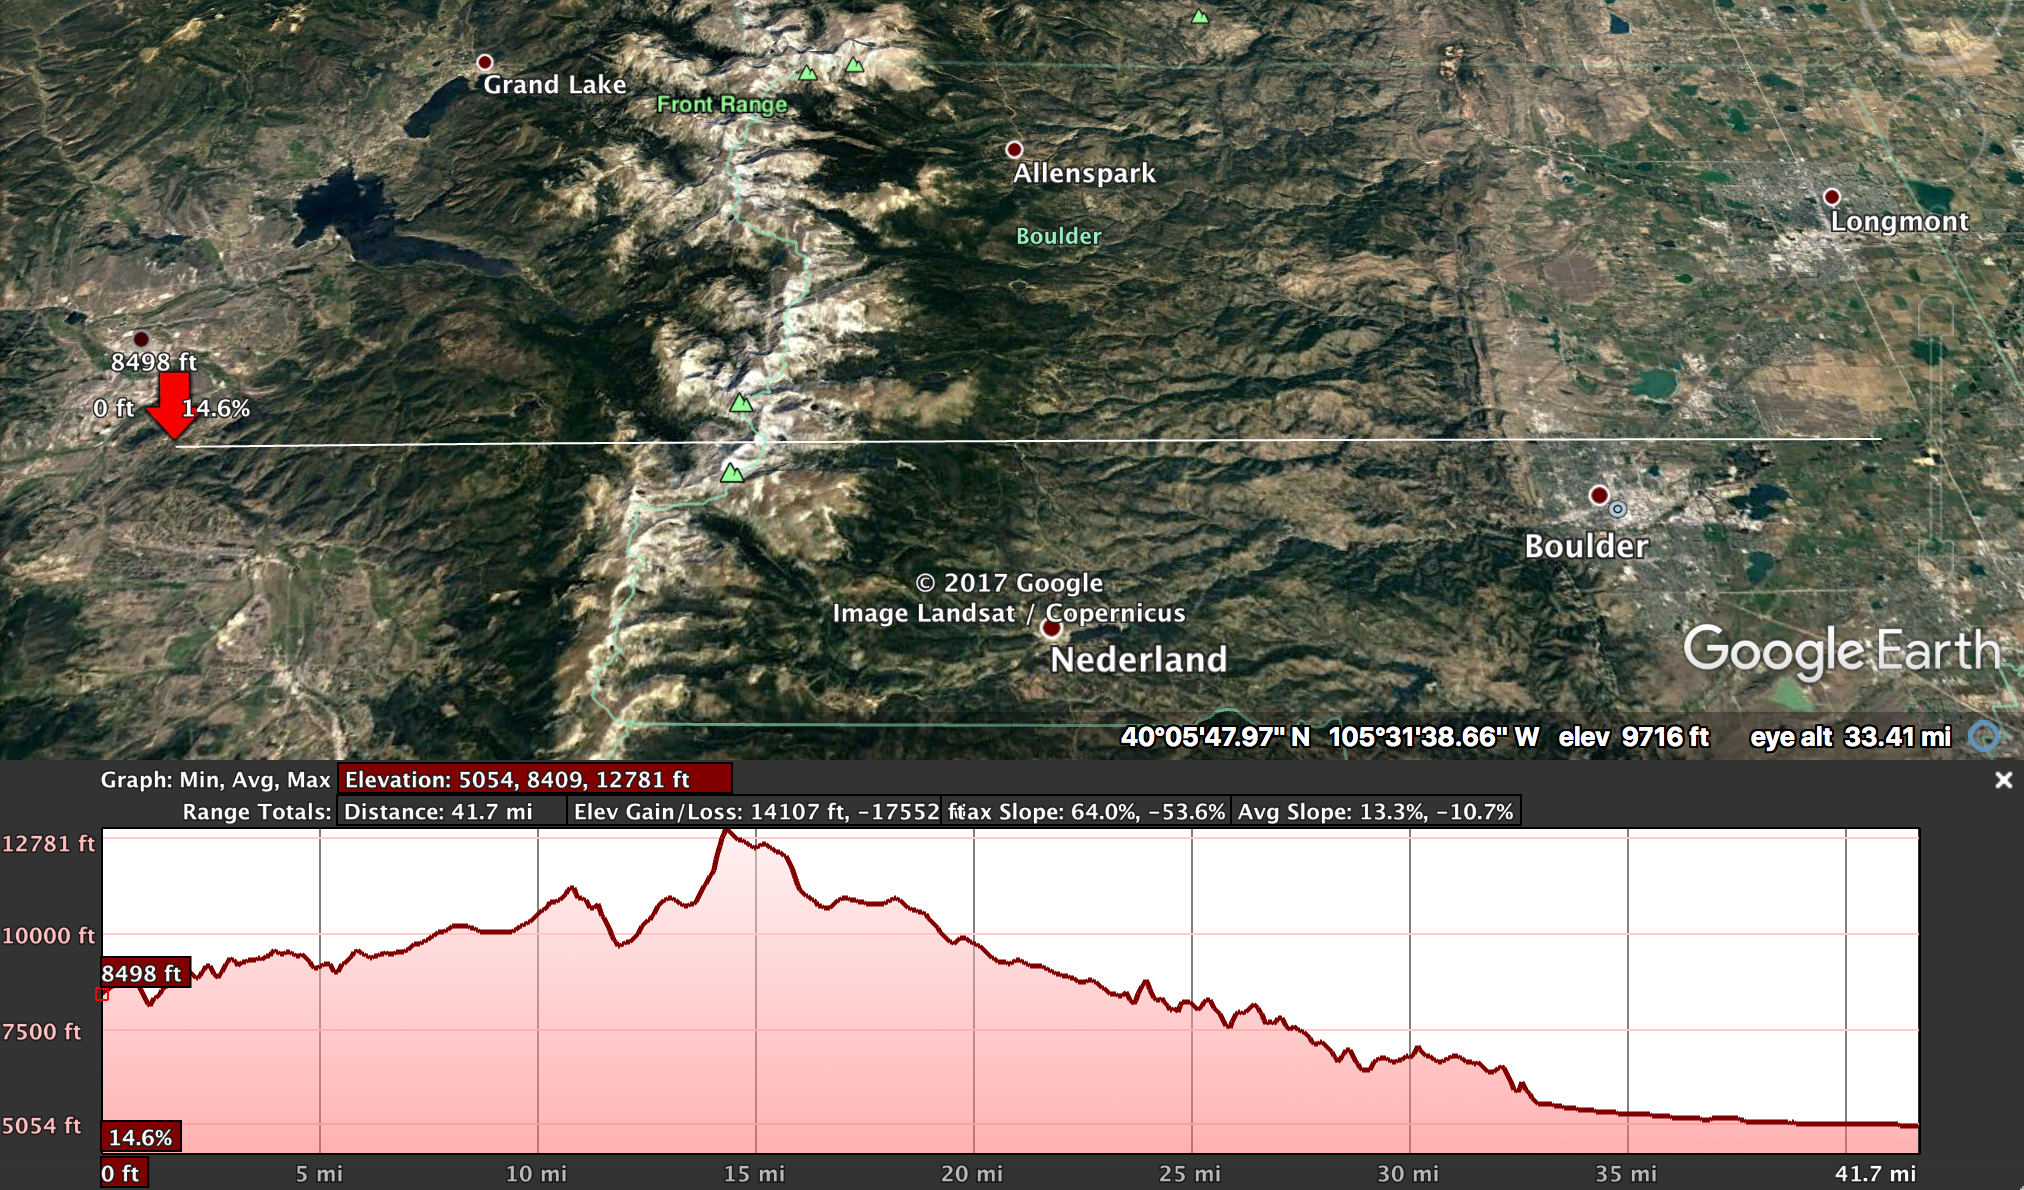
The following examples are based on the topography within the Arapahoe Wave Window to the West of Boulder, CO. Here’s a map and cross section of the area:
– Winds aloft
A simple place to start is a forecast of the winds aloft like the following. To see the current forecast for Denver, CO click here. The drop down menu allows you to adjust this to other locations in the US.
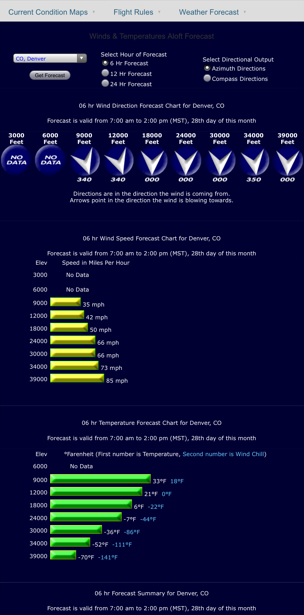
The ridge tops of the Front Range are between 12,000 and 14,000 ft. The yellow bars in the graph above show that at 12,000 feet the wind speed is 42mph – more than strong enough for wave. It’s also easy to see that the wind speed increases with altitude. The arrows show that the wind direction varies from 340 degrees at 12,000 feet to 360 degrees above. The small directional is not an issue but the direction of the wind itself simply does not work for the terrain: The Front Range runs in N-S direction and winds from the N will just flow along the mountain range, not trigger wave. The green bars are handy as well as they show you how to dress for the temperatures aloft: -7F in 24,000 feet is rather chilly.
– Sounding
The most useful tool for forecasting wave is a sounding diagram like the one below. This chart can be found on this page (the second row from the bottom has the forecast for Boulder, CO).
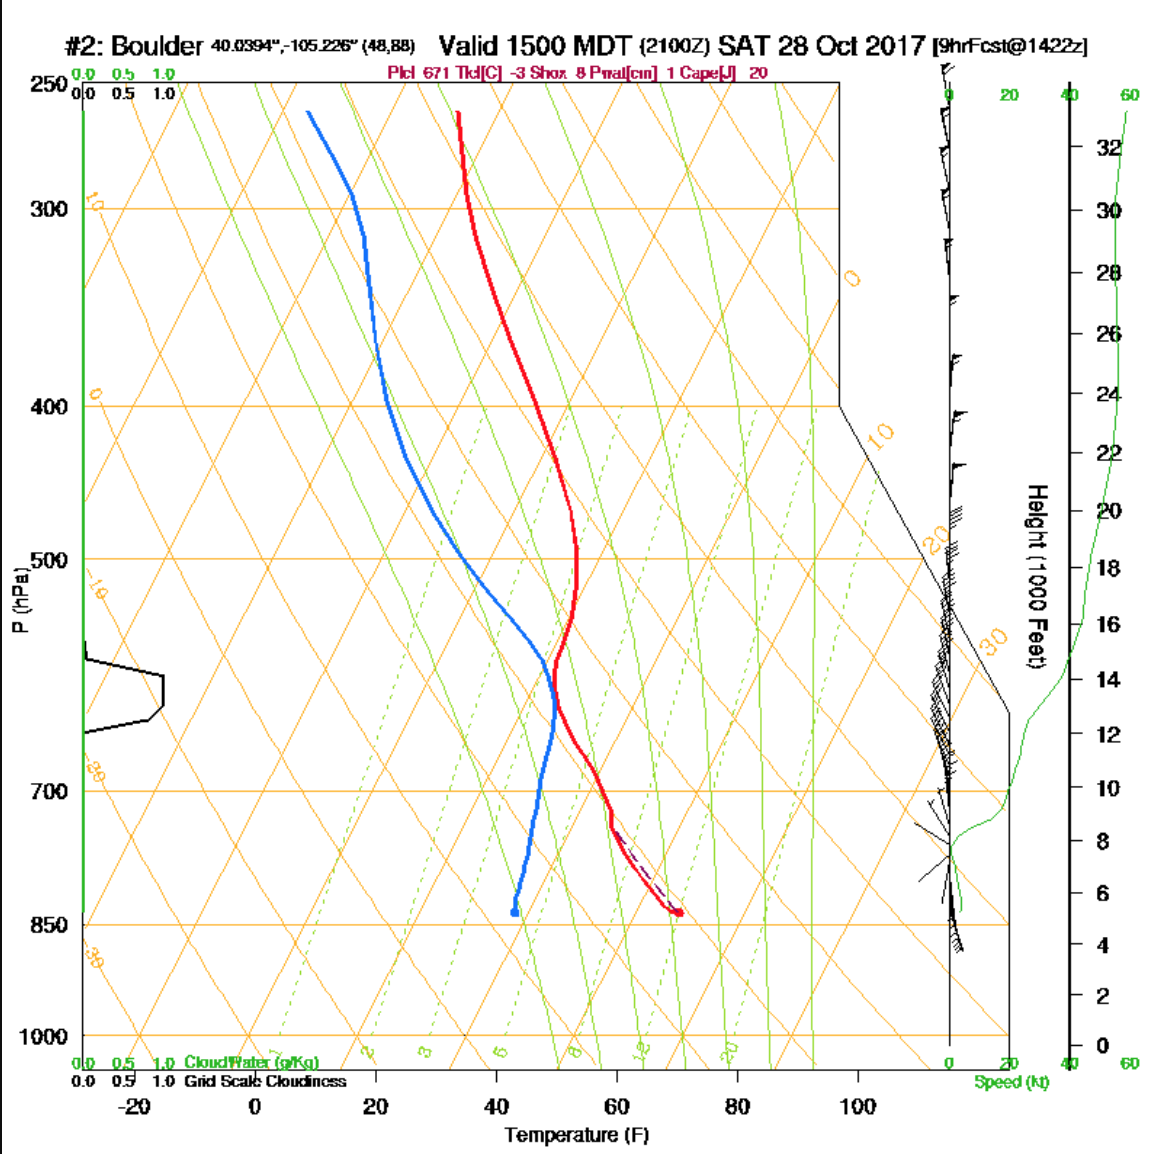
A lot of the pertinent information can be gleaned from this one single chart:
Wind Direction and Wind Speed: The chart above indicates calm conditions (or weak southerly winds) from ground level to about 8,000 feet. The green line shows the wind speed increasing to about 25 kts at 12,000 feet and to 40 kts at 14,000 feet (the height of the Colorado Front Range). Above 14,000 feet the wind speed continues to increase gradually to about 60 kts at 36,000 feet. So far, everything looks good for the propagation of lee waves. (The increase in speed from 25 kts at 12,000 ft to well over 40 kts at 18,000 feet represents a factor of >1.6 – a sufficiently strong acceleration to “trap” the waves and create a wave train.) However, the wind direction is a problem: the black wind barbs show that above 8,000 feet the wind is blowing from Northerly directions all the way to 36,000 feet. (As we already saw in the Winds Aloft chart above, the northerly winds will flow along the mountain range and wave conditions should therefore not be expected.)
Stability: the red sounding shows an inversion between 13,000 and 18,000 feet, so just above ridge top level. For excellent wave conditions it would be even better for the inversion to be directly at ridge top level (in this case between approx. 11,000 and 15,000 feet) with slightly less stable air above.
Humidity: the blue line shows the dew point at various altitudes. If the red temperature line and the blue dew point line touch or come into close proximity, clouds will form. In this case you would expect a layer of clouds over Boulder between approx. 12,000 and 14,000 feet. (As I look out the window writing this on the day of the forecast shown, this is indeed the case.)
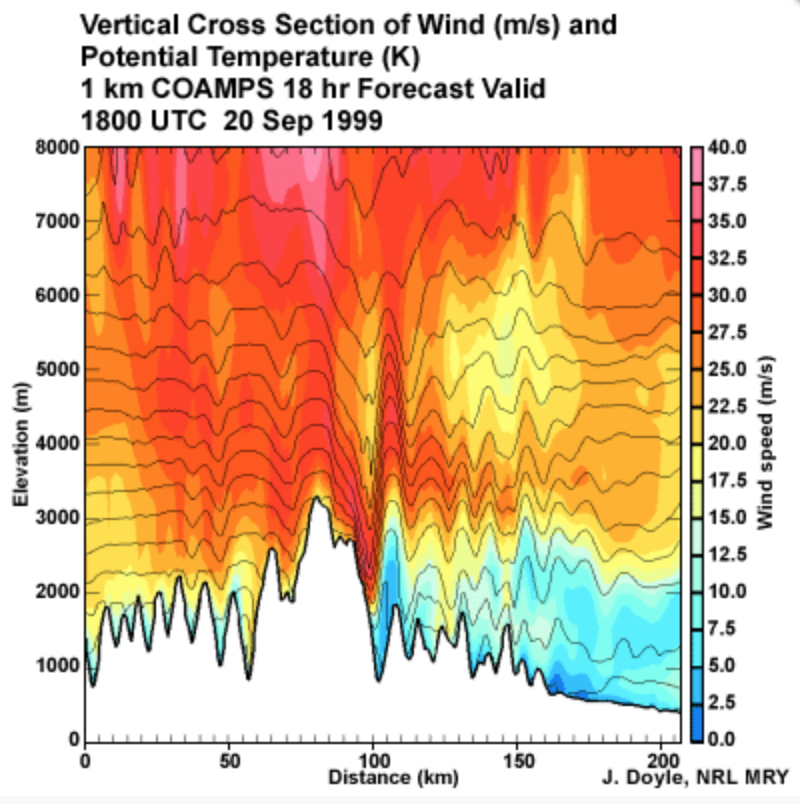
Note that this sounding forecast is for Boulder: the forecasted sounding a few miles upwind can look quite different! Especially in wave conditions you would expect the temperature profile to be differ whether you measure under the wave crest or in a wave trough! A detailed cross-section chart showing isotherms (lines of equal temperature) across the mountain range would illustrate that. Unfortunately, we rarely have such a chart available to us. An example of such a chart from a different location and date is here:
Also, keep in mind to check the forecasted winds and stability profile for different times of the flying day as conditions could change significantly for the better or worse.
- Where can I learn more?
A good source to dig deeper into the meteorology regarding waves and the forecasting of mountain waves is provided by The Comet(c) Program.