
On June 6 I published a “Beginner’s Guide to Scoring Well in the OLC Speed League“. This was – at least in part – written for myself as a guide for how to improve my own contribution. Now that the Speed League is over it is a good time to take stock and ask “How Did I Do?” and “What Have I Learned?”
Boulder Achieved 2nd Place World-Wide, Out of 1029 Clubs
First of all, credit is due to my club, the Soaring Society of Boulder (SSB). Out of 1029 participating soaring clubs competing in the World League, Boulder came in second place, beaten only by the outstanding team from the Minden Soaring Club. Boulder has been doing well in the Speed League for many years but this is the best result for the Soaring Society of Boulder since OLC was created.
After a 9th place finish in Round 1, Boulder took the overall lead in Round 2 and then managed to hold on to first place until Round 9 when the soaring gods unfortunately had nothing but rain in store along the Colorado Front Range. That gave Minden an opportunity to take the lead in Round 10, and Boulder was not able to catch back up.
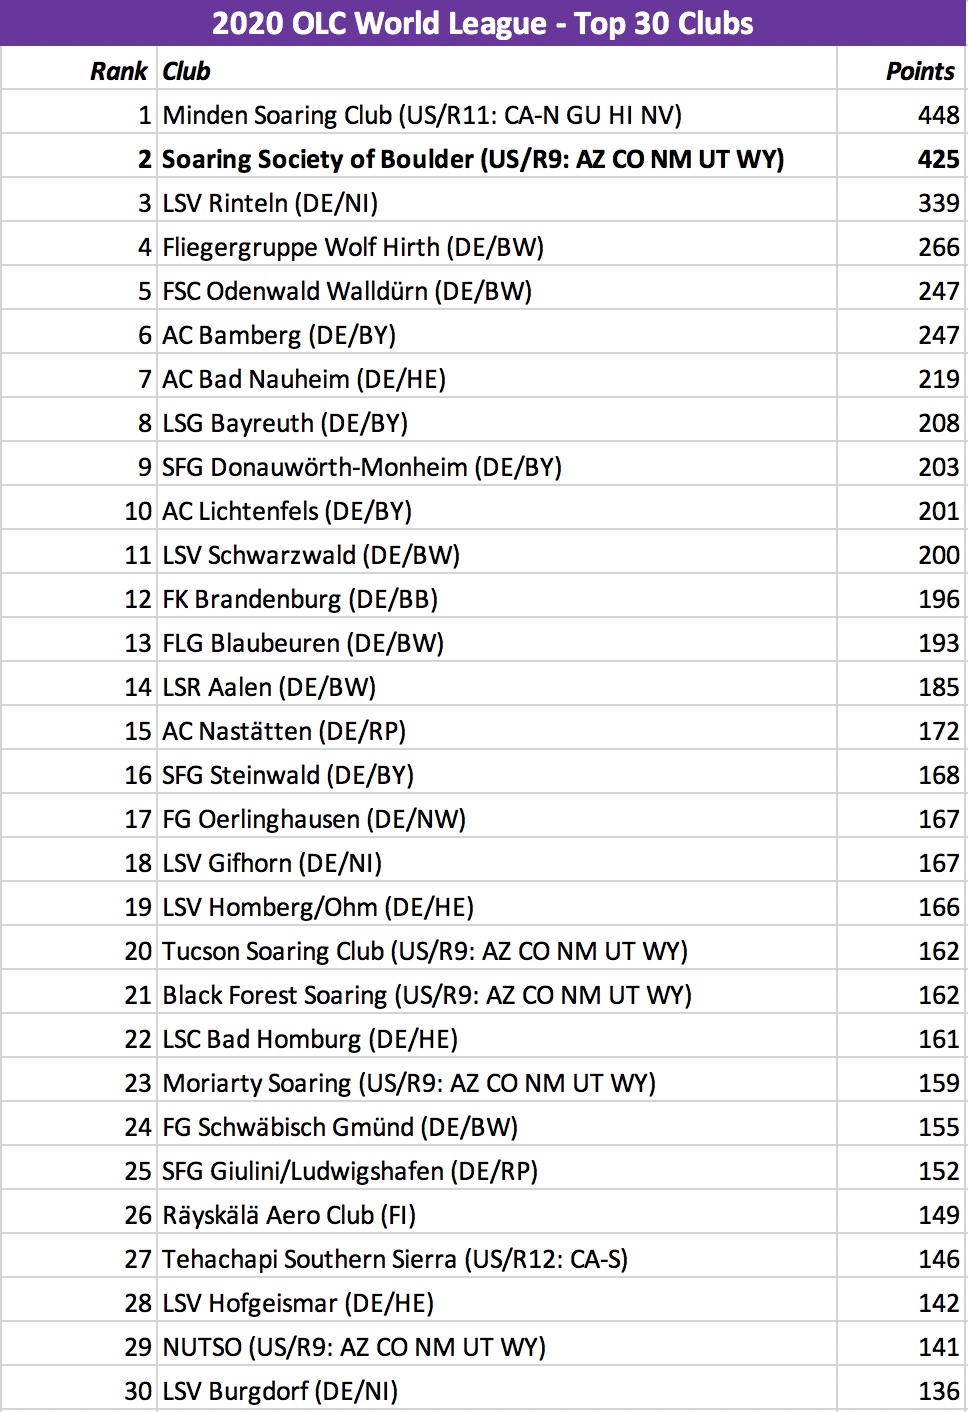
The following table ranks the top 30 clubs in the 2020 World League. The list includes 29 soaring clubs in Germany, seven in the western United States (Minden, Boulder, Tucson, Black Forest, Moriarty, Tehachapi, and Northern Utah), and one in Finland.
The full results can be found here. Boulder came also second in the US Gold League, likewise only beaten by Minden. The results are here.
How Did I Do?
One of my goals for the year was to make a significant contribution to SSB’s League Results. I wanted to measure this specifically by scoring among the top three SSB pilots on 10 of the 19 planned Speed League Weekends in 2020. (The top scores of three different pilots affiliated with a specific club count for the club’s overall results – hence my objective to be among the three pilots whose results get counted.)
The Covid pandemic caused a six week delay in the start of the Speed League and the League was shortened from 19 weeks to only 13 weeks. I therefore adjusted my goal accordingly to score among the top three Boulder pilots on seven of them.
I was able to fly on 10 of the 13 weekends. And I did achieve my goal of seven scores among the top three participants:
I had two first place results (Round 3 and Round 7), four second place results (Rounds 1, 2, 6 and 8) and one third place result (Round 4). In addition (not counted), I also came in second in the rained-out Round 9 when none of the Boulder pilots achieved a qualifying score (a minimum of 40 points).
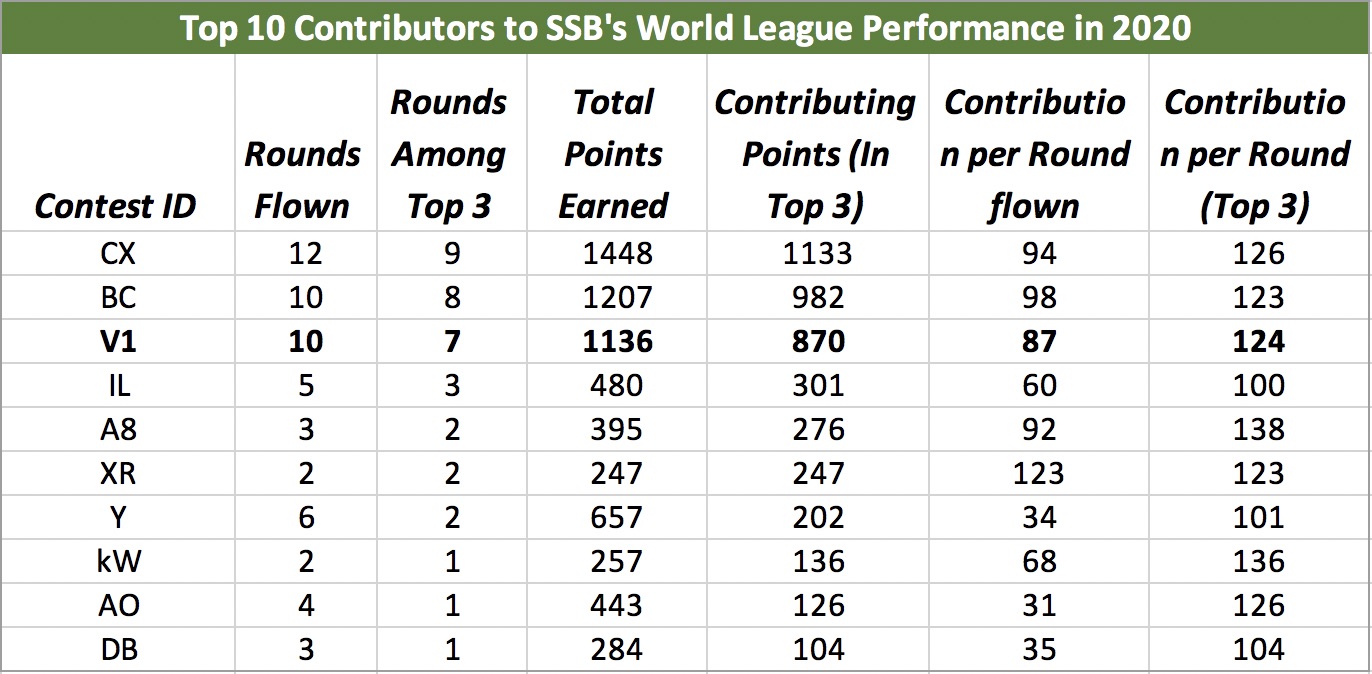
Over the course of the season, 24 individual Boulder pilots contributed to SSB’s overall team score. This is more than ever before and shows the breadth of SSB’s soaring talent. The following table lists the top 10 contributors sorted by their “Contributing Points”, i.e. the cumulative number of OLC Speed Points for those rounds when the pilot’s score was among the top 3 SSB results. By this metric, I was among the top three contributors of my club behind CX and BC.
Legend:
-
- “Rounds Flown” indicates the number of rounds that a particular pilot participated in and achieved a Speed League Score of at least 40 points. Only flights on Saturdays and Sundays during the 13 week long Speed-League Season count.
- “Rounds Among Top 3” indicates on how many weekends a pilot’s score was among the best three results; i.e. their score ultimately “counted” for SSB’s overall Speed League Score for that particular weekend.
- “Total Points Earned” is the cumulative number of Speed League Points a particular pilot earned for all their flights during the entire Speed League Season (remember, only flights on Saturdays and Sundays count).
- “Contributing Points (In Top 3)” is the cumulative number of Speed League Points of a particular pilot for those weekends when their flight was among the top 3 SSB results. Note: if a pilot would score among the top 3 pilots on every one of the weekend that they flew, their number of Contributing Points would be equal to their number of Points Earned. The fact that only one pilot scored among the top 3 on every weekend they flew (XR) underscores the breadth of overall team member participation.
- “Contribution Per Round Flown” simply divides the “Contributing Points” of a pilot by the total number of rounds that they participated in.
- “Contribution Per Round (Top 3)” divides the “Contributing Points” by the number of rounds when they scored among the top 3 SSB pilots, i.e. the number of rounds when their results counted.
Given that this has only been my third cross-country season I am definitely happy with my result. However, the point of this analysis is not to congratulate myself but to determine how I can improve going forward.
What Did I Learn?
I took a close look at eight speed league weekends when there were enough comparable flights to assess my performance against that of other pilots. Why only 8 instead of the 10 that I participated in? I removed the Speed League weekend when I flew from Nephi because my flight would not be comparable to those flying from Boulder. And I removed one weekend when I broke off my flight after 90 minutes due to thunderstorms. (Speed League Scoring is based on the best 2 1/2 hours, and my 90 minute flight would not have been comparable.)
To ensure a good dataset, my analysis only includes flights flown from Boulder and only flights flown on the same days that I was flying. My objective was to do an “apples to apples” analysis of specific flights, not a comprehensive analysis of all SSB Speed League Flights! (E.g., None of John Seaborn’s winning speed league scores are included because they were not flown from Boulder. Also excluded are flights by any pilot on days that I did not fly at all. )
The following table shows a summary of key stats from the best 2 1/2 hour flight segments that are automatically selected by OLC.
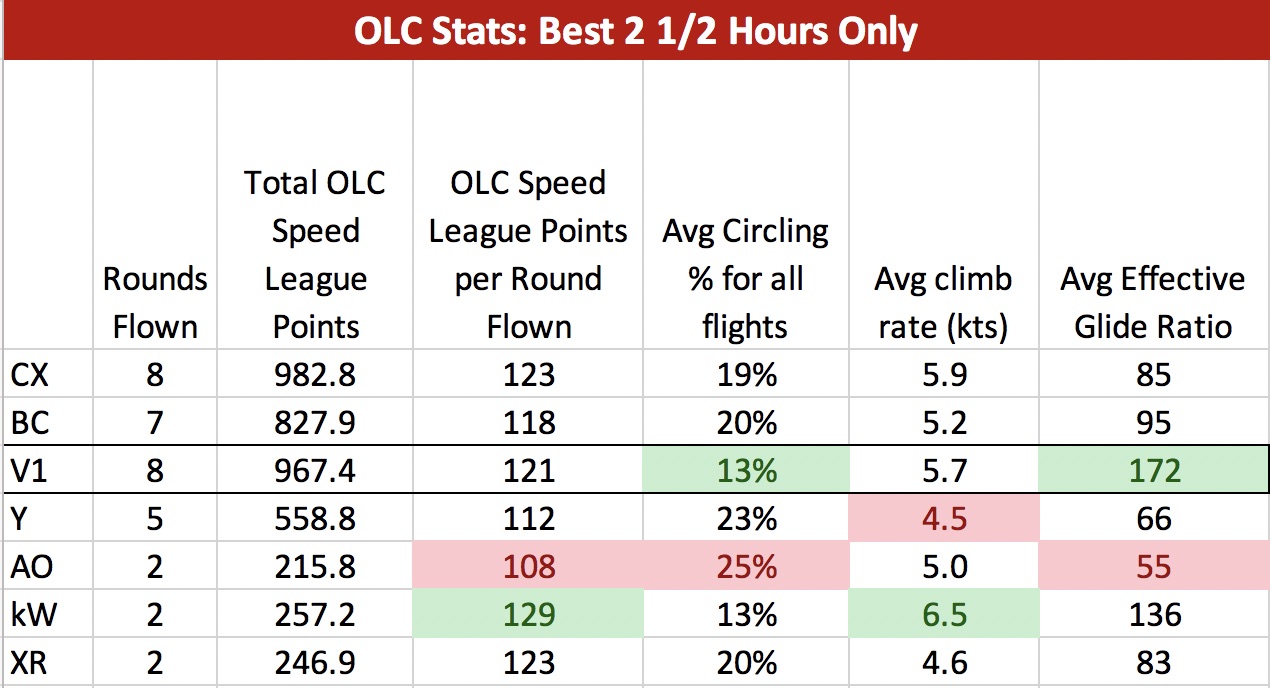
Before we dive into the data, it is important to note that only the results of CX and BX are truly comparable to my own (V1) because only CX and BC flew on almost all of the days that I was flying. (Y flew on 5 of the 8 days that I flew; AO, kW, and XR only flew on 2 of the 8 days that I flew. It any of them wanted to draw conclusions about their relative performance it would be better to only look at flights on the days that they flew instead, and not at the aggregate results across rounds that they did not participate in.)
With that caveat out of the way, what do the data actually tell?
First, they show that I (V1) had the lowest circling percentage of any pilot at only 13% and the Highest Effective Glide Ratio of 172:1. This is indicative of a certain flying style that prioritizes staying in rising air and – probably – flying relatively slowly, and possibly also accepting significant course deviations.
I already noticed the same tendency in my race analysis of the Nephi Practice Day on July 1. There, too, did I have the lowest circling percentage and the highest effective glide ratio in cruise flight.
Unfortunately, as I pointed out in the aforementioned article, circling percentage and effective glide ratio are both composite metrics that are not only based on a pilot’s ability to follow energy lines, but are also a function of a pilot’s inter-thermal cruise speed. To truly understand a pilot’s ability to follow energy lines we must look at the average “netto” value while in cruise flight because this metric is independent of a pilot’s chosen flying speed.
Unfortunately, the OLC flight analysis does not provide the netto value.
Second, the table above shows that my 5.7 kt average climb rate in thermals was fairly competitive as well. Only CX climbed a bit better at 5.9 kt average, and kW had an outstanding average climb rate on one of his two flights resulting in an average of 6.5 kt.
Based on the flight stats that OLC provides it is impossible to tell why my average League Points per flight trailed the performances of CX, kW, and XR.
Multiple possible reasons come to mind:
-
- Sub-optimal cruise speed between thermals (possibly too slow)
- More course deviations than other pilots
- Too much time lost in thermal tries
- Other factors
Unfortunately, OLC does not provide any data to gain insights into these potential factors.
In search for more answers, I turned to See You’s flight analysis software from Naviter. However, See You cannot isolate the best 2 1/2 hour OLC Speed League Segment and so it is necessary to examine the entire flight instead. This may not be too bad except that pilots tend to disregard competitive considerations once they have exhausted their 4 speed league segments. E.g., in Boulder it is not uncommon for pilots to loose many thousands of feet of altitude at the end of their flight by deliberately following lines of sink instead of lines of lift. Or they simply pull out the spoilers to lose excess altitude. Needless to say, such actions distort any performance analysis. In addition, Boulder is notorious for difficult climbs at the beginning of a flight until the pilot is “connected” with the upper level lift band. Pilots who get “stuck” early in their flight often spend an hour or more in weak lift trying to climb out while others take a higher tow and find good lift straight away. These factors also distort the analysis. It would therefore be much better to isolate the speed league segments only and be able to analyze the flying performance just for the part of the flight that actually “counts”.
So everything from here on must be viewed with these caveats in mind.
Circling Performance
As we’ve seen above, I only circled 13% of the time during the Speed League segments of my flight. The relative impact of my circling performance is therefore lower than it would be if thermaling had accounted for a larger proportion of my flights.
The following table compares my circling performance to that of the other pilots flying on the same eight days.
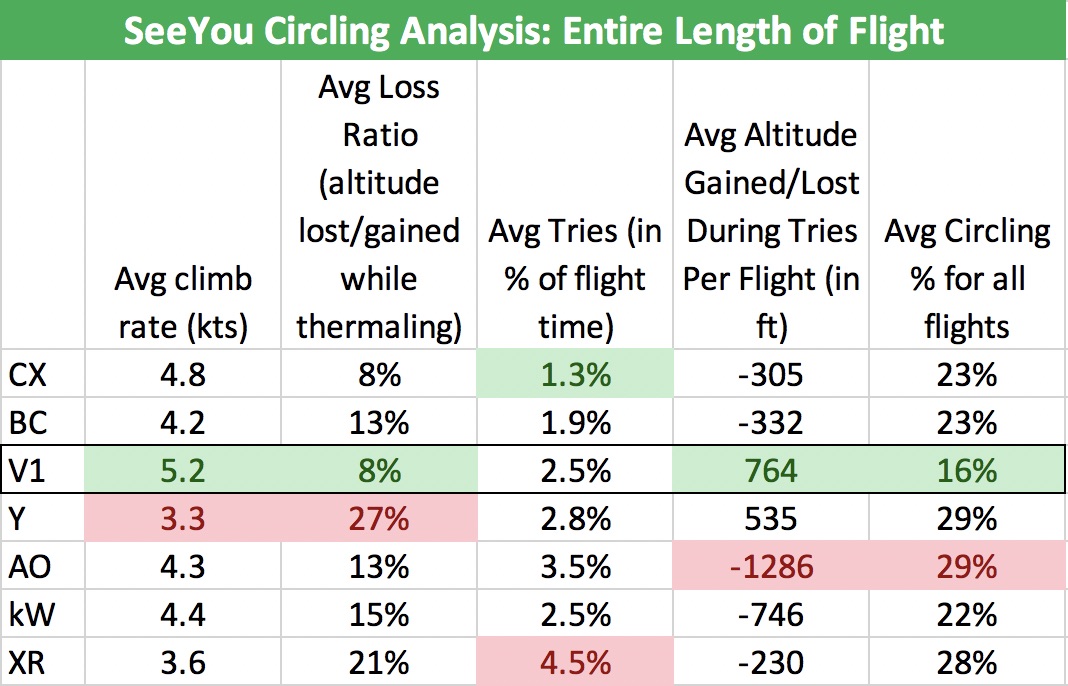
Interestingly, my average circling percentage only goes up from 13% to 16% if I look at the entirety of my flights. This is somewhat surprising because it includes the initial climb-out phase, and suggests that I was on average lucky to find good thermals soon after releasing from tow.
Most of the other metrics also show favorable results for V1.
-
- My average climb rate is shown as being the highest of all pilots. I do not put all too much stock in this metric though because this metric can be easily distorted by several factors. I already mentioned the initial climb out when it is fairly common to spend 30-60 minutes or even more in very weak lift (1 kt or even less) before getting into “good air” on the west side of the Front Range convergence. Another potential distortion can occur when a pilot deliberately circles to lose altitude prior to landing. See You will treat this just like thermaling and the result is that the data unfortunately becomes useless for comparison purposes.
- I calculated the “Average Loss Ratio” in thermals as the ratio of altitude lost compared to altitude gained while thermaling. I think of this as a metric of effective thermal centering: the lower the loss ratio, the better the thermals are centered because the glider is in lift most of the time while circling. The data shows that only CX had an equally low loss ratio in thermals. (However, the caveats mentioned above apply here as well.)
- “Average Tries” measures how much time during the flight gets wasted by trying out (and ultimately rejecting) thermals. See You uses 45 seconds as the “cut off” time; i.e. if the pilot circles for less than 45 seconds before moving ahead on course this is deemed to be a “try”. At 2.5% my “Average Tries” percentage might be a bit higher than I think it should be. CX spent only half as much time trying out thermals. However, I’m not sure what value is ideal. At first glance it would seem that the lower the better, but a very low tries percentage could also suggest that a pilot is not rejecting enough weak thermals. (This would show up as a low average climb rate, which is certainly not the case for CX.)
- “Average Altitude Gained/Lost During Tries” subtracts altitude losses from altitude gains during tries and calculates an average value per flight. I was a little surprised to see that the value was overall positive for my tries which suggests that I rejected weak climbs but that I did not lose altitude during these tries in aggregate. Most other pilots did lose more altitude than they gained during their tries.
Overall, I’m not sure that the Circling Performance Analysis provides strong indicators that would suggest specific improvement opportunities. Cutting my “tries” percentage may help but only if it doesn’t lead me to reject really good thermals as well.
I believe there exist are other improvement opportunities for me but they are not specifically suggested by the data. E.g., I believe I could achieve better climb rates by tightening my circles, and flying slower in thermals. But to see this I would need to be able to compare my orbit times and ground speed in thermals to that of other pilots, especially in correlation to effective climb rates achieved. I also believe that I can further improve my aileron/rudder coordination in thermaling flight.
Cruise Performance
If the thermaling analysis is somewhat inconclusive in terms of identifying improvement opportunities, maybe more can be gleaned from an analysis of the cruise flight segments. Let’s look at the table below.
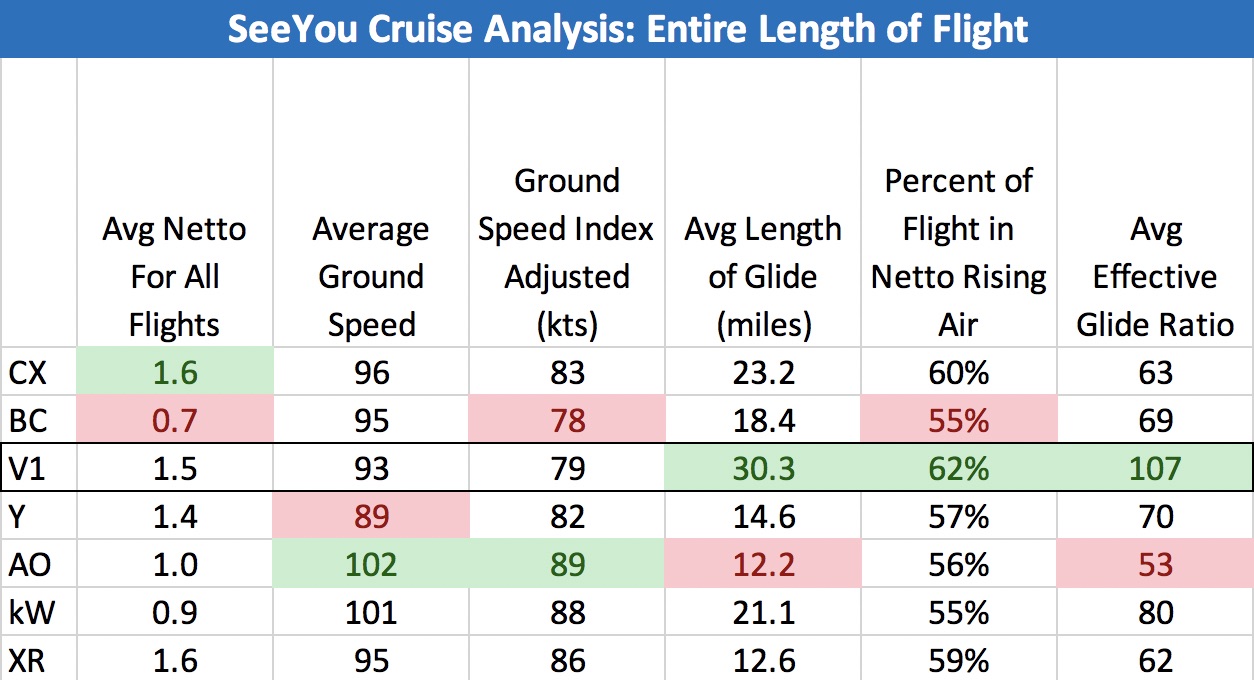
The first thing that jumped out to me is that my Average Effective Glide Ratio is still by far the best of any pilot (not surprising given that I also had the lowest circling percentage – which really is just the mirror image of this metric), but that my netto value is not as high as that of CX and XR.
As I mentioned before, netto is a much better metric to look at than effective glide ratio or thermaling percentage because it much better isolates a pilot’s ability to follow energy line.
A difference of 0.1 kt is certainly not a huge negative but it adds up, especially if one spends most of the time cruising! Consider this: since my thermaling percentage is only 16%, I spend 84% of my flight time in cruise flight. In other words: in aggregate, I cruise more than 5x longer than I circle (84/16=5.2). So, when the cruise percentage is that high, over the duration of an entire flight a 0.1 kt vertical speed difference while cruising is approx. equivalent to a 0.5 kt vertical speed difference while climbing! Looked at this way, it’s definitely not irrelevant.
On the other hand, the data set is not large enough to draw any conclusions. Following energy lines is as much an art as it is a science and the location and strength of energy lines is so variable that an analysis of just eight OLC flights (where each pilot flies at different locations and at different times within a very wide area) is certainly limited with respect to assessing skills of improvement opportunities.
What we can say from the data, however, is that the effective glide ratio is likely very significantly impacted by the average cruise speed: CX had the best netto value (1.6 vs 1.5 for V1) but his average effective glide ratio was significantly worse than mine (63 vs 107). The main difference is most likely CX’s higher average cruise speed (83 kts vs 79 kts after adjusting for the glider’s index). The higher cruise speed resulted in a higher sink rate during cruise, therefore a lower effective glide ratio, and hence more time spent circling. Still, CX had the overall better performance so it is likely that his combination of flying speed and climb rate in thermals gave him an overall edge.
Another possible explanation for the difference in performance is the percentage of course deviations. This seems such an obvious potential differentiator that one would think that the flight analysis software would provide this metric! Unfortunately this is not the case and there is no practical way to compare the extent of course deviations over eight flights manually.
Conclusion
Unfortunately, the insights gained from a detailed analysis of eight Speed League Flights are inconclusive with respect to truly understanding the performance differences and identifying specific areas for improvement.
The data suggest that my strengths include the ability to follow energy lines and centering thermals. This is also consistent with my findings in Nephi. These are core skills that have a very significant impact on overall performance and are key pillars of my current performance.
In addition to further honing these strengths, I believe I can further improve in the following areas. However, better flight analysis tools would be needed to confirm that these are more than “hunches”:
Thermaling:
-
- Better use of the full height band (increase in average climb height per thermal) / more selective in accepting thermals
- Tighter circling (shorter orbit times – aim for around 25-27 seconds when ballasted, less without ballast.)
- Slower orbiting speed (e.g. stall speed for the applicable bank angle and wing loading plus ~2 kts)
- Further improvement in aileron/rudder coordination
Tries:
-
- Slightly reduce number of tries (but don’t aim for zero!)
Cruise:
-
- Increased cruise speed, even when flying in lift along energy lines, with more aggressive pull ups in strong lift
- Possibly reduce course deviations (need to be able to measure)
Appendix
Opportunities for Providers of Flight Analysis Software – Especially for OLC!
To perform a more insightful analysis of OLC flights, a software would have to be able to isolate the portion of the flight that is scored by OLC. I.e., for Speed League Scores it would be necessary to specifically analyze the performance during the 2 1/2 hour Speed League segment (maximum of four legs as defined by OLC rules). For OLC plus flights, the relevant six legs would need to be isolated, again, based on the same rules that OLC applies. Once that is accomplished, the software would have to be able to calculate the following key data points:
Thermalling:
-
- Average climb rate in thermals; (ideally also the median climb rate)
- Circling Percentage
- % time spent in weak / medium / strong thermals (e.g. <2.5 kts; 2.5-5 kts; >5 kts). This is of interest because time spent in weak thermals is the #1 speed killer.
- Average orbit time in thermals – a measure of how close one is able to fly to the core
- Average speed while circling in thermals (air speed or ground speed) – in conjunction with orbit time another key metric to measure one’s ability to stay close to the core
- Number of thermals
- Average height gain per thermal – this is important to understand how much of the lift band one is able to exploit; greater height gain means fewer thermals, which fewer centering losses
- Loss ratio (altitude lost / altitude gained while thermaling) – a measure for one’s ability to center thermals and keep them centered
Isolate Tries from Thermals and from Cruise:
-
- % time in tries
- Number of tries
- Altitude gain – altitude loss in tries
Cruise:
-
- % time in cruise flight
- Netto during cruise flight only (excluding thermals and in thermal tries)
- % course deviation (i.e. actual course track flown / scoring distance)
- % time in netto rising air, and ideally also:
- % time in weak / medium / strong lift (e.g. <2.5 kts; 2.5-5 kts; >5 kts)
- % time in weak / medium / strong sink (e.g. <2.5 kts; 2.5-5 kts; >5 kts)
- Average cruise distance between thermals (excluding tries)
- Effective glide ratio (but this has mostly entertainment value)
OLC already has an enormous repository of flight data and would be in an excellent position to provide these analysis tools. Introducing such tools as a subscription offering could also be a revenue opportunity for OLC. Such a tool could allow pilots to benchmark their flights against those of others who flew in the same area on the same day. I believe this would be a highly valuable add on and many pilots would be willing to pay extra for such insights.
Introducing such a tool could also pave the way for additional “big data” analyses of OLC flight traces. The opportunities to provide deep insights are enormous. E.g., flight traces could be used to create “heat maps” of “house thermals” or other highly active thermal areas. Frequently flown XC routes could be identified similar to how Strava shows routes that are frequented by runners or bicyclists. Anyone who’s exploring a new area, taking a soaring vacation, or just simply planning cross country flights would find huge value in such tools.
It would be easy to anonymize the data that is being used for such analyses such that data privacy considerations can be addressed.
Unfortunately OLC is not (yet) taking advantage of its data repository. Worse, by limiting flight trace downloads to 20 per day it even prevents soaring pilots from exploiting this treasure trove of data on their own. There’s a tremendous opportunity to create real value for the soaring community. I hope someone will!
Hi Clemens
Thanks a lot for sharing your thoughts and ideas in your magnificient blog.
It is quite easy to get SeeYou to do the analysis of just a part of your igc file, as you are requesting. You can do it in two ways:
1. The simple one. Make a selection by using the “Graph View” and set 1’st and 2’nd marker by using the cursor and right click. You can see the analysis of this selection on the “Statistics View” page by selecting the “Selection” tab. This method is usefull if you want to analyze shorter selections of your flight.
2. The complete: Open the flight and create a task using the coordinates given by OLC as start/finish and waypoints. Once you have entered the task, Seeyou will analyze your flight just as if you had declared the task before takeoff.
Best Regards
Anders Mølgaard
Hi Anders, many thanks for your reply, and sorry for my delayed response! I’ll definitely try that. The “simple one” seems more practical to me than the “the complete”. The issue with OLC flights is that each pilot is free to choose what “task” they fly during the flight and you would therefore need to create separate tasks for each pilot during each flight. E.g., to apply this for my analysis for an entire OLC flying season at only one airfield, I would have to manually create about >100 tasks based on individual flight traces. It would be much better if See You were able to create those “tasks” automatically based on OLC rules. (Btw – my Oudie – running SeeYou Mobile – tells me after the flight the six leg flight distance that OLC will credit for OLC plus, so the software automatically calculates this already. It should not be difficult to make this available in the See You desktop software. and to also create an algorithm that does the same thing for the 2 1/2 hour speed league segment.) Thanks again!
Great analysis.
However, in my stats please realize I have no interest in the speed league. My flying is specific to cross country and has very little comparison to speed/local/time limited speed runs. I fly for distance and turn point goals that often do not whatsoever correlate with weather phenomena that would allow for speed, efficiency, or convenience. For this it may be best and appreciated if you exclude my stats from your baseline. My stats only show up in this category by chance and a rare occasion I take my trace from a certified logger. I think it’s nice that a few pilots go after this OLC speed league. Great job and keep up the speed.
TZ
XR