Note: in the initial publication of this article I made a mistake when extracting data points from the JS3 polar curve. Thanks to Matthew Scutter for pointing this out to me. This error has been corrected below.
The published performance data from Jonkers Sailplanes and Schempp-Hirth, suggest a very significant performance advantages of the JS3 over the Ventus 2cxT.
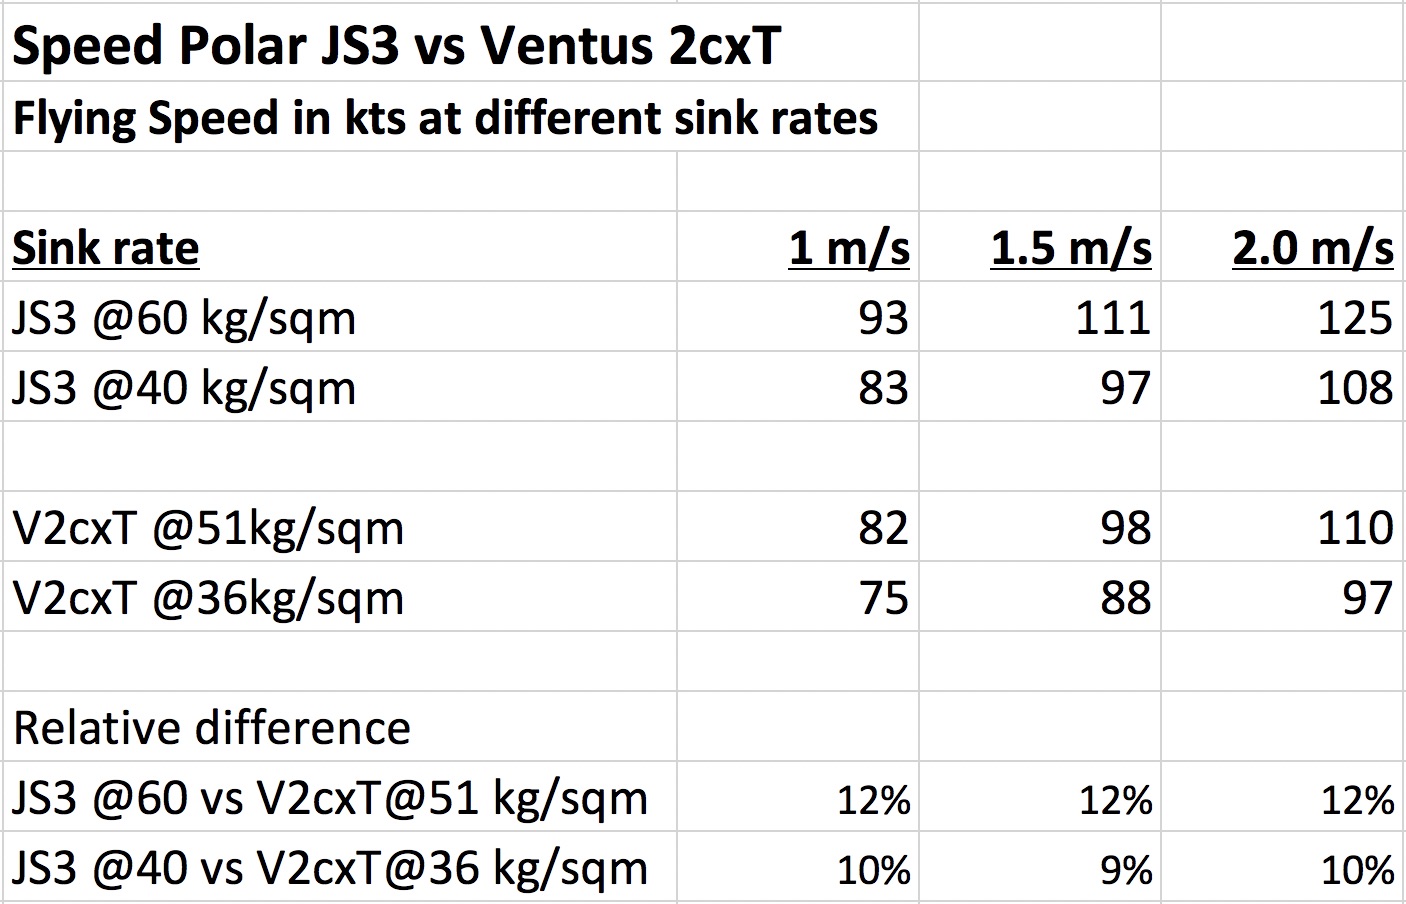
The data suggest that a ballasted JS 3 flies 12% faster than a ballasted Ventus 2cT at a wing-loading of 51 kg/sqm. Unballasted, the JS3 is shown to be 9-10% faster than an unballasted Ventus 2cxT. (All data shown are for 18m configuration.)
However, one complication is that ballasted (or unballasted) the wing loading for the two gliders is different.
Let’s try to create a more “apples to apples” comparison by comparing the published performance figures at equal wing loading. To do that we have to estimate the values for the JS3 at a wing loading of 51kg/sqm and that of the Ventus 2cxT at 40kg/sqm. (To create the estimate I assumed that the attainable speed at a given sink rate for each of the gliders increases linearly with additional wing loading. This methodology is probably not exactly accurate but any other plausible method would yield almost identical results.)
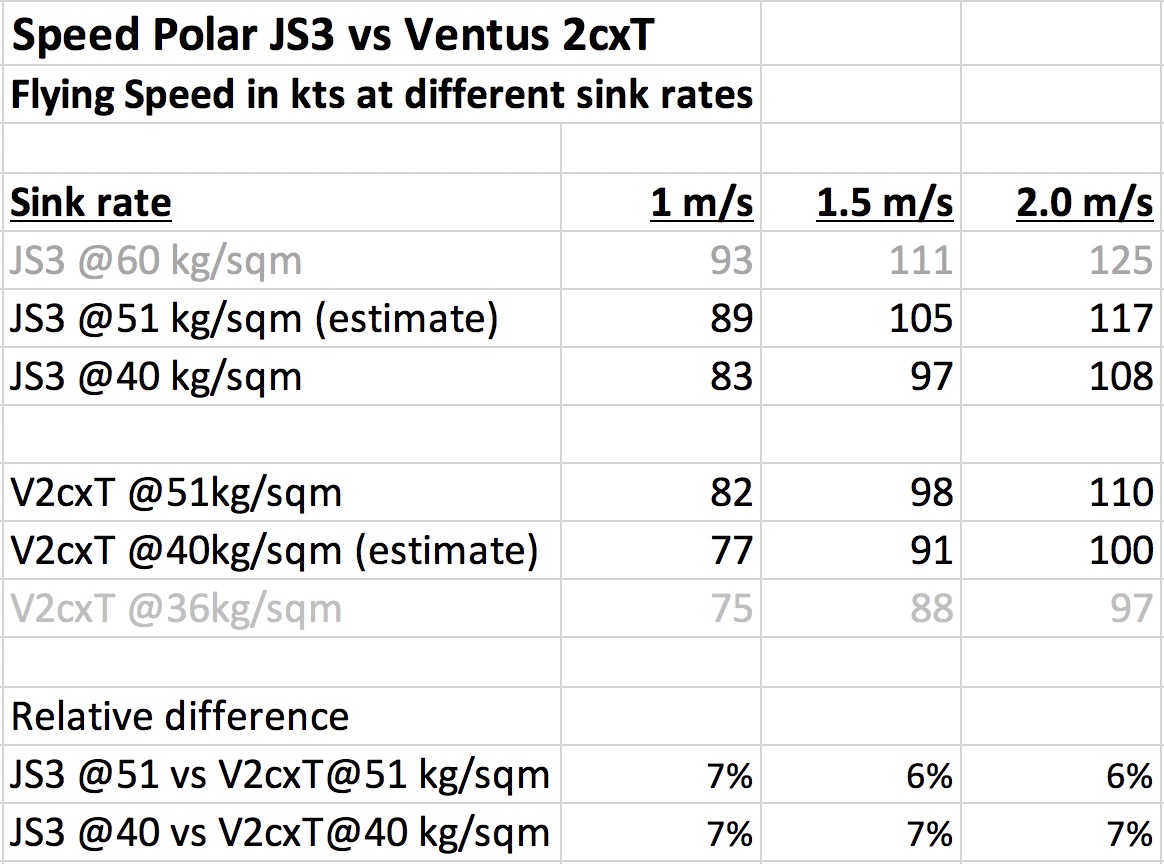
The table shows that even at equal wing loading the polar data still suggest a performance difference of 6-7% for the JS3.
[Side Note: per the manufacturer flight manual my Ventus 2cxT has a maximum all-up mass of 600kg (1323 lb) and is not limited to 565kg (1246 lb) as the polar curve suggests. I.e., the maximum permissible wing loading is 54.4 kg/sqm and not just 51 kg/sqm. ]
Do those data points hold up in reality?
A little while ago I wrote about a Practice Race Day in Nephi on July 1. One aspect that I did not give much attention was the difference in glider performance between John Seaborn’s JS3 and my Ventus 2cxT. John and I flew the last 92.7 km (57.6 miles) within just three minutes of each other, which makes the results directly comparable.
I took a closer look at our flight traces to see how well my Ventus 2cxT held up against John’s JS3. As a multiple National Champion John is unquestionably the better pilot, so we should expect John’s final glide to be at least 6-7% faster than mine if the published glider performance data are true AND if we flew with identical wing loading. (Both of us flew with 18 meter configurations.)
I was flying with approx. 80 liter of water ballast that day, which means my wing loading was right around 10 lbs/sqft (49 kg/sqm), very close to the 51 kg/sqm that Schempp-Hirth uses for their published polar curve.
I do not know how much ballast John had on board (although I do know that he flew with water that day) but I think it is likely that his JS3 was at or close to maximum gross weight, which would mean a wing loading of more than 12 lbs/sqft (close to 60 kg/sqm). At full wingloading his JS3 should be about 12% faster than my Ventus.
Is this true? Let’s see!
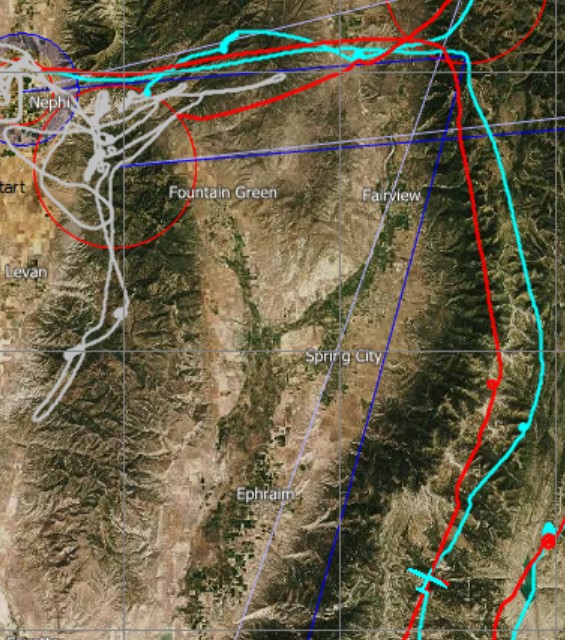
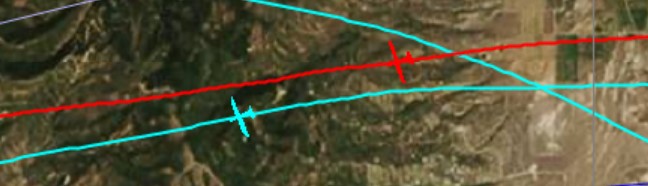
My flight trace is shown in red, and John’s is shown in blue. Note that at this “starting point” John was exactly 3:00 minutes behind me. My red glider is shown at 16:11:41 local time. John reached the same spot (the location of his blue glider) at 16:14:41 local time.
What makes this flight so comparable is that we reached this location not only within 3 minutes of one another but also almost exactly at the same altitude. In fact, I was at 16,428 ft MSL and John was at 16,508 ft, i.e., only 82 feet higher.
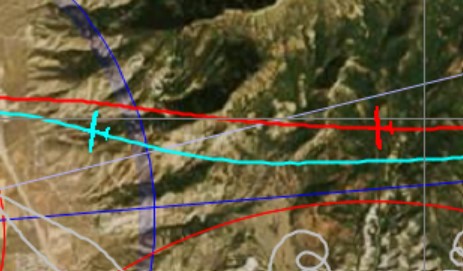
Let’s take a look at our positions exactly 5 minutes later. I.e., my location as shown is at 16:16:41, and John’s position is shown exactly three minutes later, at 16:19:41.
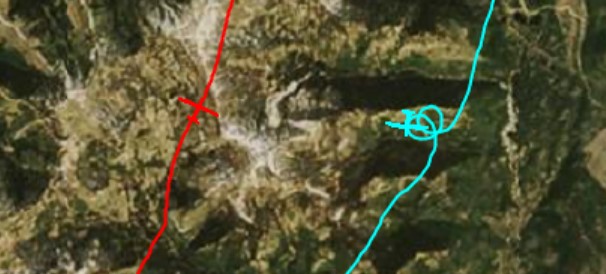
We’re still neck to neck although John took a slightly more easterly line. John also flew a little faster than me during his cruise, thereby losing more altitude, and decided to make two extra circles in good lift (where he gained 700 feet of altitude). At 16:19:41 he was 270 degrees into his first circle. My altitude was 16,672 and John’s was 16,494. I.e., I was now 178 ft higher than John.
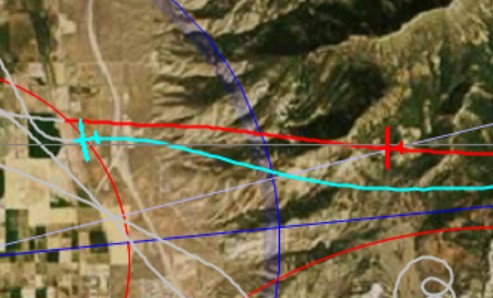
Let’s wind the clock forward another five minutes, i.e. 10 minutes into the glide):
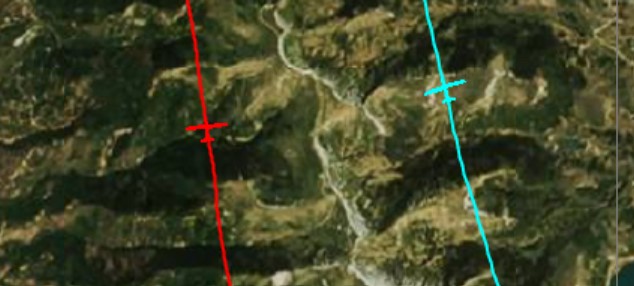
There is still hardly any visible difference in terms of our location. Since the prior position I had taken one pointless turn which netted absolutely no change in altitude. John’s 700 ft altitude gain in his two circles is now reflected in a positive altitude difference between our gliders of 675 ft: I am at 15,639 ft and John is at 16,314 ft.
Purists may say that the true final glide only starts here since neither of us stopped to climb from this position until the finish.
Let’s jump ahead another five minutes. We’re now 15 minutes into the glide:
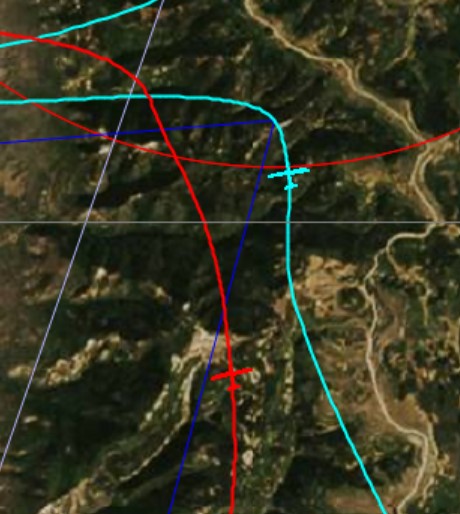
John took advantage of his positive altitude difference and flew significantly faster than I did. He is now almost exactly 2 miles (3.2 km) ahead of me and about to enter the final turn point. At our flying speeds this means that John is now almost exactly one minute ahead. However, John’s higher speed came at the price of 1000 ft of additional altitude lost over the past five minutes: while he was previously 675 higher, he is now 371 ft lower. I’m now at 14,697 and John is at 14,326.
Once, again, let’s jump another five minutes ahead. We’re now 20 minutes into the glide:
John is still approx. 2 miles ahead. I have put the nose down with the finish in sight and am more rapidly losing altitude. At such very high speeds there is a steep price to pay for flying with less than maximum wing loading. I am now at 12,010 feet and John is now almost 300 feet higher at 12,308 ft.
There is still just over five minutes to go, so let’s jump to the last checkpoint before the finish. We’re now 25 minutes into the glide:
John expanded his lead to 3 miles (5 km). He’s been flying close to Vne and is now also dropping altitude more quickly. John’s altitude is now 9,365 ft and I am now almost 1000 ft higher at 10,327 ft.
It’s now obvious that John is clearly ahead and I can’t do anything to catch up. Let’s look at the finish line:
John is crossing the finish at 16:40:11 at an altitude of 9,221 ft. My position is shown at 16:37:11 (exactly 3 minutes earlier to maintain the same 3:00 minute difference that we have started out with). I’m still exactly 3 miles (5 km) behind and at 9,983 ft.
I will cross the finish line at 16:38:30 at an altitude of 9,671 ft.
John’s 93km glide took him a total of 25 minutes and 30 seconds, and mine tool 26 minutes and 49 seconds. In other words, the entire final glide took me 1 minute and 19 seconds longer than it took John. The difference of 1 minute and 19 seconds is 5.1% (79 seconds / 1530 seconds).
5.1% is quite significant but it is clearly less than the published polar curves suggest, especially if John flew close to maximum wing loading.
In addition we can see that John also lost 532 ft more altitude than I did during the final glide (John lost 7287 ft whereas I lost 6755 ft).
It would be tempting to say that at John’s average climb rate of 490 fpm for the entire flight, it would have taken him 1 minute and 5 seconds to gain that 532 ft of altitude and the net advantage of his JS3 on final glide was therefore only 14 seconds (1:19 minus 1:05 minutes) – i.e. only 0.9% (14/1530 seconds).
However, such an argument – while mathematically correct – would miss the point that flying faster at a speed that would have resulted in an additional loss of 532 feet would not have allowed me to reduce my finishing time difference from 1:19 minutes to just 14 seconds. The reason is that the speed polar drops off quite steeply at such high speeds. A better way to save time would have been for me to just not do that one pointless exploratory turn. This one turn cost me 50 seconds and netted no altitude gain at all. Omitting this turn alone would have reduced my finishing gap from 1:19 to 29 seconds.
In summary I can say that my Ventus 2cxT held up quite well against John’s JS3. In other words, it confirms that John’s superior performance over the entire flight has much more to do with pilot skill (e.g. during John’s only turn during the glide he gained 700 feet in 70 seconds compared to my 0 ft gain in 50 seconds) than with any performance advantage that his JS3 may have over my Ventus 2cxT. This also is confirmed by my prior analysis of all other aspects of this flight.
Clearly, this analysis is just based on one flight and not under “laboratory” conditions. It is not scientifically valid because not all variables were “held equal.” We did fly three minutes apart and it is possible (tough doubtful) that the conditions were more favorable three minutes earlier. We also took a slightly different line above the Wasatch Plateau and I might have gotten lucky. But I doubt it. I’m fairly confident that the performance difference between the two gliders is exaggerated. If anyone wants to do the performance analysis for themselves, the flight traces can be found here: John Seaborn’s trace and Clemens Ceipek’s trace.
For another perspective, have a look at Tim’s video, where he poses and answers the question “Can a 1987 Ventus cT keep up with a 2018 JS3 Rapture? Almost!”
Hi Gerard, thanks! Yes, I watched that video. Fun! And this is the original Ventus not the Ventus 2.
5% faster average Speed for the JS3 is realistic and something I came up with from my experience in several competitions. Have flown also the Ventus 2CXM, now Ventus 3
I remember that flight. I was just stooging arount waiting for Tim to catch up (which he didn’t) 🙂
That’s not really the way to fly fast on the ridge.
XB
Quantifying these small differences accurately is hard, especially given the uncertainties involved. I much appreciate your grass roots analysis nonetheless. It resonates with my engineering mindset. I’ve had similar such discussions over here. They never go over well with purists. Purists prefer to dismiss all empirical calculations with handwaving that some minute difference hasn’t been sufficiently accounted for and the manufacturer quoted performance is gospel. I’m sure with enough back-to-back comparisons like this you will quantify exactly whether the difference is worth 5.1%, 12%, or some other number statistically but it’s not worth it… nor are discussions with purists. I think the conclusion is that differences in pilot skills (or decision making) are on par with differences due to glider performance. A similar explanation was given by John Cochrane in the intro to his SAA webinar “Just a little bit faster please”. Continue focusing on improving your pilot skills overall. Clemens, your efforts and blog are helping me in that regard enormously. Nice job on the videos, blog, and recent interview with Chuck. Thank you! Keep it up!
Thanks Taylor. Yes, as John pointed out to me the only way you could really compare the performances is to fly both gliders in totally still air wingtip to wingtip. That said, I think we all agree that manufacturers have a big incentive to show major improvements in the polar curve from one glider generation to the next. Which means it might have become impossible to build gliders where the reality matches the marketing claims. I agree with you that pilot skill is much more important than glider performance. But if a glider were truly 12% faster across the speed range it would take a lot of pilot skill to overcome the difference. (Btw – Another way to look at this is to consider the OLC handicaps. There the JS3 has a handicap of 119 and my Ventus has a handicap of 118. This assumes a performance difference of less than 1% overall, and not 12%. )
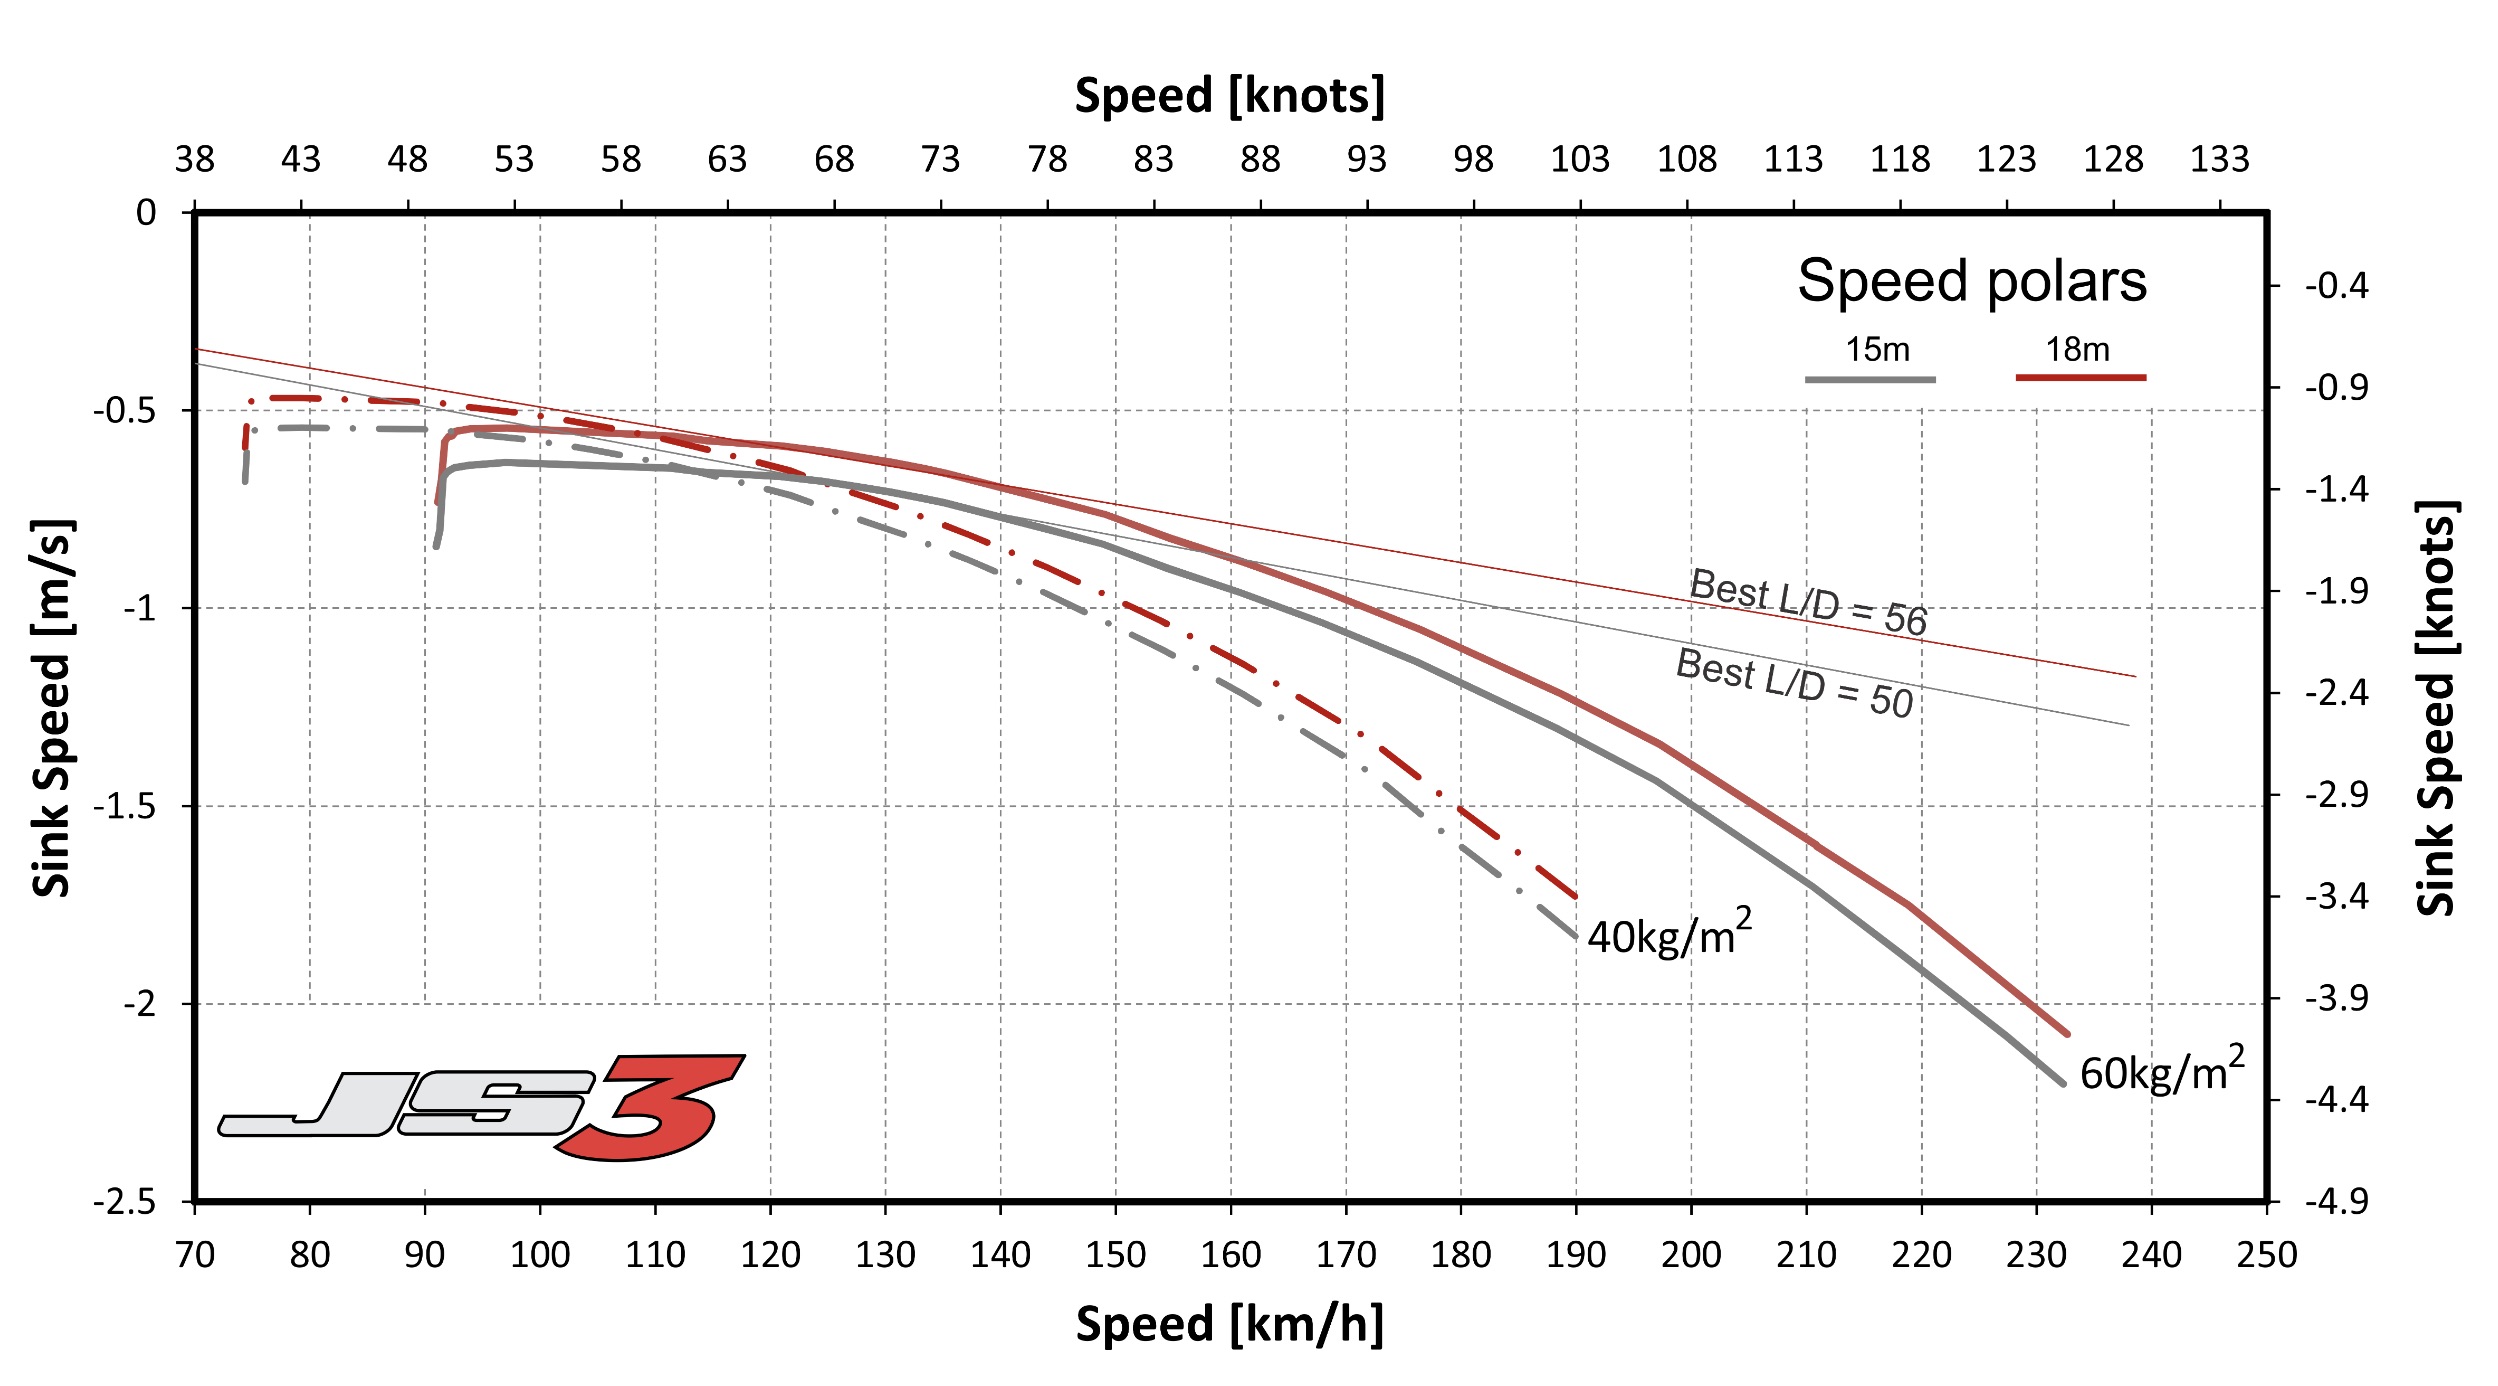
I’d treat the published JS3 polars that are linked to with a great deal of suspicion.
For starters, the extra span in 18m configuration is going to have the greatest benefit at low speeds. The sink rate benefit shown is about the same over the 15M version at all speeds.
The v2cxT linked seems very realistic and also shows it has been optimised for the low speed end. The high speed end is nothing to get excited about and is progressively worse than the DLR tested original Ventus A 15m at the same flying weight although substantially better at low speeds, as expected from a 18m glider vs 15m.
The JS3 cleans up a number of little things to get a small performance increase. It is undoubtedly a good glider but it is getting difficult to see where further improvement is going to come from.
BTW a typical Irving (two hole) 1/4″ diameter TE probe is about 0.4% of total drag on an 18M glider at 600 Kg and 100 KIAS.
I’m working on that.
Hi Mike, that resonates with me too. I had expected that the performance advantage of the JS3 would be somewhat significant at high speeds and almost negligible at slow speeds. And it would be greater the higher the wing loading. The good thing is that I think I got a pretty good deal with the V2. I probably get 95-99% of the performance (depending on conditions) for half the price. I won’t win a world championship with it but neither would I do that with a JS3 or any other glider. 😉
As I’ve spent most of my time in lower performance club gliders, I’m curious on your perspective on this question: If you take a glider like the JS3 with 15 and 18m tip options, how does the flying/handling experience differ under identical conditions when flying the 15 vs 18
Hi Jeff, I’ve never flown a JS3 so I can’t say specifically. Generally, 15m tips make a glider a bit more agile (faster roll rate – helpful when ridge soaring or generally when flying close to mountainous terrain) but the glide performance and climb rate is not quite as good than with the 18m tips. In very strong conditions when everyone flies at high speeds and with high wingloadings, 15m gliders tend to hold up fairly well against 18m. In weak conditions the advantages of 18m are more pronounced. When scores are handicapped (e.g. on OLC or in Sports Class contests) many pilots will prefer to fly with shorter tips in strong conditions to get the benefit of the handicap. The polar curves of the same glider with different tips and at different wing loadings should give you a good sense of the performance difference.
I think the Akaflieg polar tests carried out recently proved the JS3 polar was superior to that published Mike.
That said I do agree that newer generation sailplanes like the JS3/Ventus3/AS33 need very good pilots to show their incremental performance improvements.