A Declared 1111.1 km FAI Triangle Raises the Question: What Else is Possible in Colorado?

On July 8, 2025 I completed a flight that set new Colorado State Records for Longest Declared FAI Triangle (1111.1 km distance) and for Longest Free FAI Triangle (1159 km distance). And also a new record for fastest speed around a 1000+ km declared triangle.

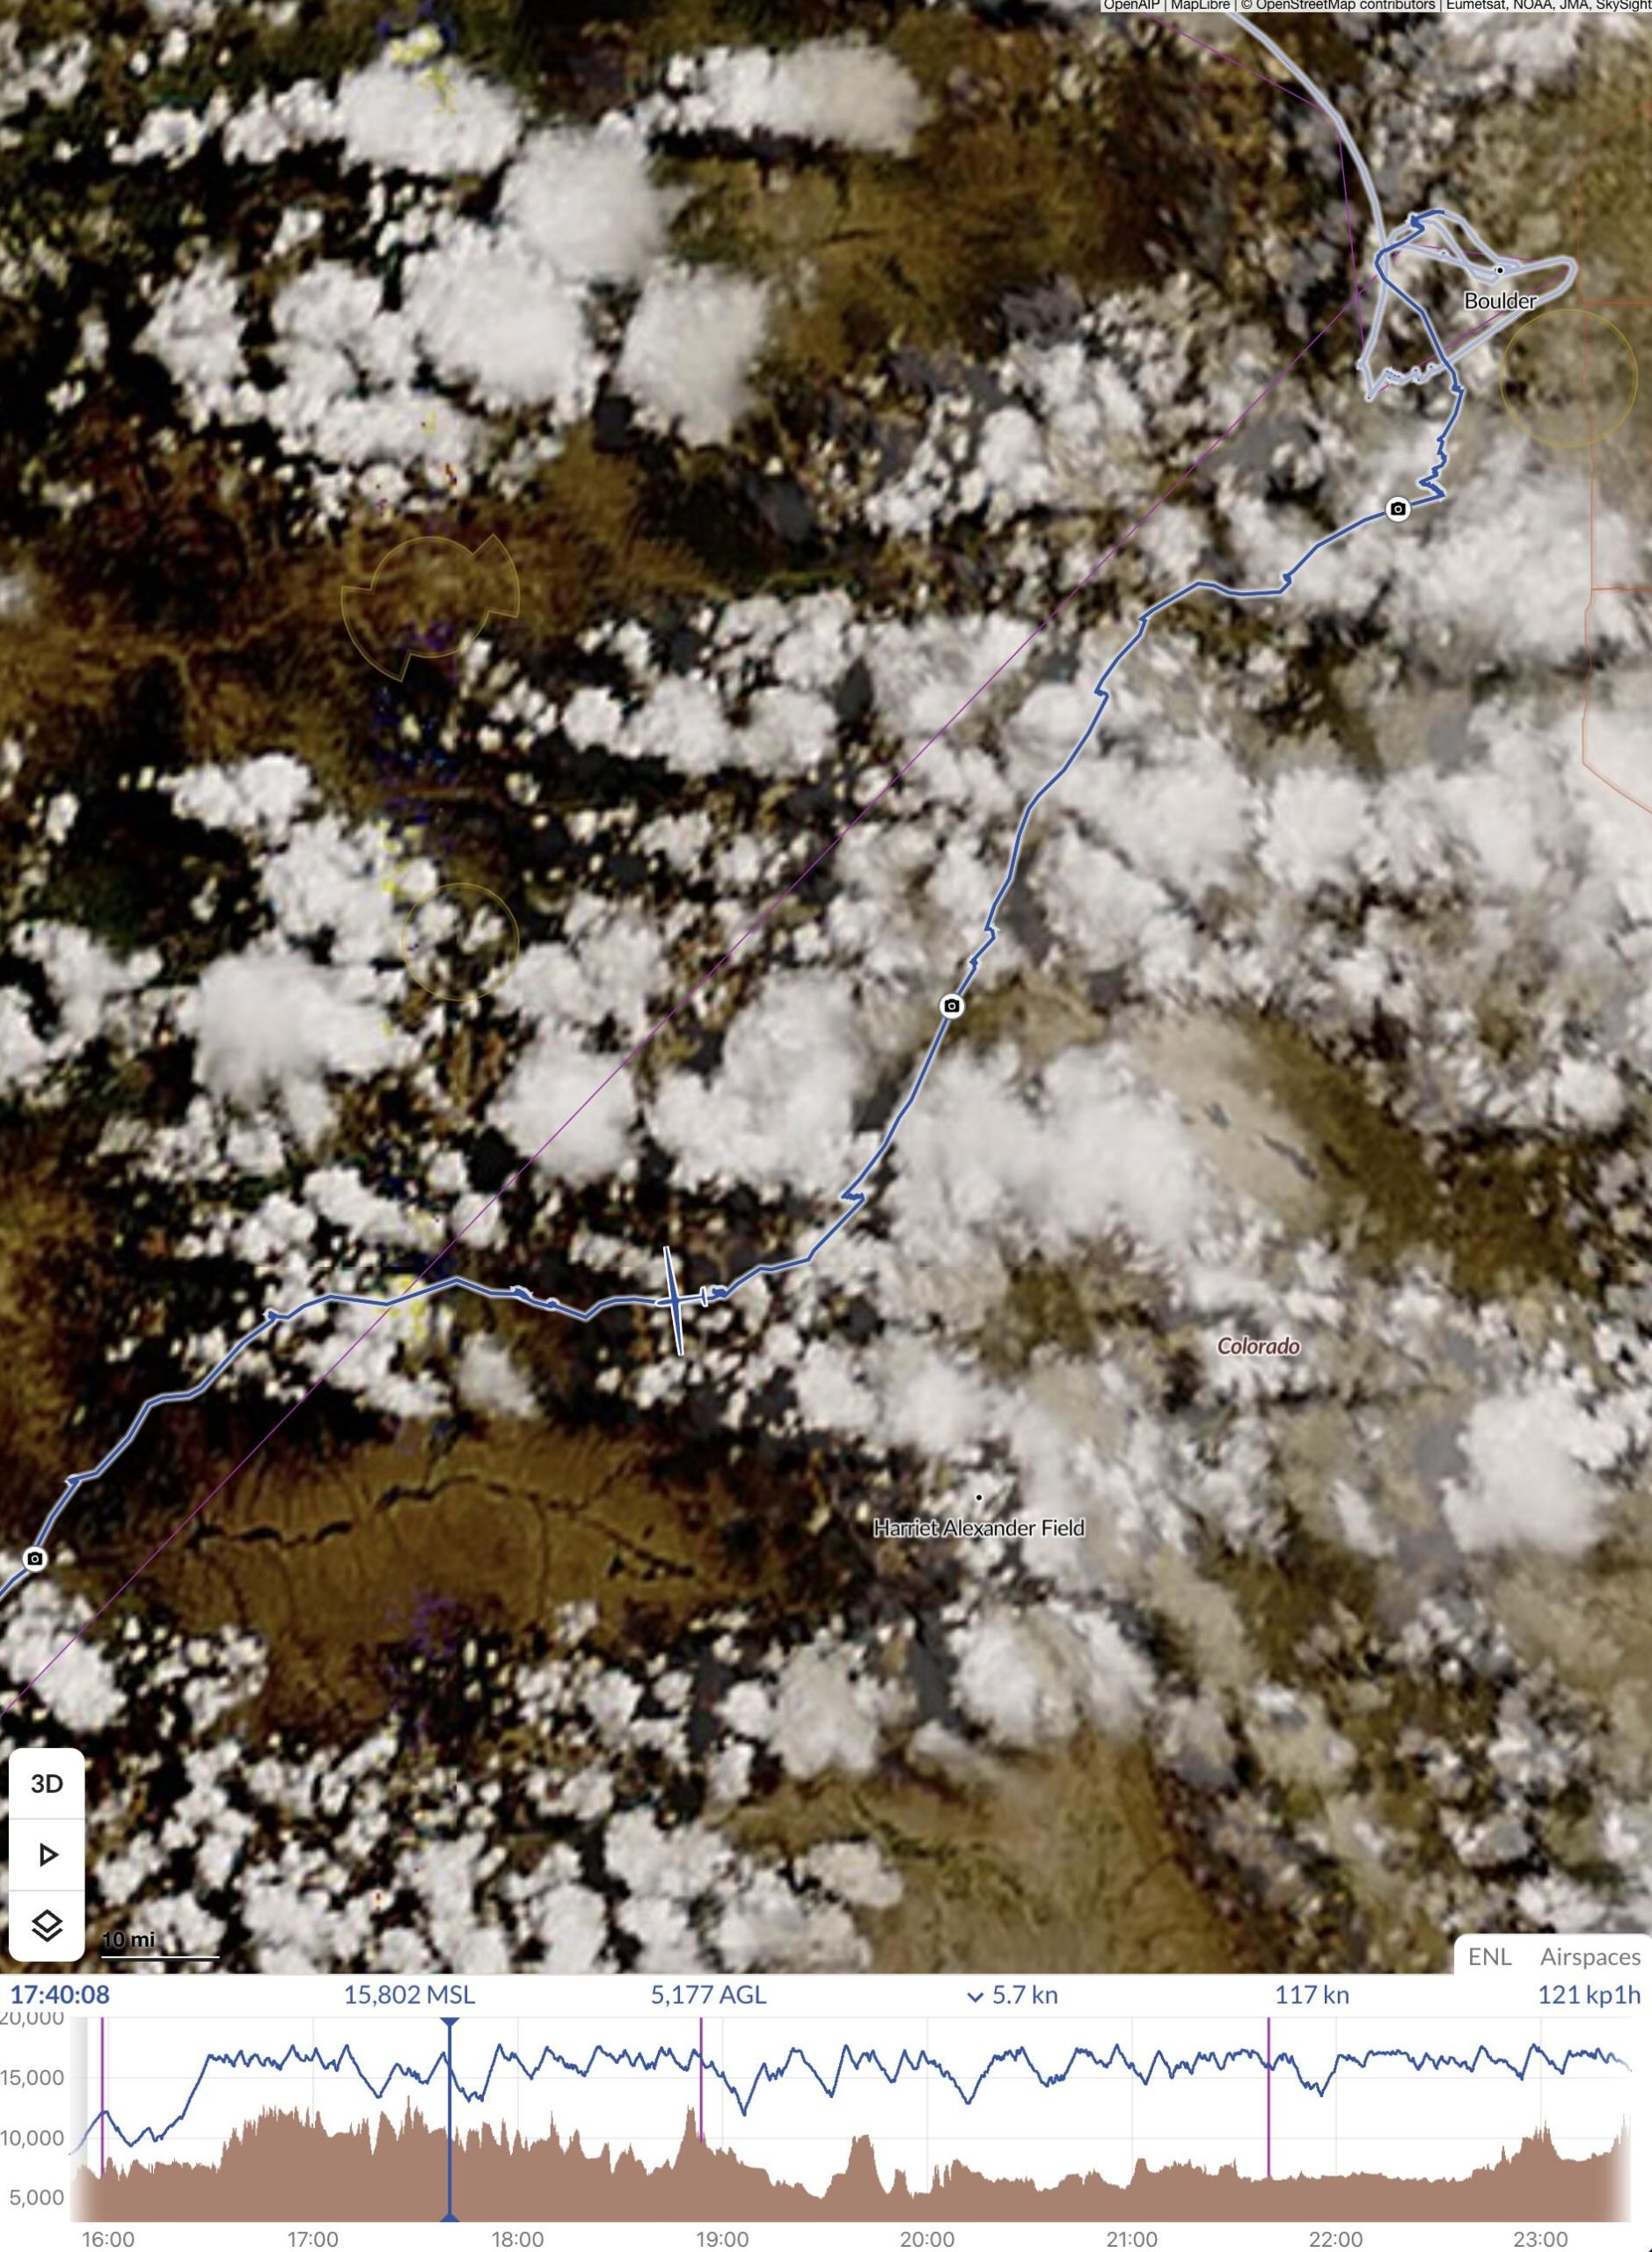
The flight trace can be found here: https://www.weglide.org/flight/637007

It’s only the second time a declared 1000 km FAI Triangle has been achieved in Colorado.  (The prior one was “just” 1001 km.  You can read up on it here.)

Long distance flights in the mountains (especially big declared triangles) don’t just require strong soaring conditions (e.g. good lift, nice clouds to mark it, not too much wind).  That’s just a given.  In addition, you need a day that starts early and lasts until late – ideally all the way to sunset.  In Colorado, such days tend to be very rare. Usually thermals are either late to develop (such that you must delay the start), or they develop early, and then the day blows up prematurely with widespread virga, showers, and thunderstorms. Big Triangles (or very long Out and Returns) require an early start, a late finish, and everywhere in-between must work as well.

That’s where precise task planning helps tremendously.  In decades past, this was basically impossible due to the lack of sufficiently reliable weather tools.  But thanks to the increasing power and precision of the latest weather models, we can now much better anticipate how a day will develop along any specific route we might consider. Then we can pick a task that is optimally aligned with the forecast, along the entire track throughout the day.

In this article, I’ll first explain the methodology I use to plan such flights followed by a detailed report about this particular flight. There I will also illustrate how my preparations helped me keep going when things got challenging. Finally, I will conclude with some reflections about what may be possible now that we have much better weather tools available than ever before.

Flight Preparation (for thermal flights)

The flight preparation shown below may look quite time consuming.  But with some practice it goes rather fast.  Using the methodology described, it takes me not more than 10-15 minutes to plan a flight.  Because the flight on July 8 involved a record attempt I was extra thorough and spent about 20-25 minutes on it.

I usually watch the forecast a few days in advance to identify the best day(s).  Then I prepare a general plan the night before the flight, and I update this plan in the morning based on the latest weather models as they become available.

Note: the following flight preparation process is focused on thermal soaring conditions only.  Flights in wave conditions require a different methodology.

Step 1: Picking a Suitable Day for a Potential Record Attempt

With the right weather forecasting tools (I mainly use Skysight but other tools are improving too) it is now relatively easy to pick potentially suitable days.  For me, the best and fastest starting point to pick suitable days is the Potential Flight Distance (PFD) Chart.

If the PFD Chart shows your task area looking mainly red (as below) you might have a winner and should investigate further.

Skysight’s PFD Chart for July 8 2025 for Colorado (and adjacent states) shows tremendous potential in a very wide area. Boulder is located in the center towards the right, just to the left of the Denver Class B airspace, which is easy to locate on the map above.

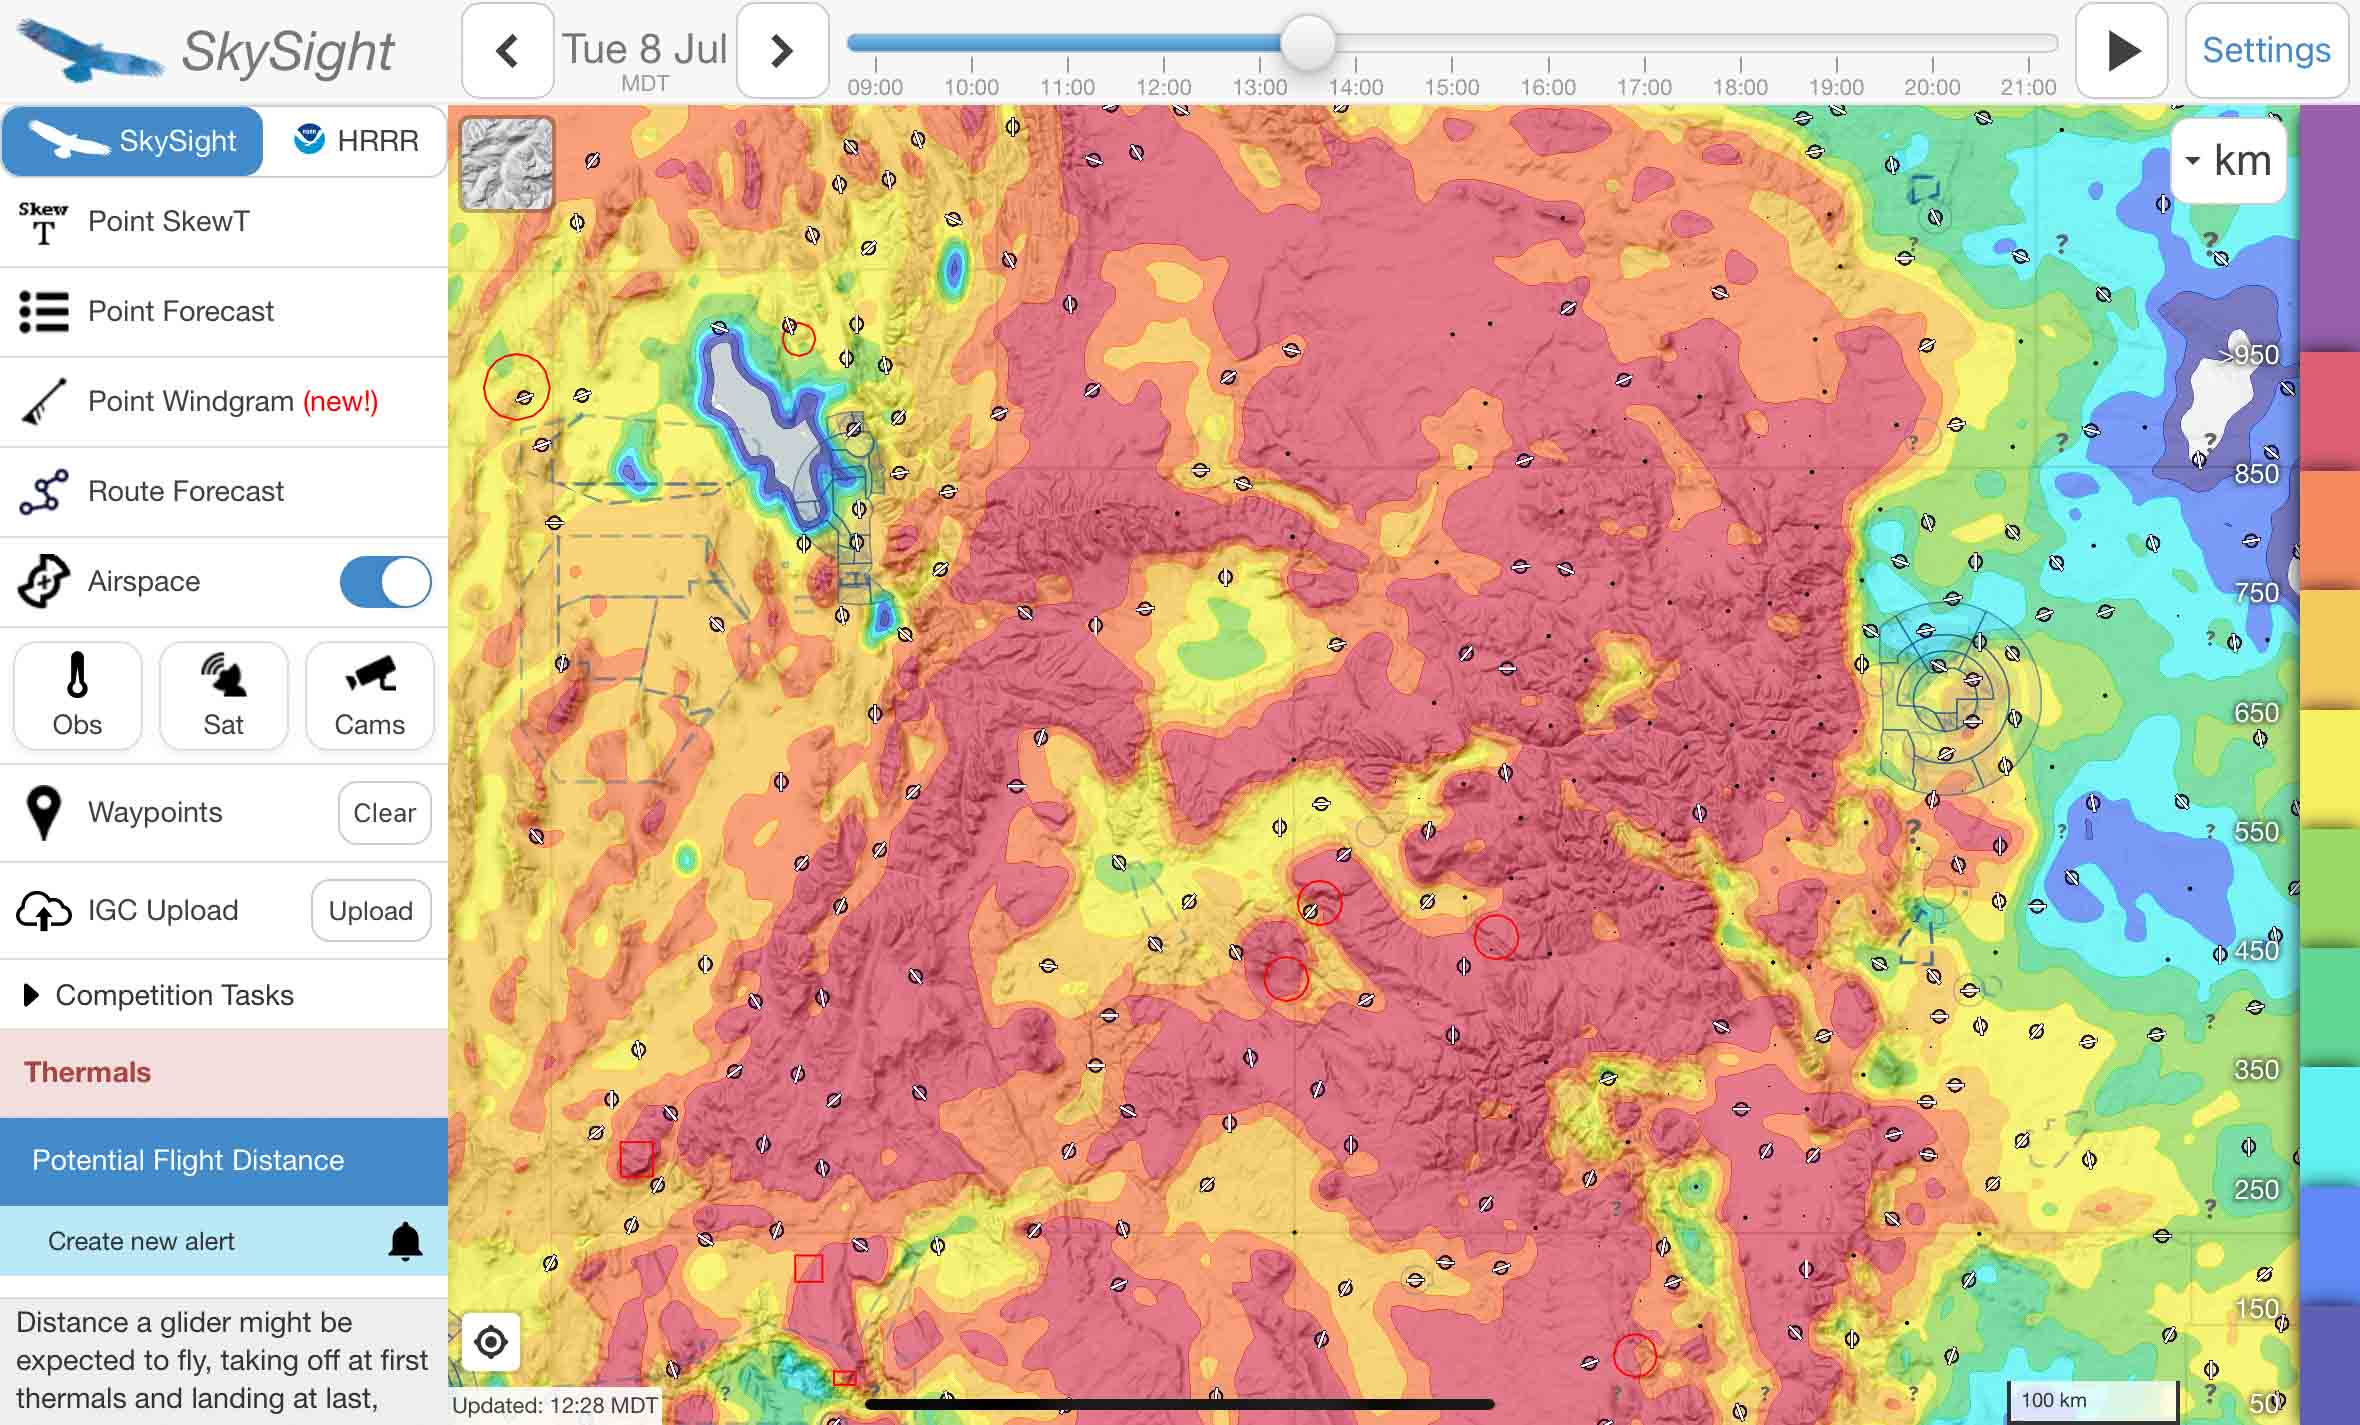
Why even investigate further?  If the chart shows that you can fly long distances pretty much anywhere isn’t this all we need to know?  Not quite!  One important reason is that weather models don’t account for the unique hazards of a particular soaring area.  E.g., if thermals are good and forecast to last all day, the chart may look red even if there is no cloud in the sky and thermal heights are capped by an inversion at 15,000 ft.  Is a Big Flight possible under such conditions?  Possible, yes, but flying in the blue over totally unlandable terrain without airport in glide would not be exactly safe.

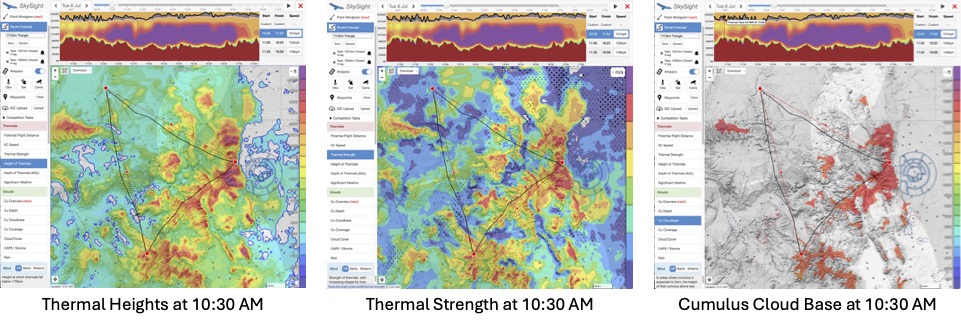
So I look for three additional things in my preliminary investigation before I decide whether I want to go on a long soaring adventure: thermal heights (which in Colorado should ideally go up to 18,000 ft or more), thermal strength, and cumulus cloud bases. In each case, I highly recommend playing with the time slider so you can see when thermal development will kick in, how high thermals will go, and whether there are “holes” that can spell trouble – especially towards mid to late afternoon and close to home.

If these things all look good, you have a potential winner.

Here’s what  these charts looked like for Tuesday, July 8:

Skysight showed Thermal Heights of 16,000 – 17,000 ft within a few miles of the Boulder airport as early as 10am.  Heights would increase to more than 20,000 feet during the day across almost the entire potential task area, and rapidly diminish by 7PM. This suggests a 9 hour long strong soaring day from 10AM to 7PM.
The Thermal Strength forecast confirms that thermals would start to be usable as early as 10AM near Boulder. They were expected to be very strong throughout the task area through most of the day, and would quickly end by 7PM.
Even better, Cumulus Clouds were forecast to develop in much of the task area. By 10AM they would already mark the thermals near the launch point in Boulder. By 3PM they would be widespread. And by 7PM they would still mark the remaining thermals.

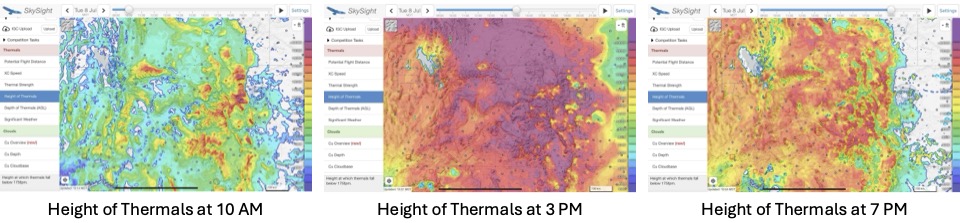
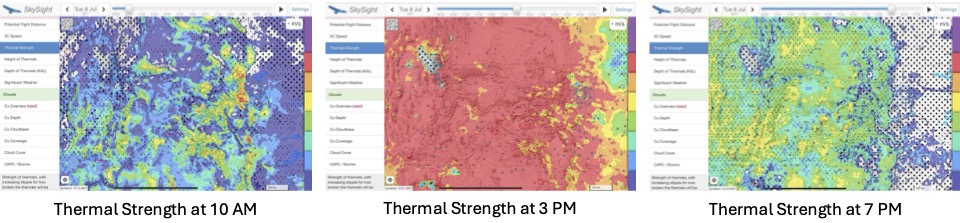
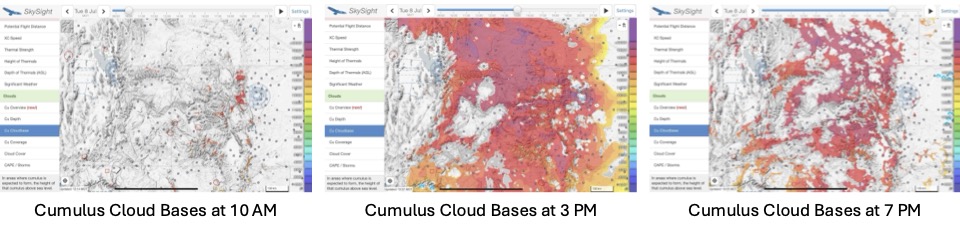
Tuesday, July 8 definitely looked like it would be a winner.

Step 2: Planning a Task

Whatever your home base, certain routes are flown over and over again.  On average, these tend to be good and fast routes because they follow frequently forming energy lines.  But just because these routes tend to be good on average, this does not automatically mean that they are also the best routes on the day of your flight.

The conventional wisdom associated with such routes can also lead to unwarranted orthodoxies or tabus that can consciously or subconsciously constrain your ambition.  E.g., I’ve heard people say “don’t go to Wyoming, it’s always windy there”; or “avoid the plains, the best lift is always over the mountains”.  These rules of thumb have merit – on average – but you should not automatically assume they are true on the day of your flight.

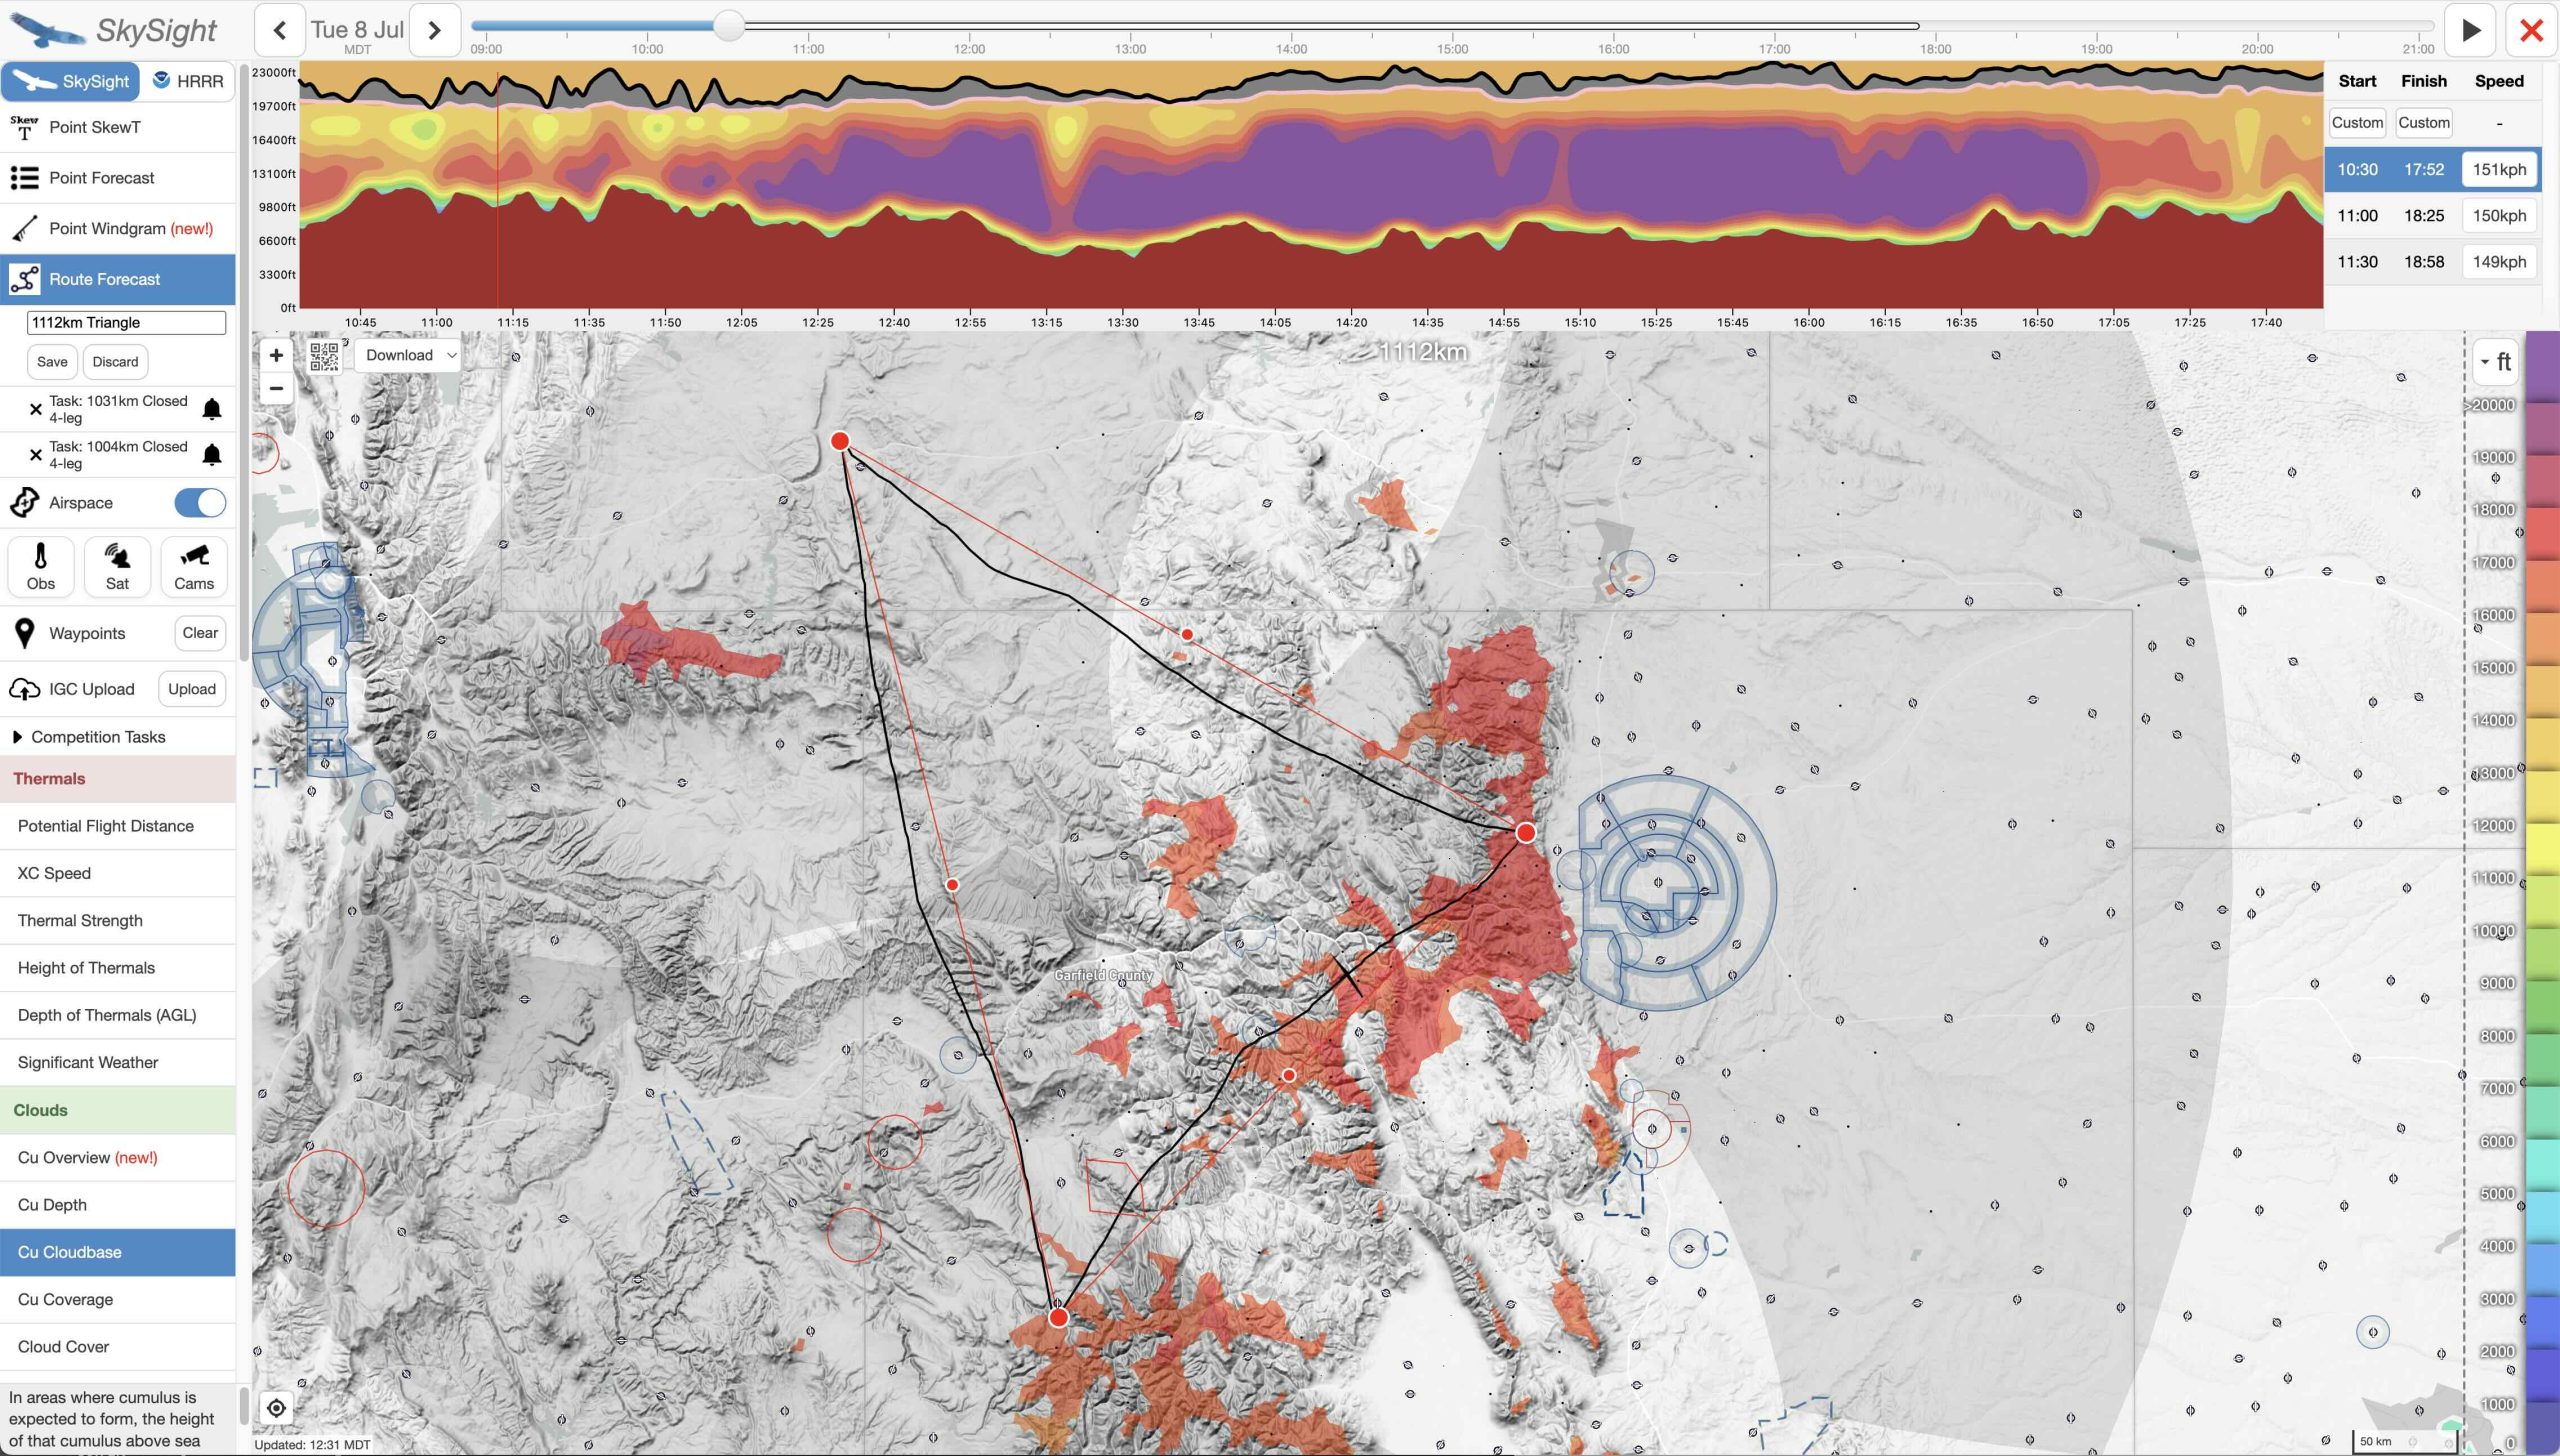
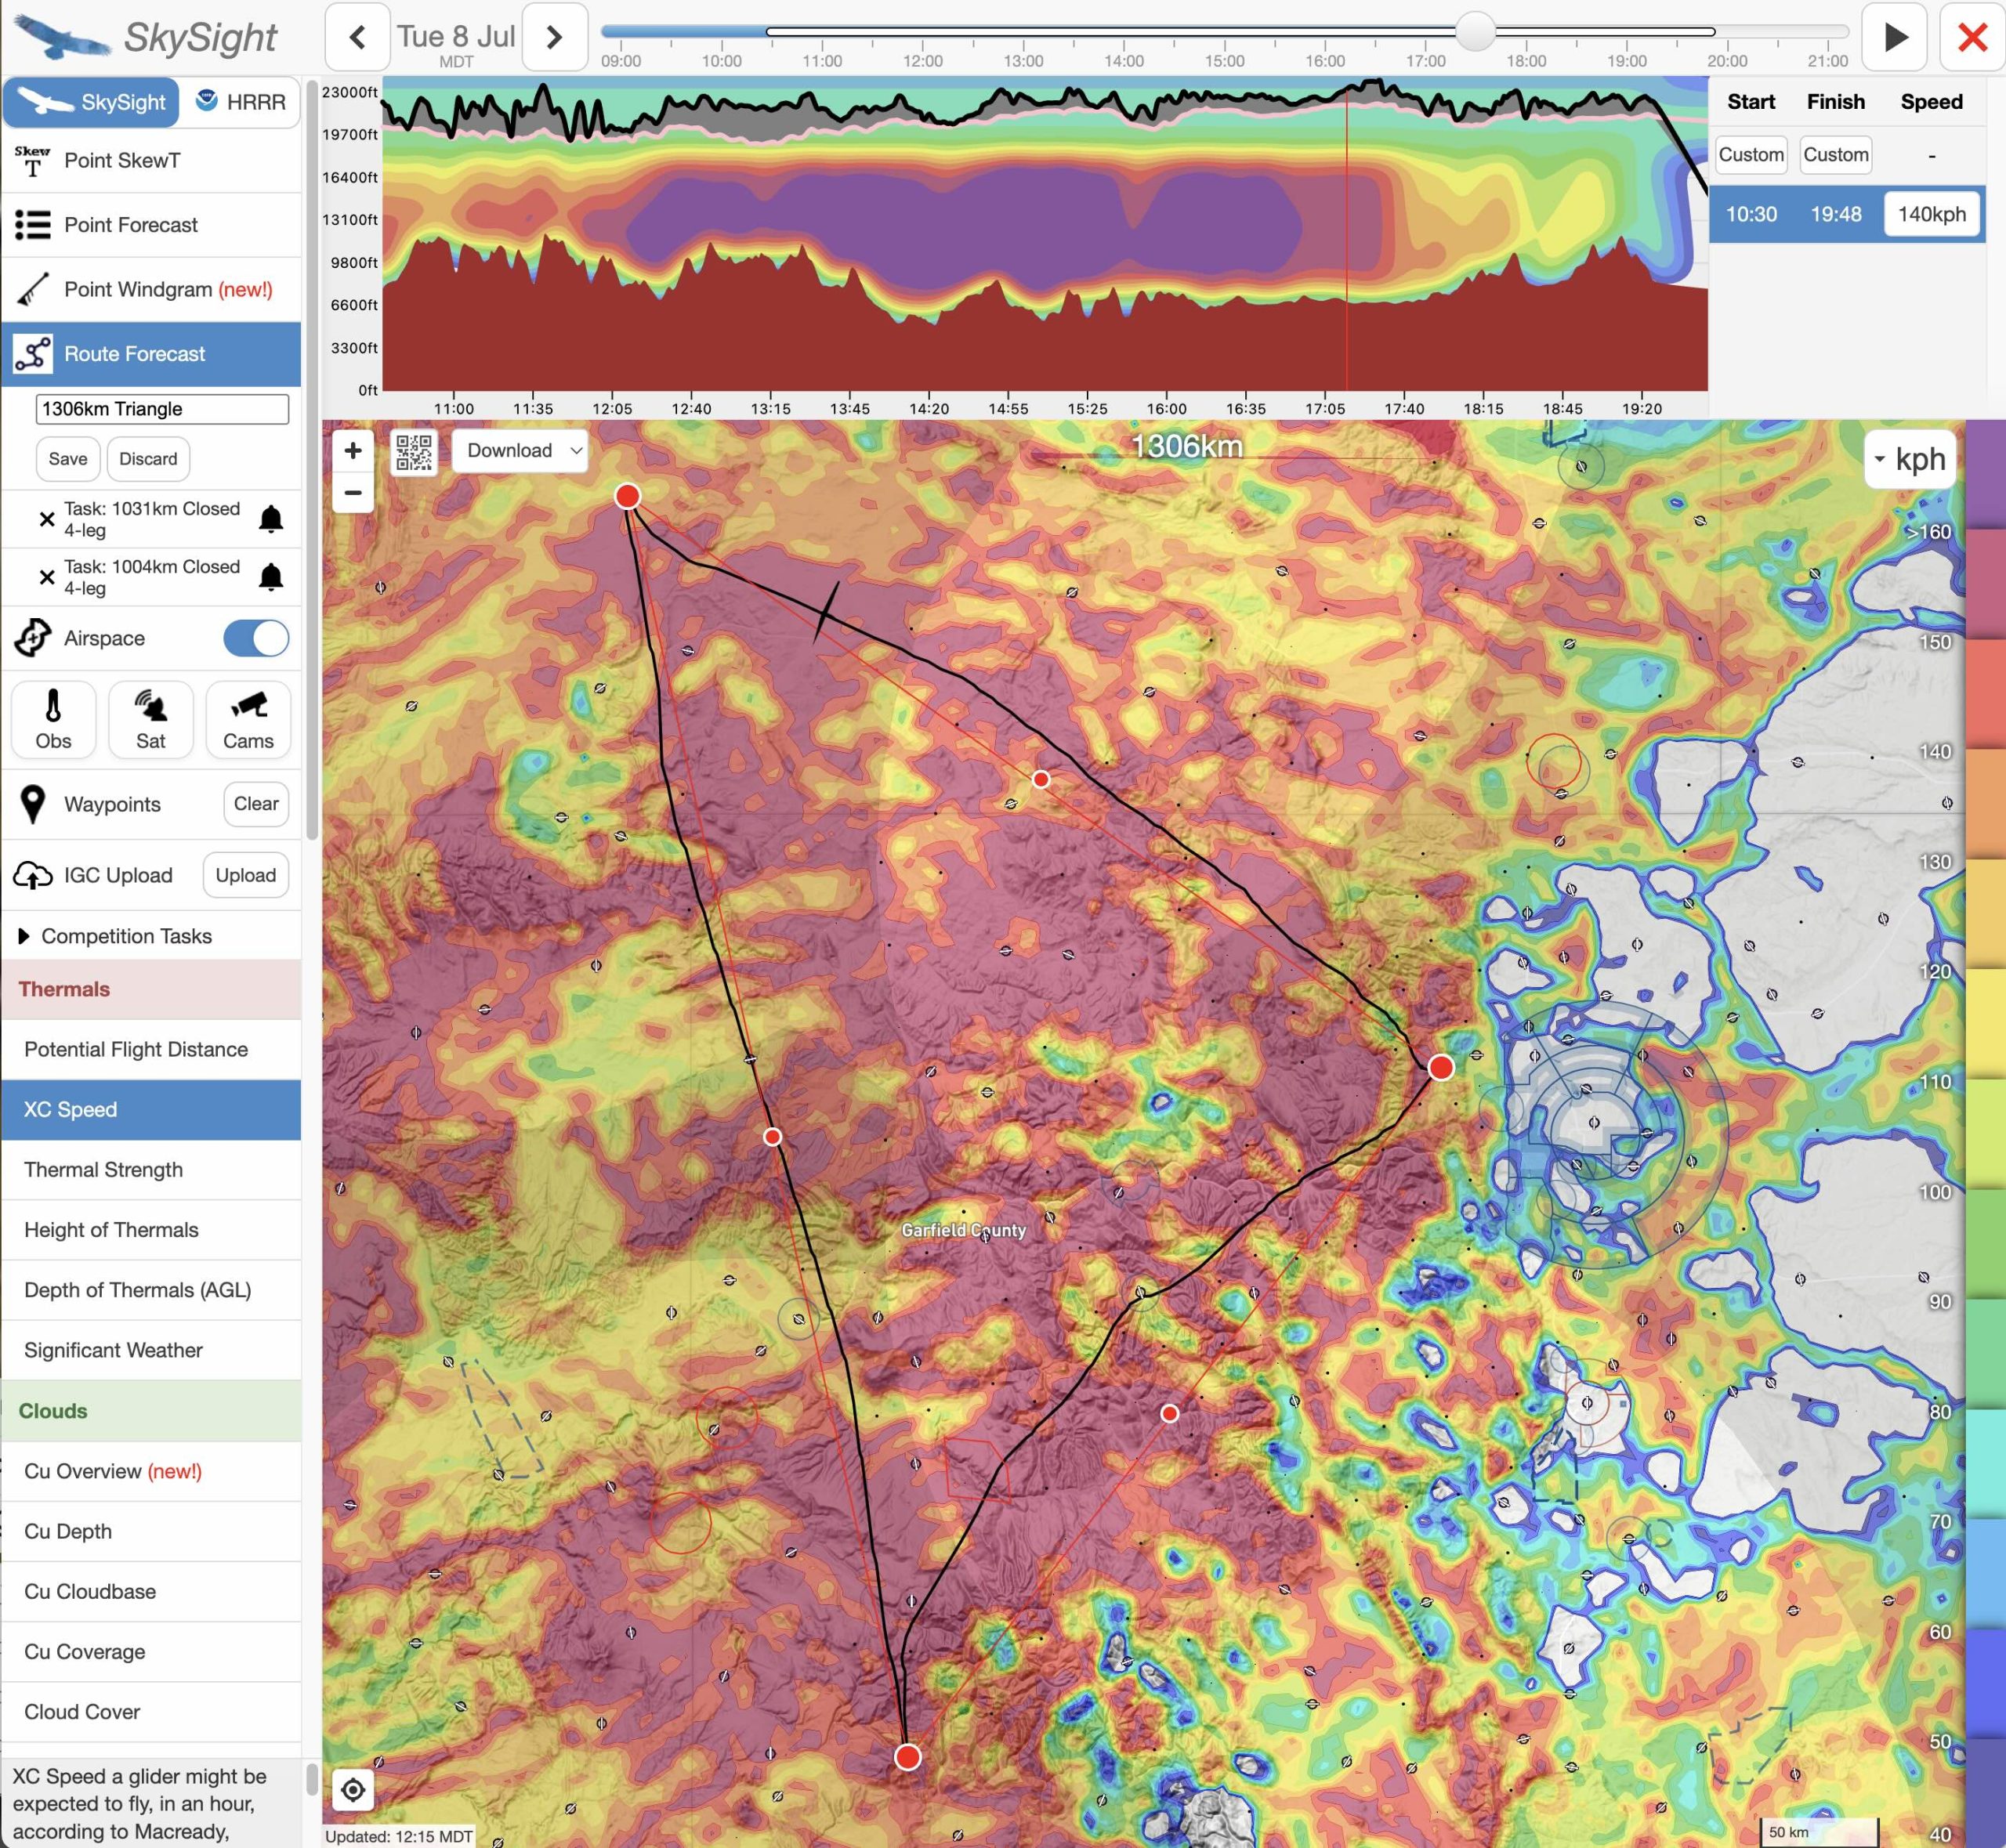
Fortunately technology can help us challenge these orthodoxies and open up our imagination for what’s possible.  That’s why I often start with Skysight’s “Route Forecast” tool.  If you click on a start point and give Skysight a little time to calculate, it will return a broad range of route suggestions.

When planning a particularly long flight, I start by looking at the longest and most challenging ones: the ones’ listed in red at the bottom of the suggestions that Skysight generates.  I don’t just look for the ones with the longest distance, but especially the ones with the greatest average speed.  That’s because forecast attainable speed is a great proxy for the the best soaring conditions.

Skysight had a lot of task suggestions for the day.  I picked the one that had the highest attainable speed as my starting point for further route planning. Skysight suggested an 1178 km Triangle which might be flown as fast as 147 kph on average.

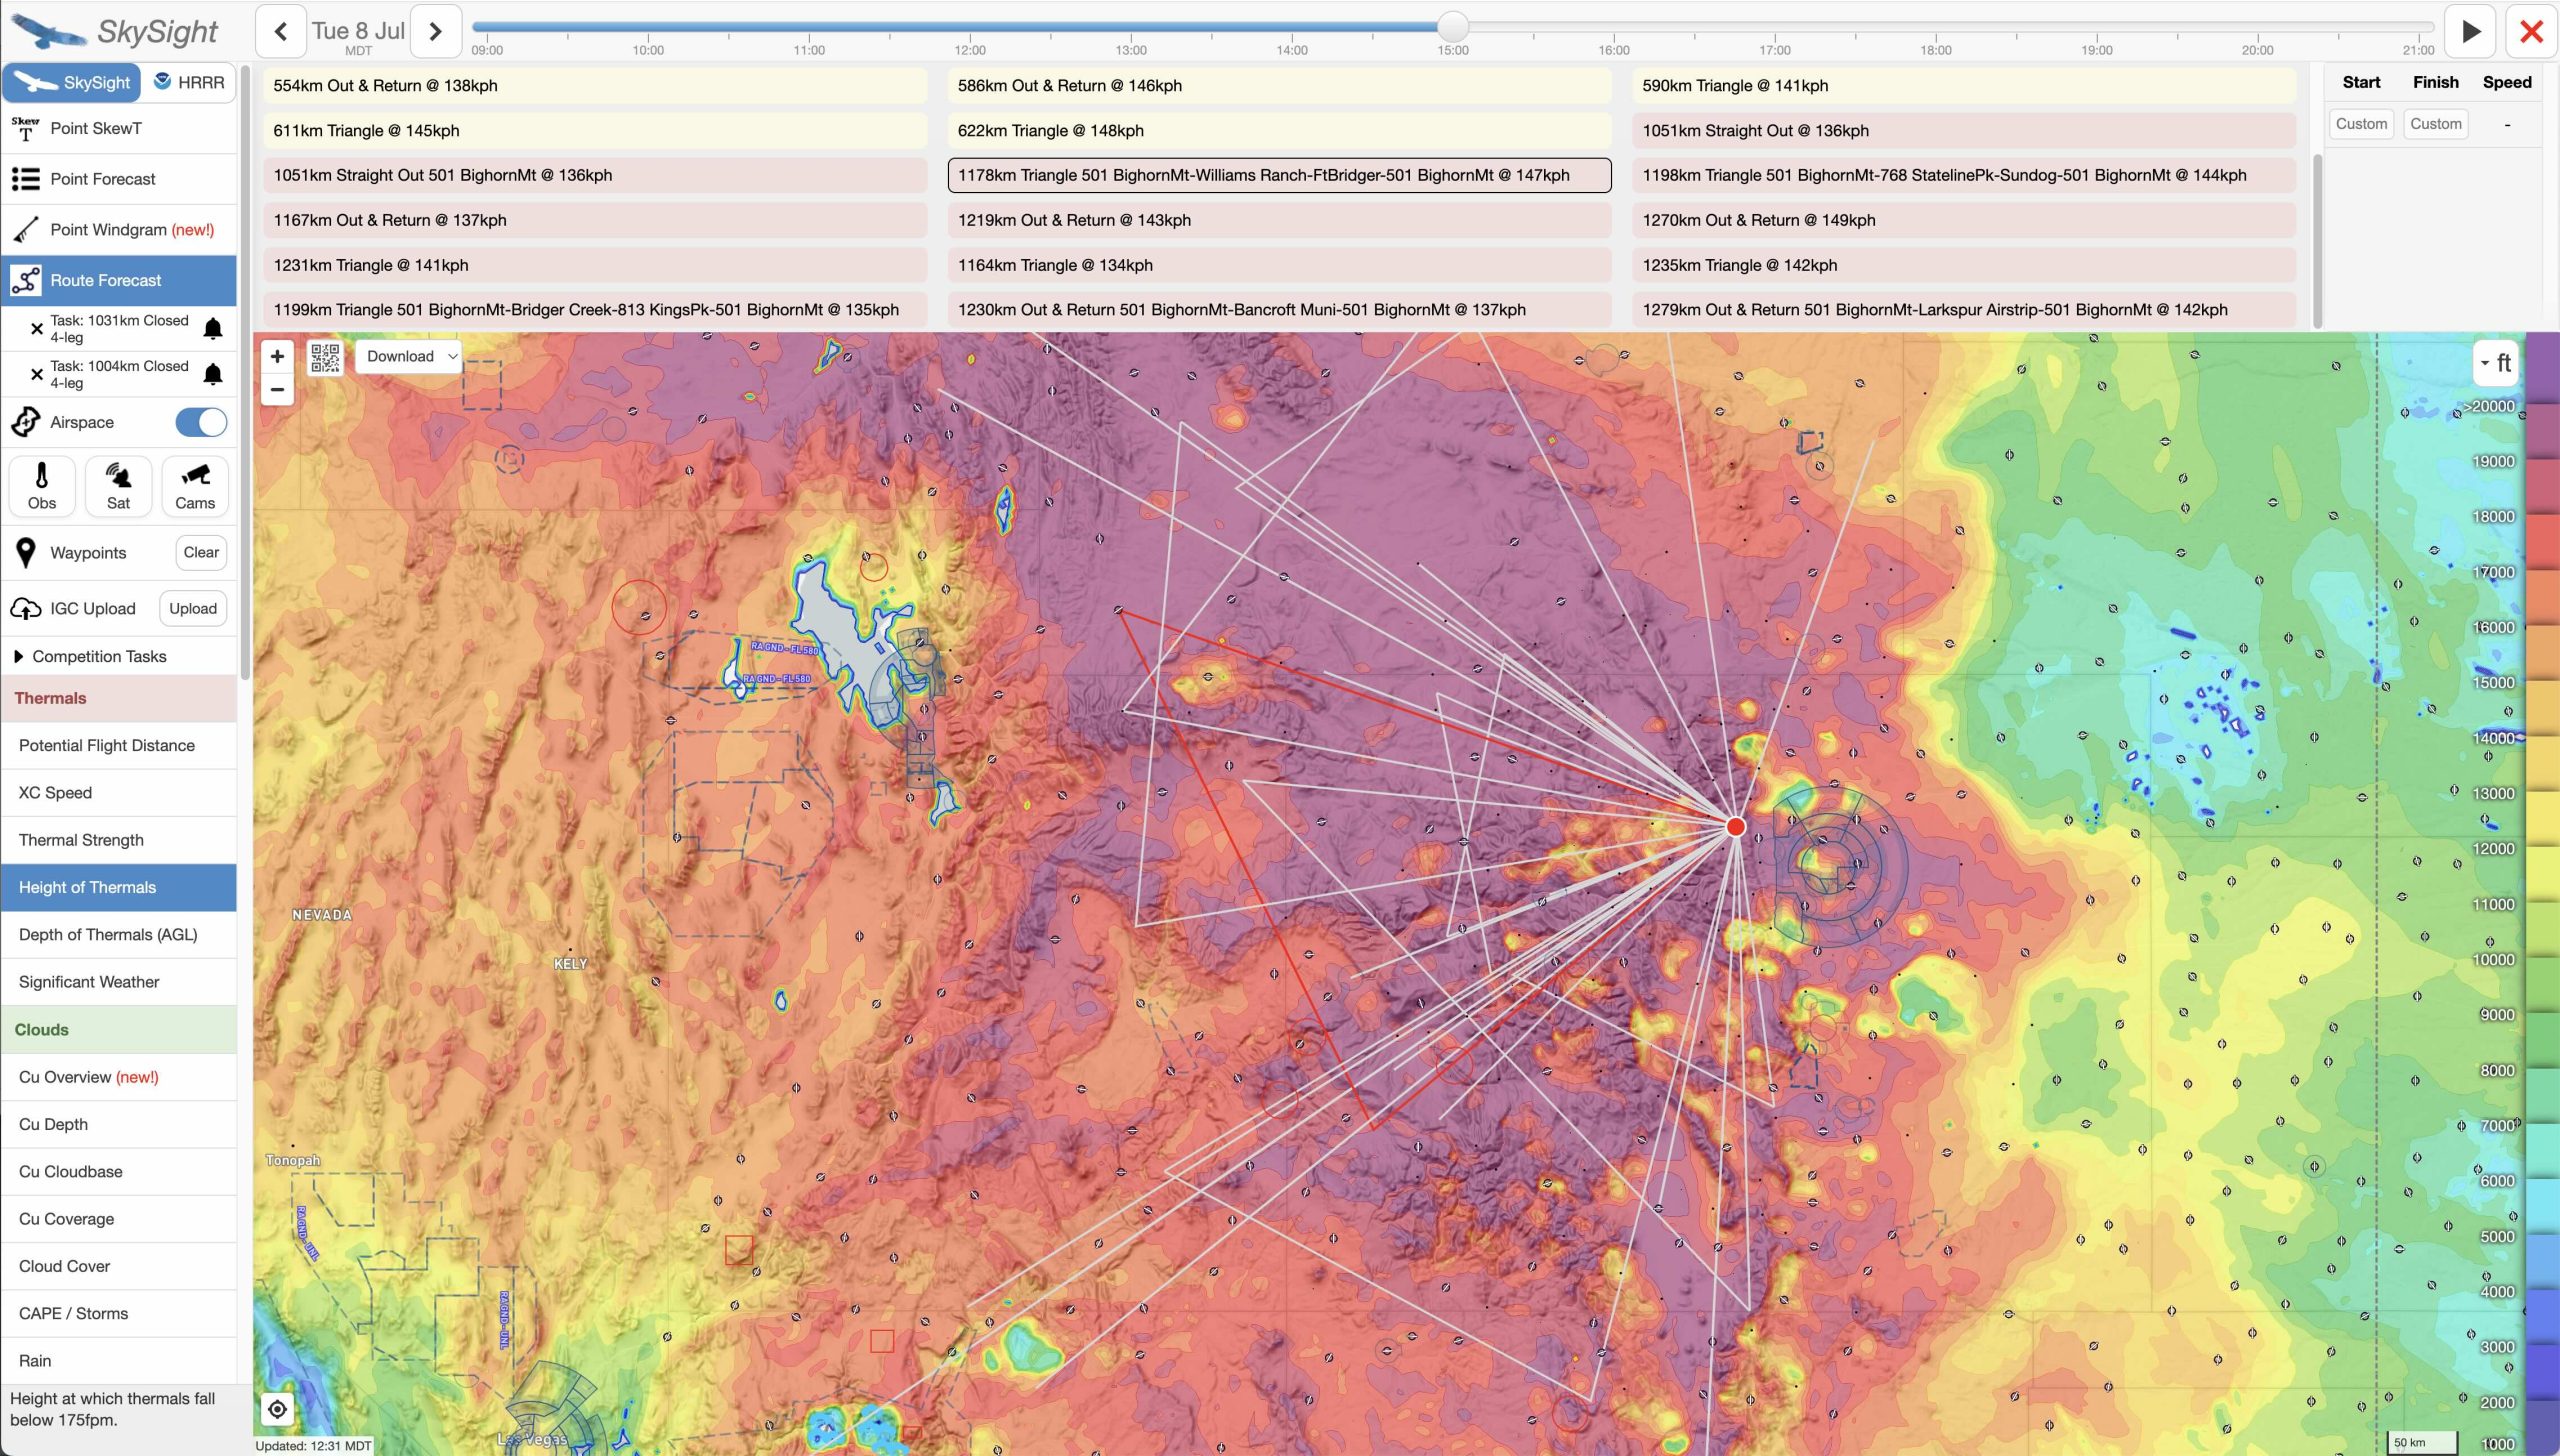
I don’t take the potential distances and speeds that Skysight returns at face value.  At least in Colorado, Skysight tends to be overly optimistic. I regard the suggestions more as the absolute maxima, assuming everything works perfectly. (Results may differ depending on where you’re at: e.g., in Southern France I’ve found Skysight to be overly pessimistic. I can only speculate why there might be such a difference – perhaps Skysight uses/prioritizes different weather models in different parts of the world, perhaps there are other factors at play.)

The key value of Skysight’s suggestion is that it will generally point me in the right direction.

Once I have a general idea of where I want to go, I usually start by modifying one of the most attractive of Skysight’s route suggestions, typically by cutting back it’s length by about 5-10% (accounting for the fact that I’m not Sebastian Kawa) and laying it out in a way that I can keep at least one airport in glide at any point along the route.

After I selected Skysight’s suggested task I started by picking the earliest possible task start time of 10:30AM and took a closer look at the recommended route.  It looked ok in general but there were a few things I did not like: (1) Leg 2 wasn’t straight and skirted along the edges of big blue areas. (2) The second turnpoint was behind an area devoid of cumulus that I would have to fly around.  (3) I also did not like the fact that the last turnpoint would be the furthest away from home.  It looked like some adjustments would be able to fix these little issues.

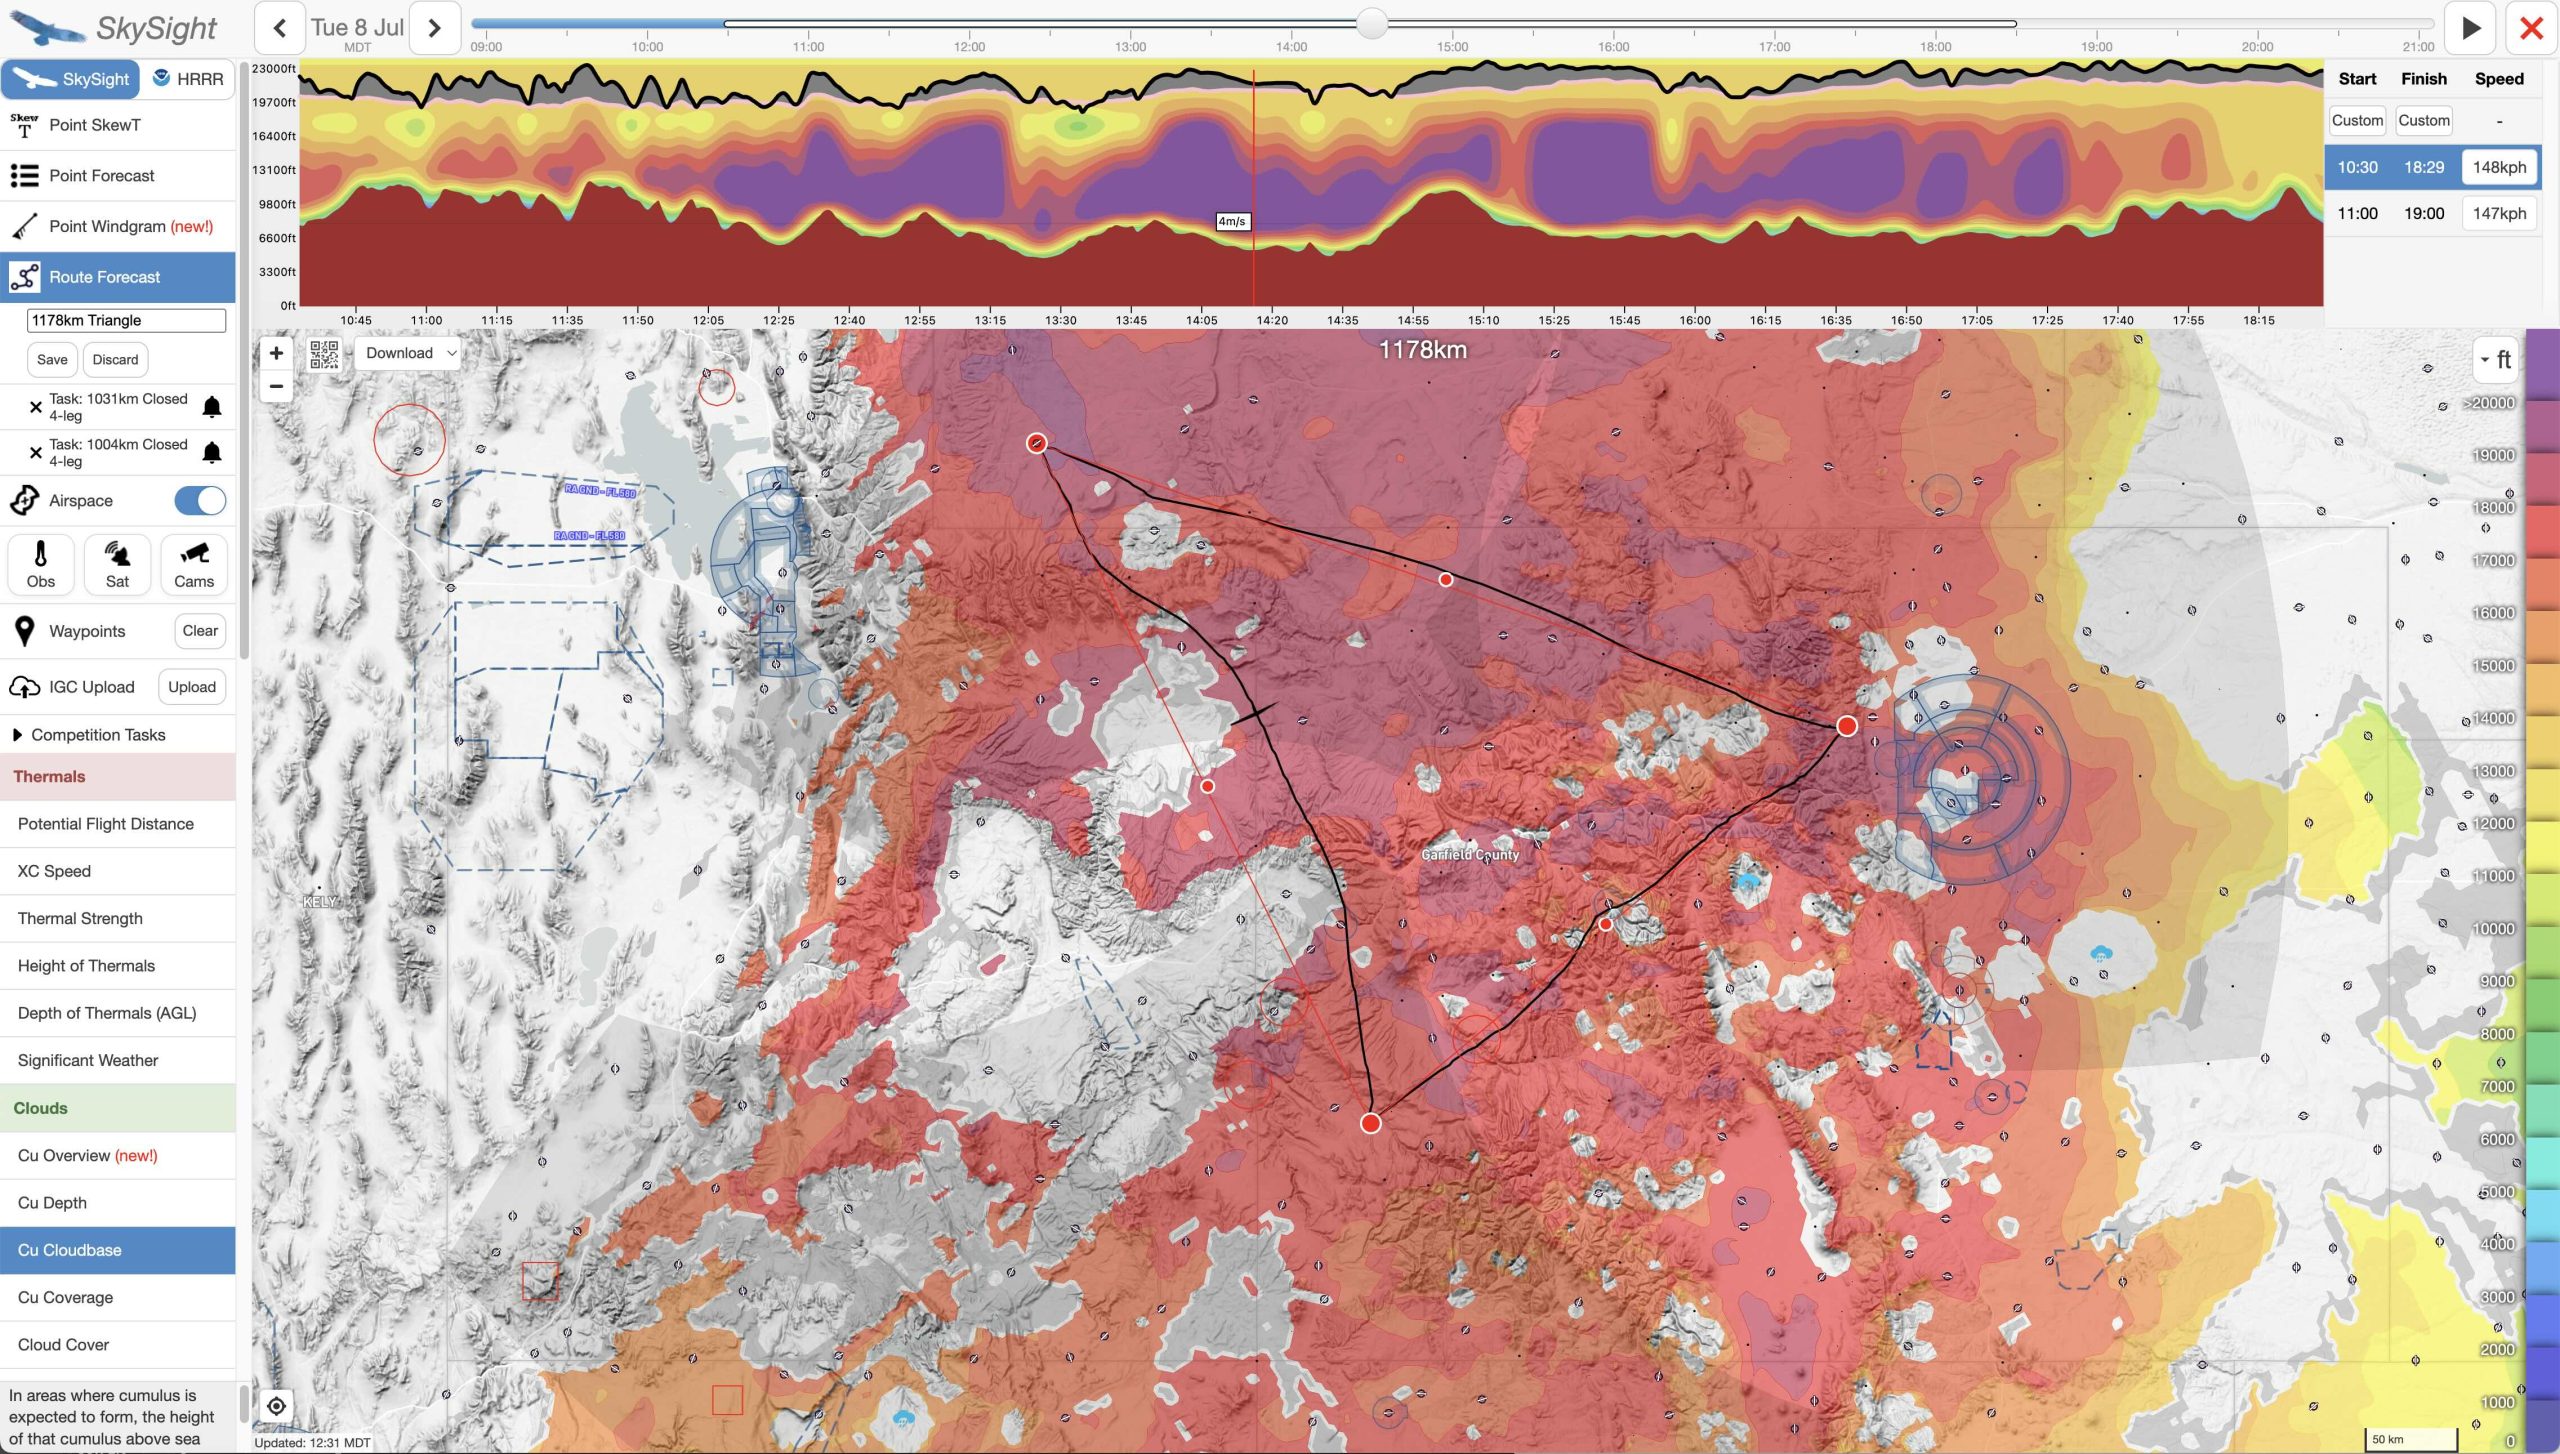
When adjusting my route, I usually overlay the Cumulus Cloud Base chart or the XC Speed  Chart as these work well to quickly identify the fastest and most reliable task lines. Usually it only takes me a minute or two to get a provisional route on screen, and I can see what average speed Skysight considers possible.  If I do this well, the maximum attainable speed of my task should be at least equal to or even greater than any of the tasks that Skysight automatically generated.

After a minute or two of playing around with the location of the turn points, I came up with the modified version shown above. Note how it addresses my initial concerns:  (1) All legs are now relatively straight. (2) I moved the second turn point further to the east so that it does not go around the area devoid of cumulus.  Note how I placed it just to the NW of a good airport (SW Wyoming Regional, which helps to keep a landable place in glide.) (3)  I moved the first turn point further to the south, close to the airport of Telluride. This put the crossing of the Gunnison Valley over higher and thermally more active terrain.  (I also placed the turn point itself over high terrain and did not pick Telluride, which is of course in the middle of a valley.  Valleys are usually sinky and therefore make lousy turn points.) These alterations made Legs 1 and 2 longer and Leg 3 shorter. The entire task was now a little shorter as well.  This gave me more confidence that I would be able to make it around in time.  Also note how Skysight calculated a maximum possible average speed of 151 kph, a little faster than the 147 kph it had calculated for the auto-generated task.  Overall, the modified task looked quite a bit better to me that the auto-generated suggestion.

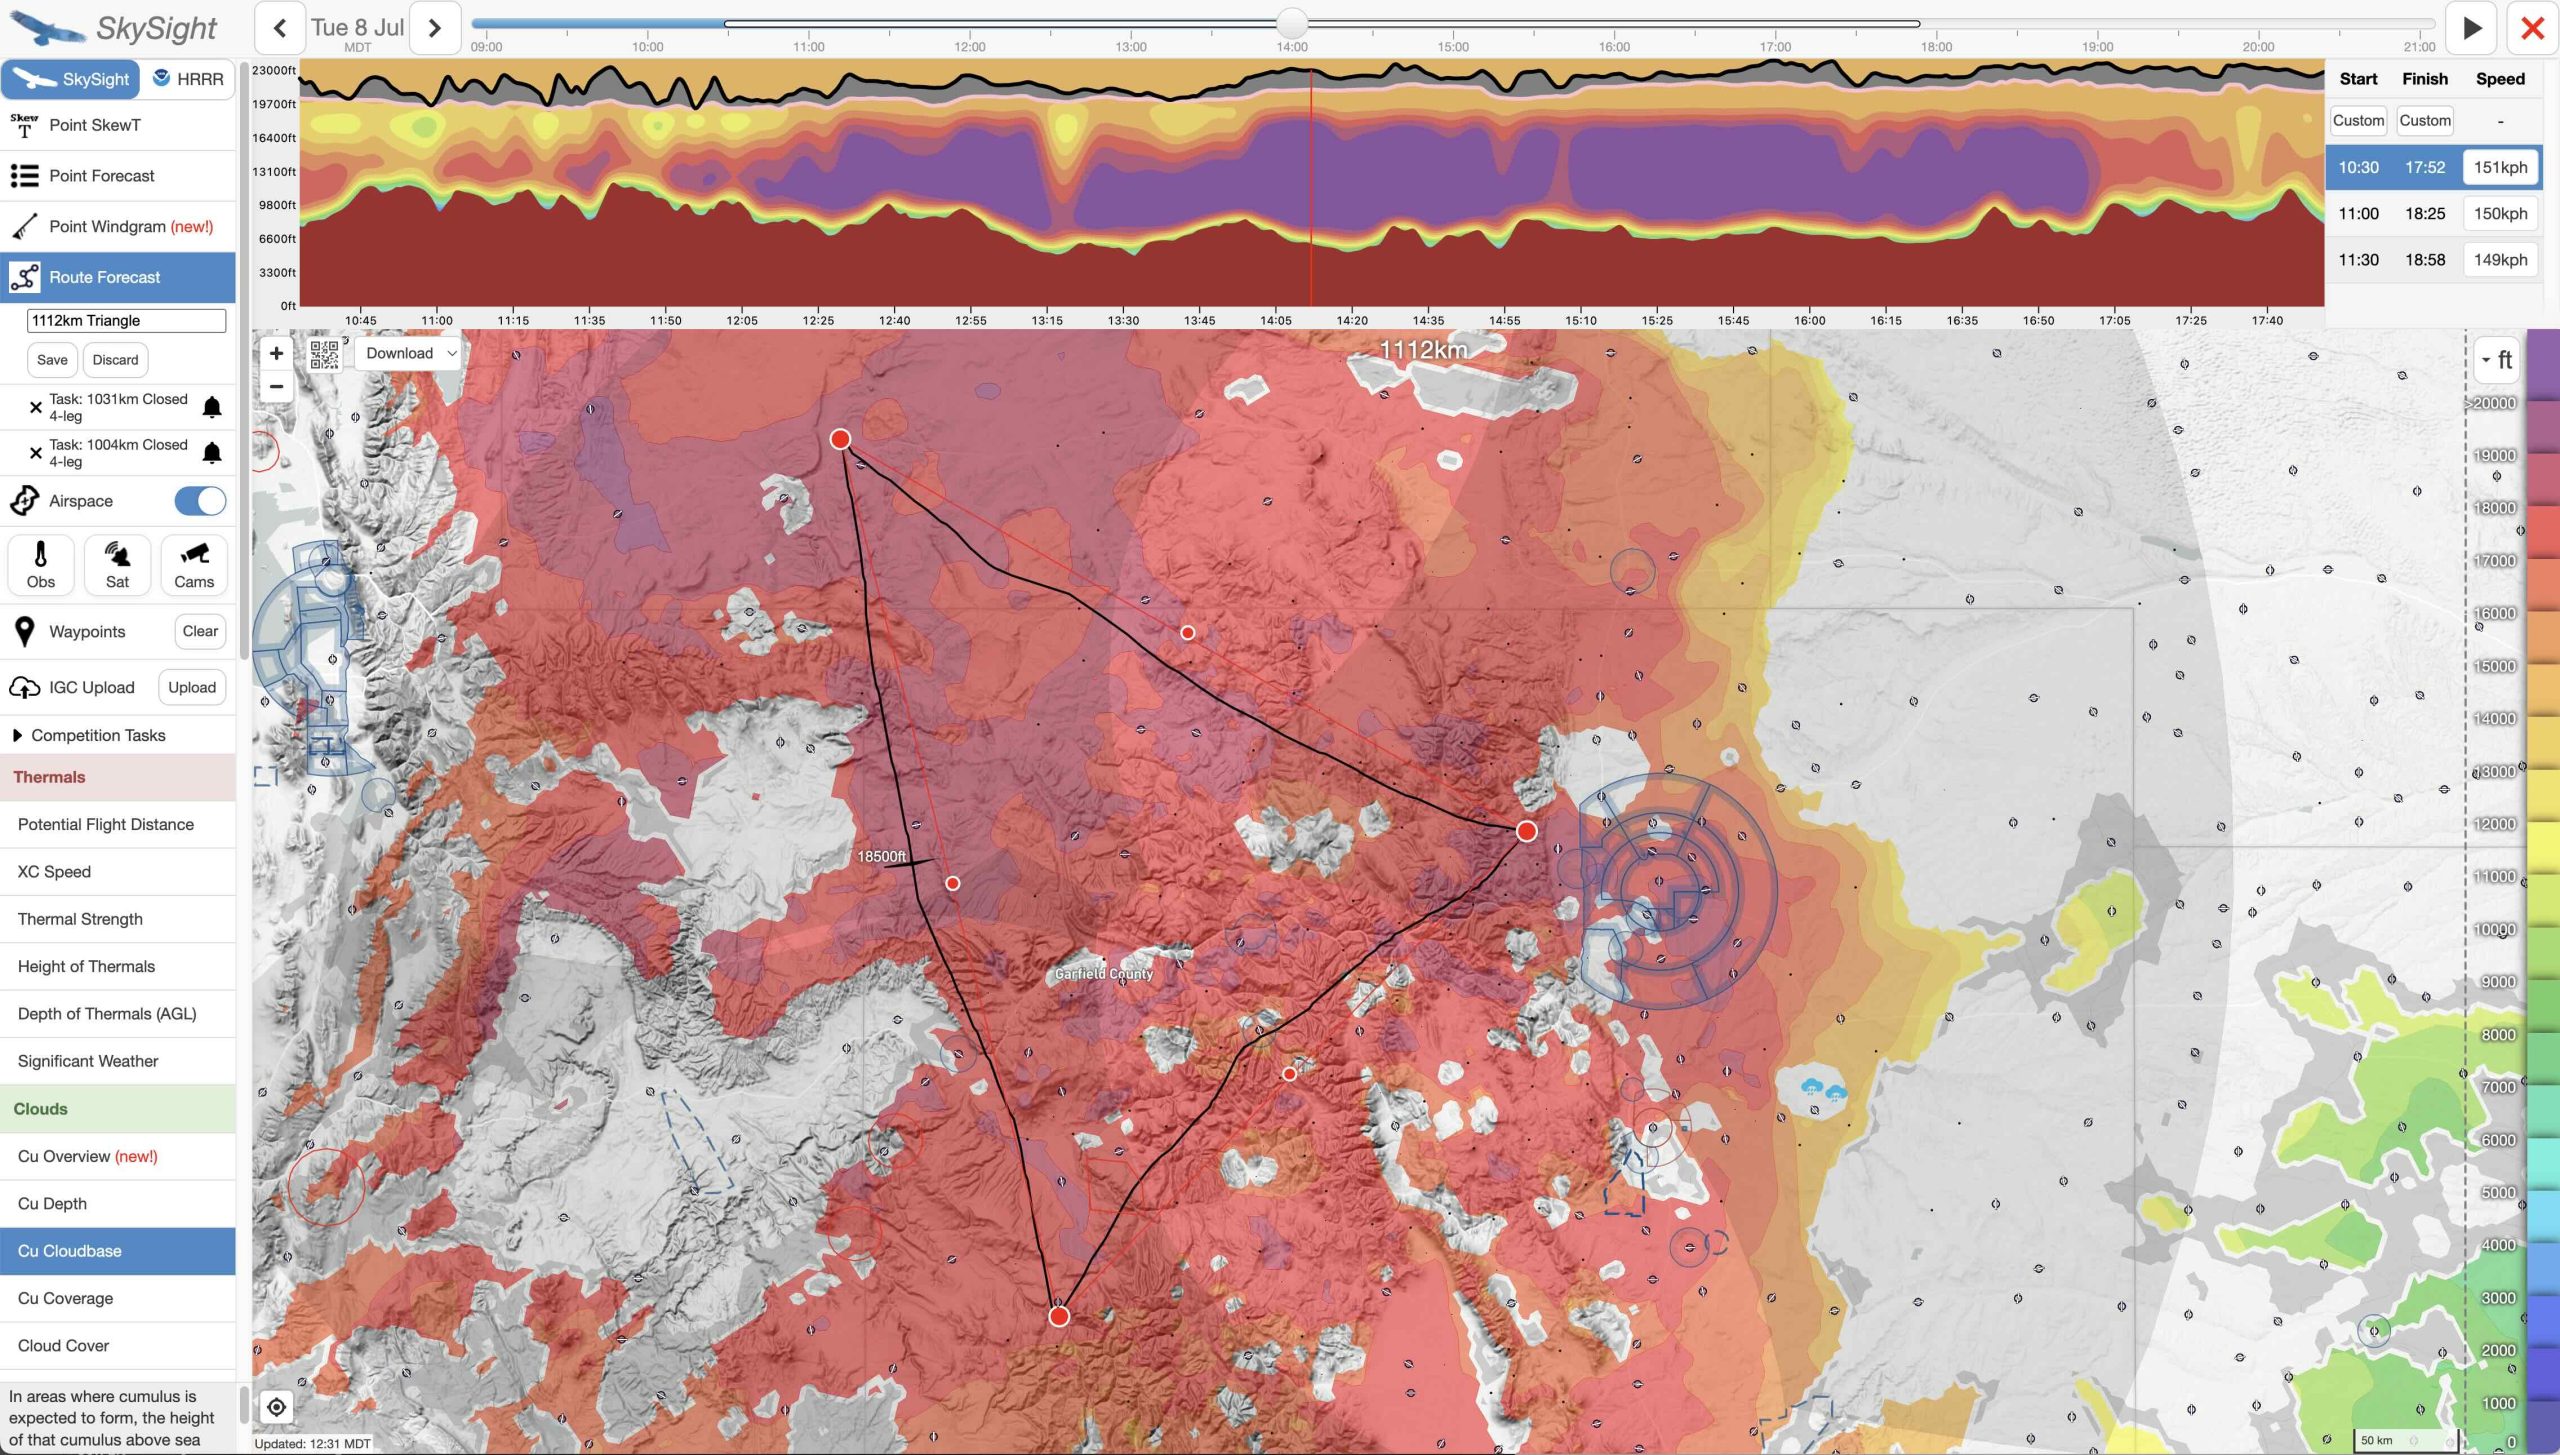
When planning a big triangle, I often also test additional geometries.  E.g., if the weather supports it, I like to put my Start/Finish Point along one of the triangle’s legs, rather than at a corner. (Skysight only suggests triangles with the Start/Finish at a corner.)  The advantage of placing the Start/Finish Point on a leg is that it gets me closer to home on the second to last leg and gives me the option of cutting the flight short in case the weather deteriorates prematurely, or in case that I’m simply too slow to make it around the course.  But planning such a 3-turn-point triangle course only make sense if the weather forecast supports it.

I tried this strategy also for Tuesday, July 8.  However, the longest route that Skysight could calculate based on this strategy was considerably shorter and slower than it’s best task suggestions.  One particular problem with this alternative plan was the forecast overdevelopment on Leg 2.  I quickly dismissed this strategy for July 8 and decided I would go back and continue to fine tune the task suggestion above.

Step 3: Fine-Tuning the Route

Once I have the preliminary route plan drawn in Skysight, I fine tune it using the following tools.

1. Setting a Precise Start & Finish Point

I want my start point (which should be near where I would plan to shut off the engine) in an area that promises the best chance of a good climb to the top of the morning thermals.  This helps me to get started quickly, without wasting any time.

In Boulder, that point can vary widely from day to day.  Sometimes it is only a few miles from the airport, on other days it may be necessary to motor/tow for some 15-20 miles towards the Continental Divide.  Good Start Points are normally immediately to the west of the forecast convergence line that typically runs east of – and parallel to – the Front Range.  But the position of the convergence line varies from day to day. Don’t just always pick the same start point simply because it has a good reputation!

Once I have a good Start Point I check if it is also suitable as a Finish Point.  Here I have to be particularly mindful of the late afternoon weather.  E.g., I want to minimize the risk that a big thunderstorm could sit right over my finish point by the time I expect to return home.  Obviously the precise location and timing of afternoon storms is (still) impossible to predict but I can definitely reduce the risk.  If the risk of late day storms in the vicinity of my Finish Point is high, I consider setting a “remote” Start &Finish Point.  That’s a point considerably removed from the point of my motor shut off location.  Of course, the time I need to get to and from the remote Start and Finish Point reduces the available time on task.

On July 8 I decided on Gold Hill as my Start Point. As the charts above show it is located within the forecast convergence zone and at a place where the highest thermals were forecast at 9:30 AM in the morning. My hope was that this would facilitate an early launch and climb out so that I could get on my way as soon as possible.  There was no risk of storms near Gold Hill late in the day which meant that it was also suited as the Finish Point for my task.
2. First Leg

I usually plan the first leg of the flight in a direction where good thermals and cumulus are first forecast.  In Boulder often – but not always – the best initial leg is parallel to the Front Range of the Rocky Mountains because the east-facing slopes receive the most heat from the morning sun.  Sometimes clouds are first forecast to the north, sometimes to the south. (This largely depends on the strength and location of any morning inversion and the moisture content of the airmass.)

The best cumulus at 10:30AM were forecast to the southwest of Boulder.  It therefore made sense to plan the first leg in this direction.  Note how the reverse task direction (first leg to the northwest) would not have made any sense because it would not have been supported by cumulus.

If my first turnpoint is not directly in the direction of the best early lift, I may need to initially deviate from the direct course line.  This will add extra distance and result in a relatively slower speed on my initial leg.  I try to anticipate this and take it into account in the timing of the flight.

A quick glance at the convergence forecast at the time of my planned start showed convergence zones initially to the south (note the red areas) and not along the Skysight-generated course line (shown in black).  This caused me to anticipate that I might have to initially deviate to the south along the convergence before heading more directly towards TP1.  In Boulder it is often much faster to follow the convergence even if it entails a significant detour, especially early in the morning.
3. Thermal heights, thermal strength, and cumulus around the course

The time of thermal development can vary widely in different parts of the task area.  In Boulder, we’re fortunate that the earliest Colorado thermals are often along the eastern slope of the Front Range nearby, allowing an early launch. (The reason is that the eastern slope of the Front Range is directly exposed to the morning sun.)

These three charts show Thermal Heights, Thermal Strength, and the Base of Cumulus Clouds at 10:30 AM – the time of my planned task start. (The take-off from the airport would of course have to be earlier to enable a task start by 10:30 AM.) You can see that thermals were forecast to develop early in the area just to the west of Boulder.  Also, all indicators looked good in the direction of my first turn point to the southwest.

Being able to launch early also means that it is quite possible that I may arrive in other parts of the task area too early, i.e. before thermals there have had a chance to develop.  For flights from Boulder this can be a real problem.  E.g., a good example would be the transition from South Park to the Wet Mountains on early south-bound legs.  If I get there too early, I risk sinking out in the valley to the South of Pikes Peak and not making it onto the Wet Mountains at all.

Similarly, it can be risky to jump across the Front Range before the sun has had a chance to heat up the west-facing slopes. Any early morning crossing of wide valleys can put one in an analogous predicament.

For my flight on July 8, one potential issue was the timing of thermals and cumulus cloud development on the 2nd leg. You can see that Leg 2 was forecast to be almost completely blue until 11AM. Cloud development would really start around noon and the leg would be “filled in” with cumulus clouds by 1PM. This suggested that getting to this leg too early (much before 1PM) could be a problem. This also confirmed my earlier decision to make the first leg longer by moving the first turnpoint further to the south. Based on this plan, a realistic goal was to reach my southern turnpoint around 1PM, just in time for good thermals and clouds to appear along the second leg.

Once a route is drawn, the easiest way to test the timing is by examining the Vertical Profile atop Skysight’s route planning tool.  For any given start time it shows around the entire course: the forecast thermal height; the thermal strengths; the height of the condensation layer; and the predicted presence and depth of cumulus clouds.  This is a fantastic way to spot likely problems along the route such as: extended transitions with low thermal heights that may be hard to cross, areas where no lift can be expected at all, sections without any cloud markers, etc.

The vertical profile of the entire flight along the projected route with a start at 10:30AM.  It shows (1) excellent thermal heights of more than 17,999 ft (the legal maximum in the US for VFR flight); (2) strong thermals throughout the day, especially between 12 noon and 5PM; (3) as well as cumulus clouds throughout the entire flight.  A profile like the one shown is almost as perfect as it can be. The only thing that I thought would require further investigation was the significant depth of cumulus clouds before 12AM combined with lower thermal strength – a possible sign of early overdevelopment on the first leg.

If this would have revealed big problems associated with a very early start, I could have moved the time slider to delay the start time back by 30-60 minutes or try to change the route to avoid or reduce the problems.

The best and fastest routes will have no weak areas at all.  Creating such a route is often impossible but the closer I can get to this ideal, the faster my flight will likely be.

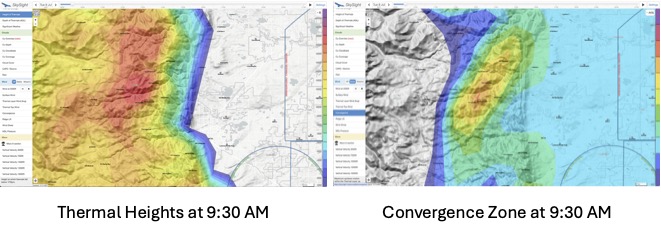
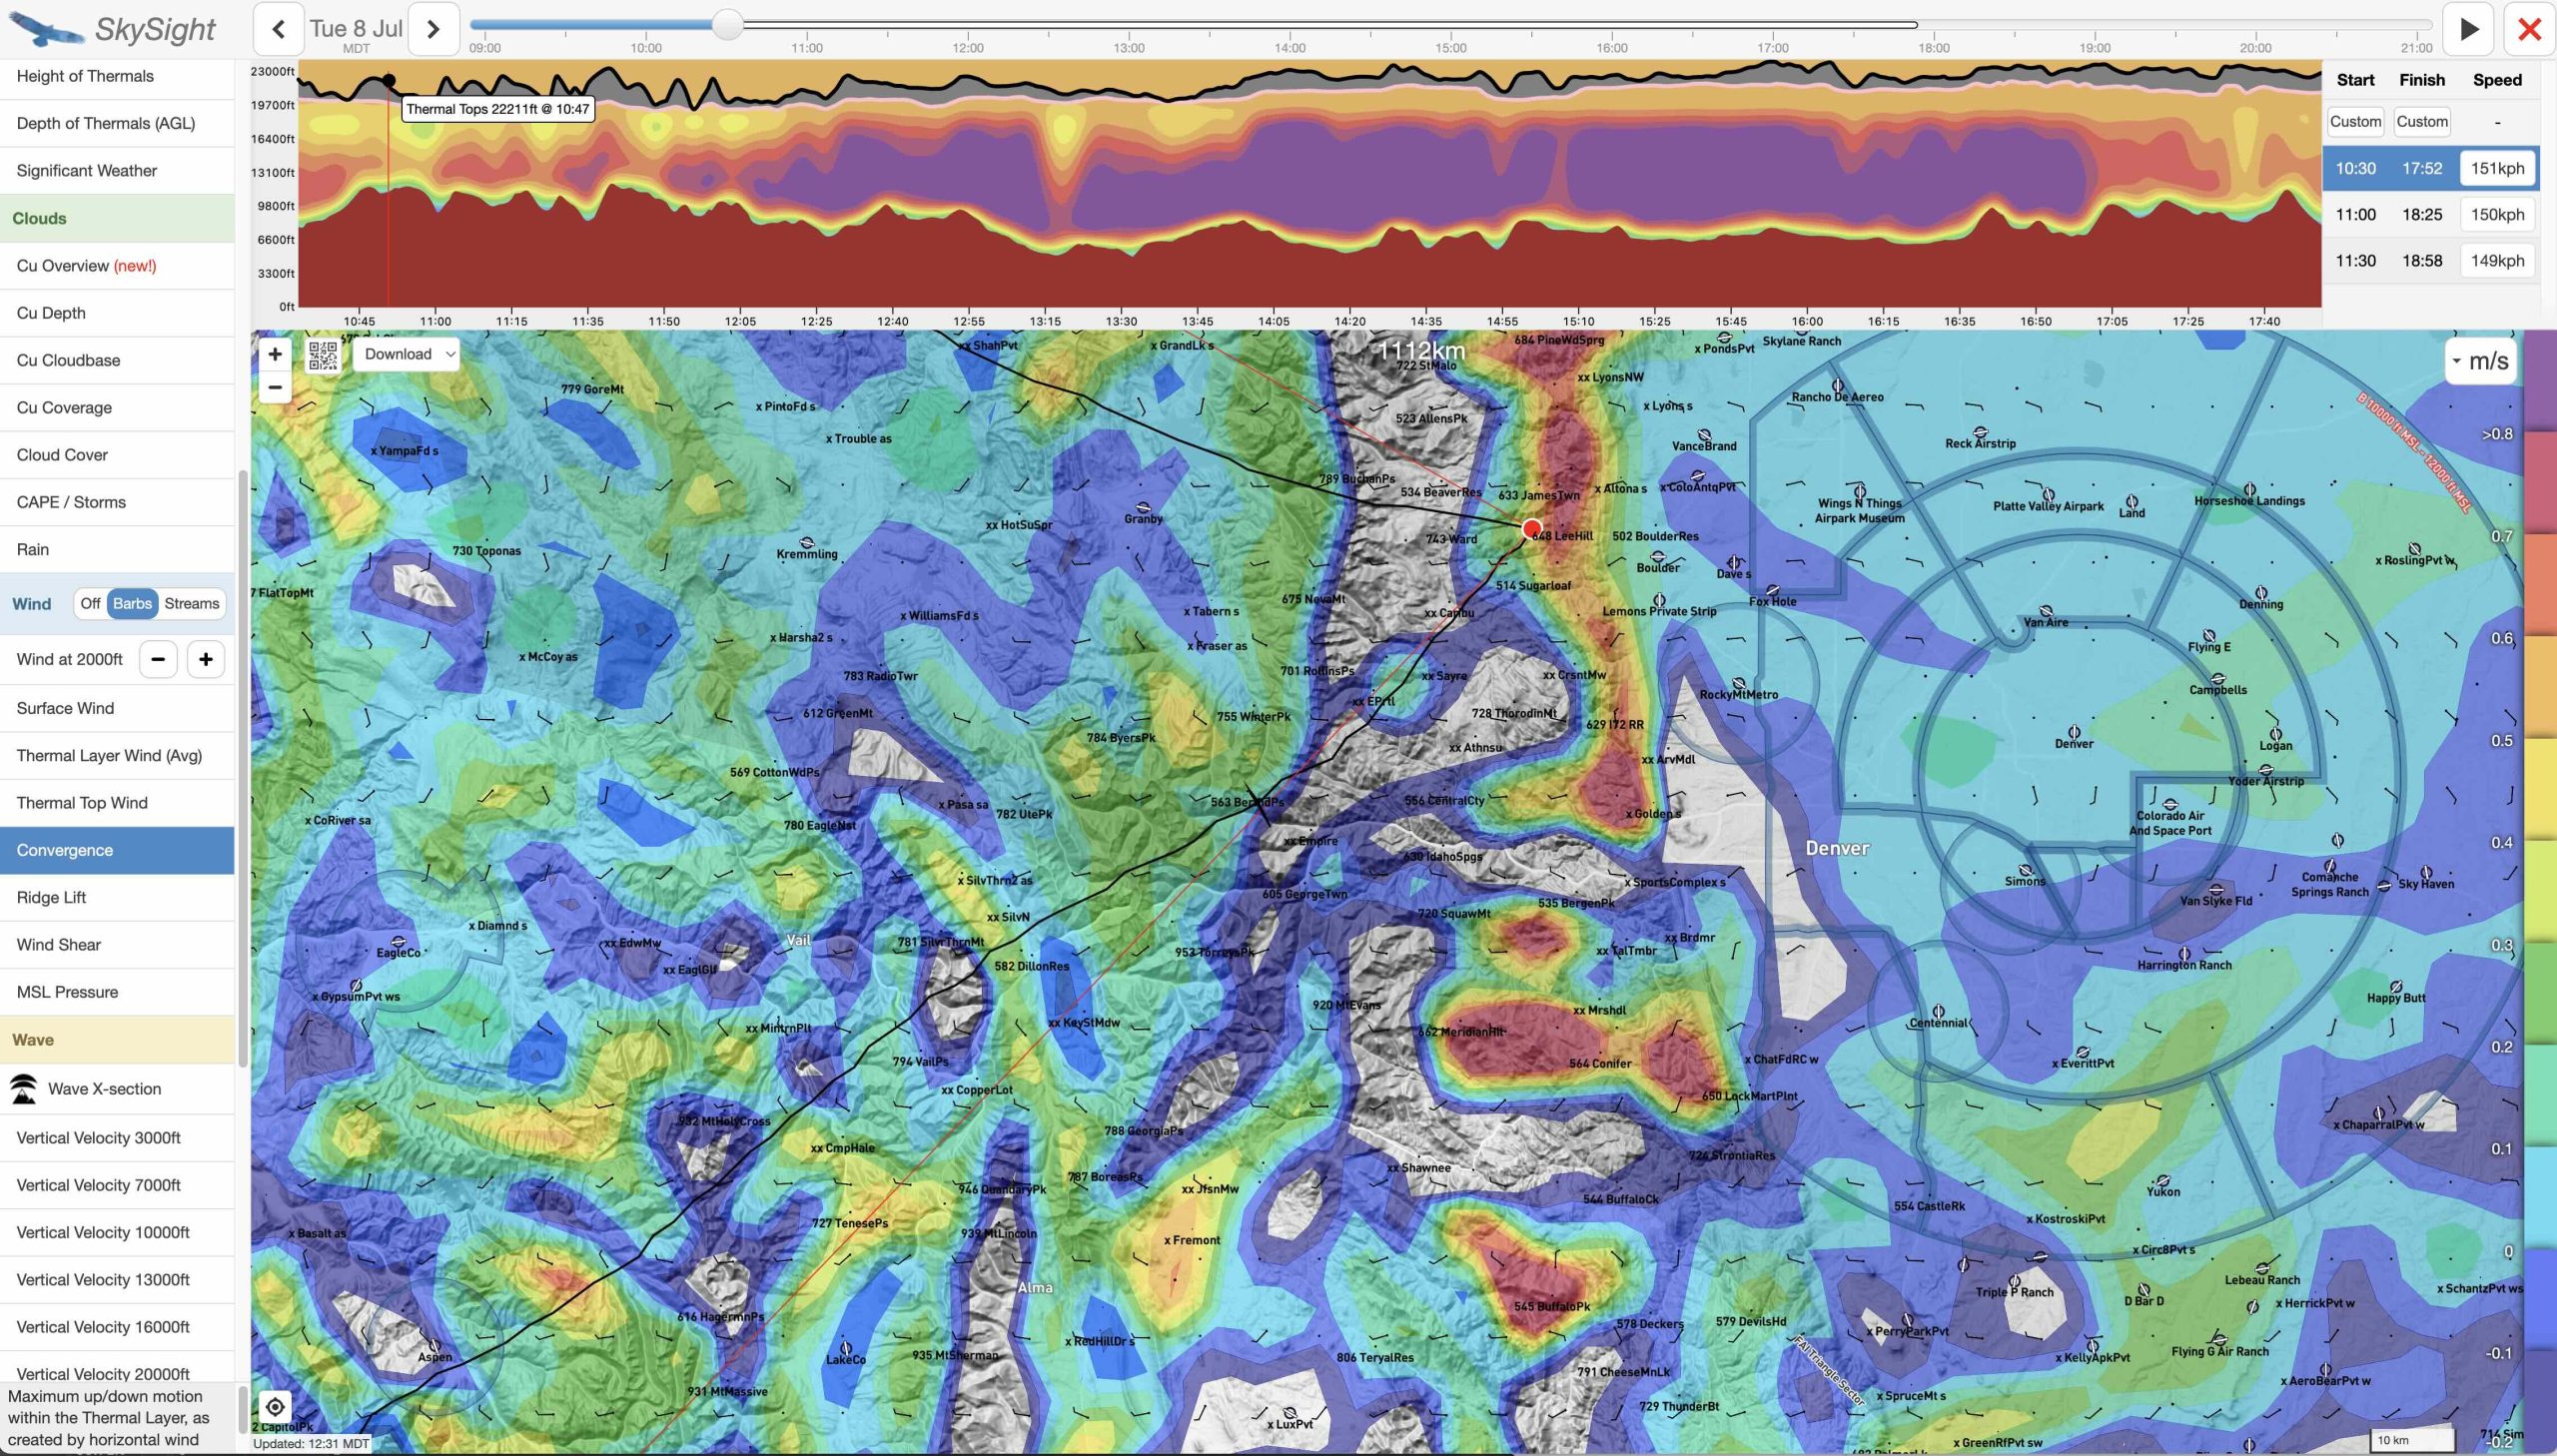
4. Convergence Zones

Convergence zones are areas where different wind streams are flowing towards each other, forcing the air within the convergence zone to generally go up on average (because it obviously can’t go into the ground).  Planning a task along convergence zones is generally a great idea because it means you will spend less time circling, and more time going straight, covering more distance at a higher average speed. In addition, thermals are more easily triggered within and along convergence zones.  (However, be mindful that convergence zones also tend to be the first areas to overdevelop!)

In my experience, convergence forecasts tend to be more accurate in the morning and gradually become less predictable later in the day.  But often the direction of convergence lines will still be the same, just the position of the convergence zone may shift.  If there are clouds, this is of course easy to see.

Convergence usually plays a much greater role in the mountains than in the flat lands and convergence zones tend to produce more lift (and divergence zones more sink) when there is significant wind.

If a flights can be aligned with long convergence zones there’s a good chance of much higher task speeds.

July 8 was forecast to be a light wind day and I therefore did not anticipate that convergence would be a huge factor. The charts show the forecast for different times of the day, timed to correspond with my forecast location mid-way on Legs 1, 2, and 3. Based on the forecast, convergence was going to be potentially most valuable on Leg 3 when multiple lift lines would likely form parallel to the direction of flight. (We will see below, that this is a function of the wind.)

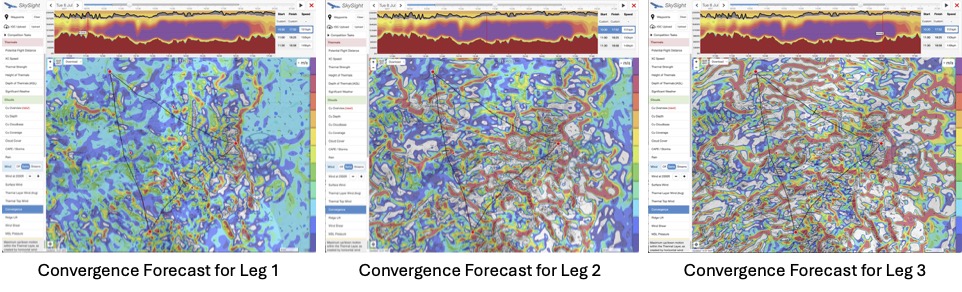
If strong convergence is expected, the forecast convergence zones can also be helpful in the specific selection of turn points.  E.g., in my task planning, I prefer to create a new turn point located in a convergence zone instead of simply picking an already existing waypoint which may happen to be in a forecast divergence area. )

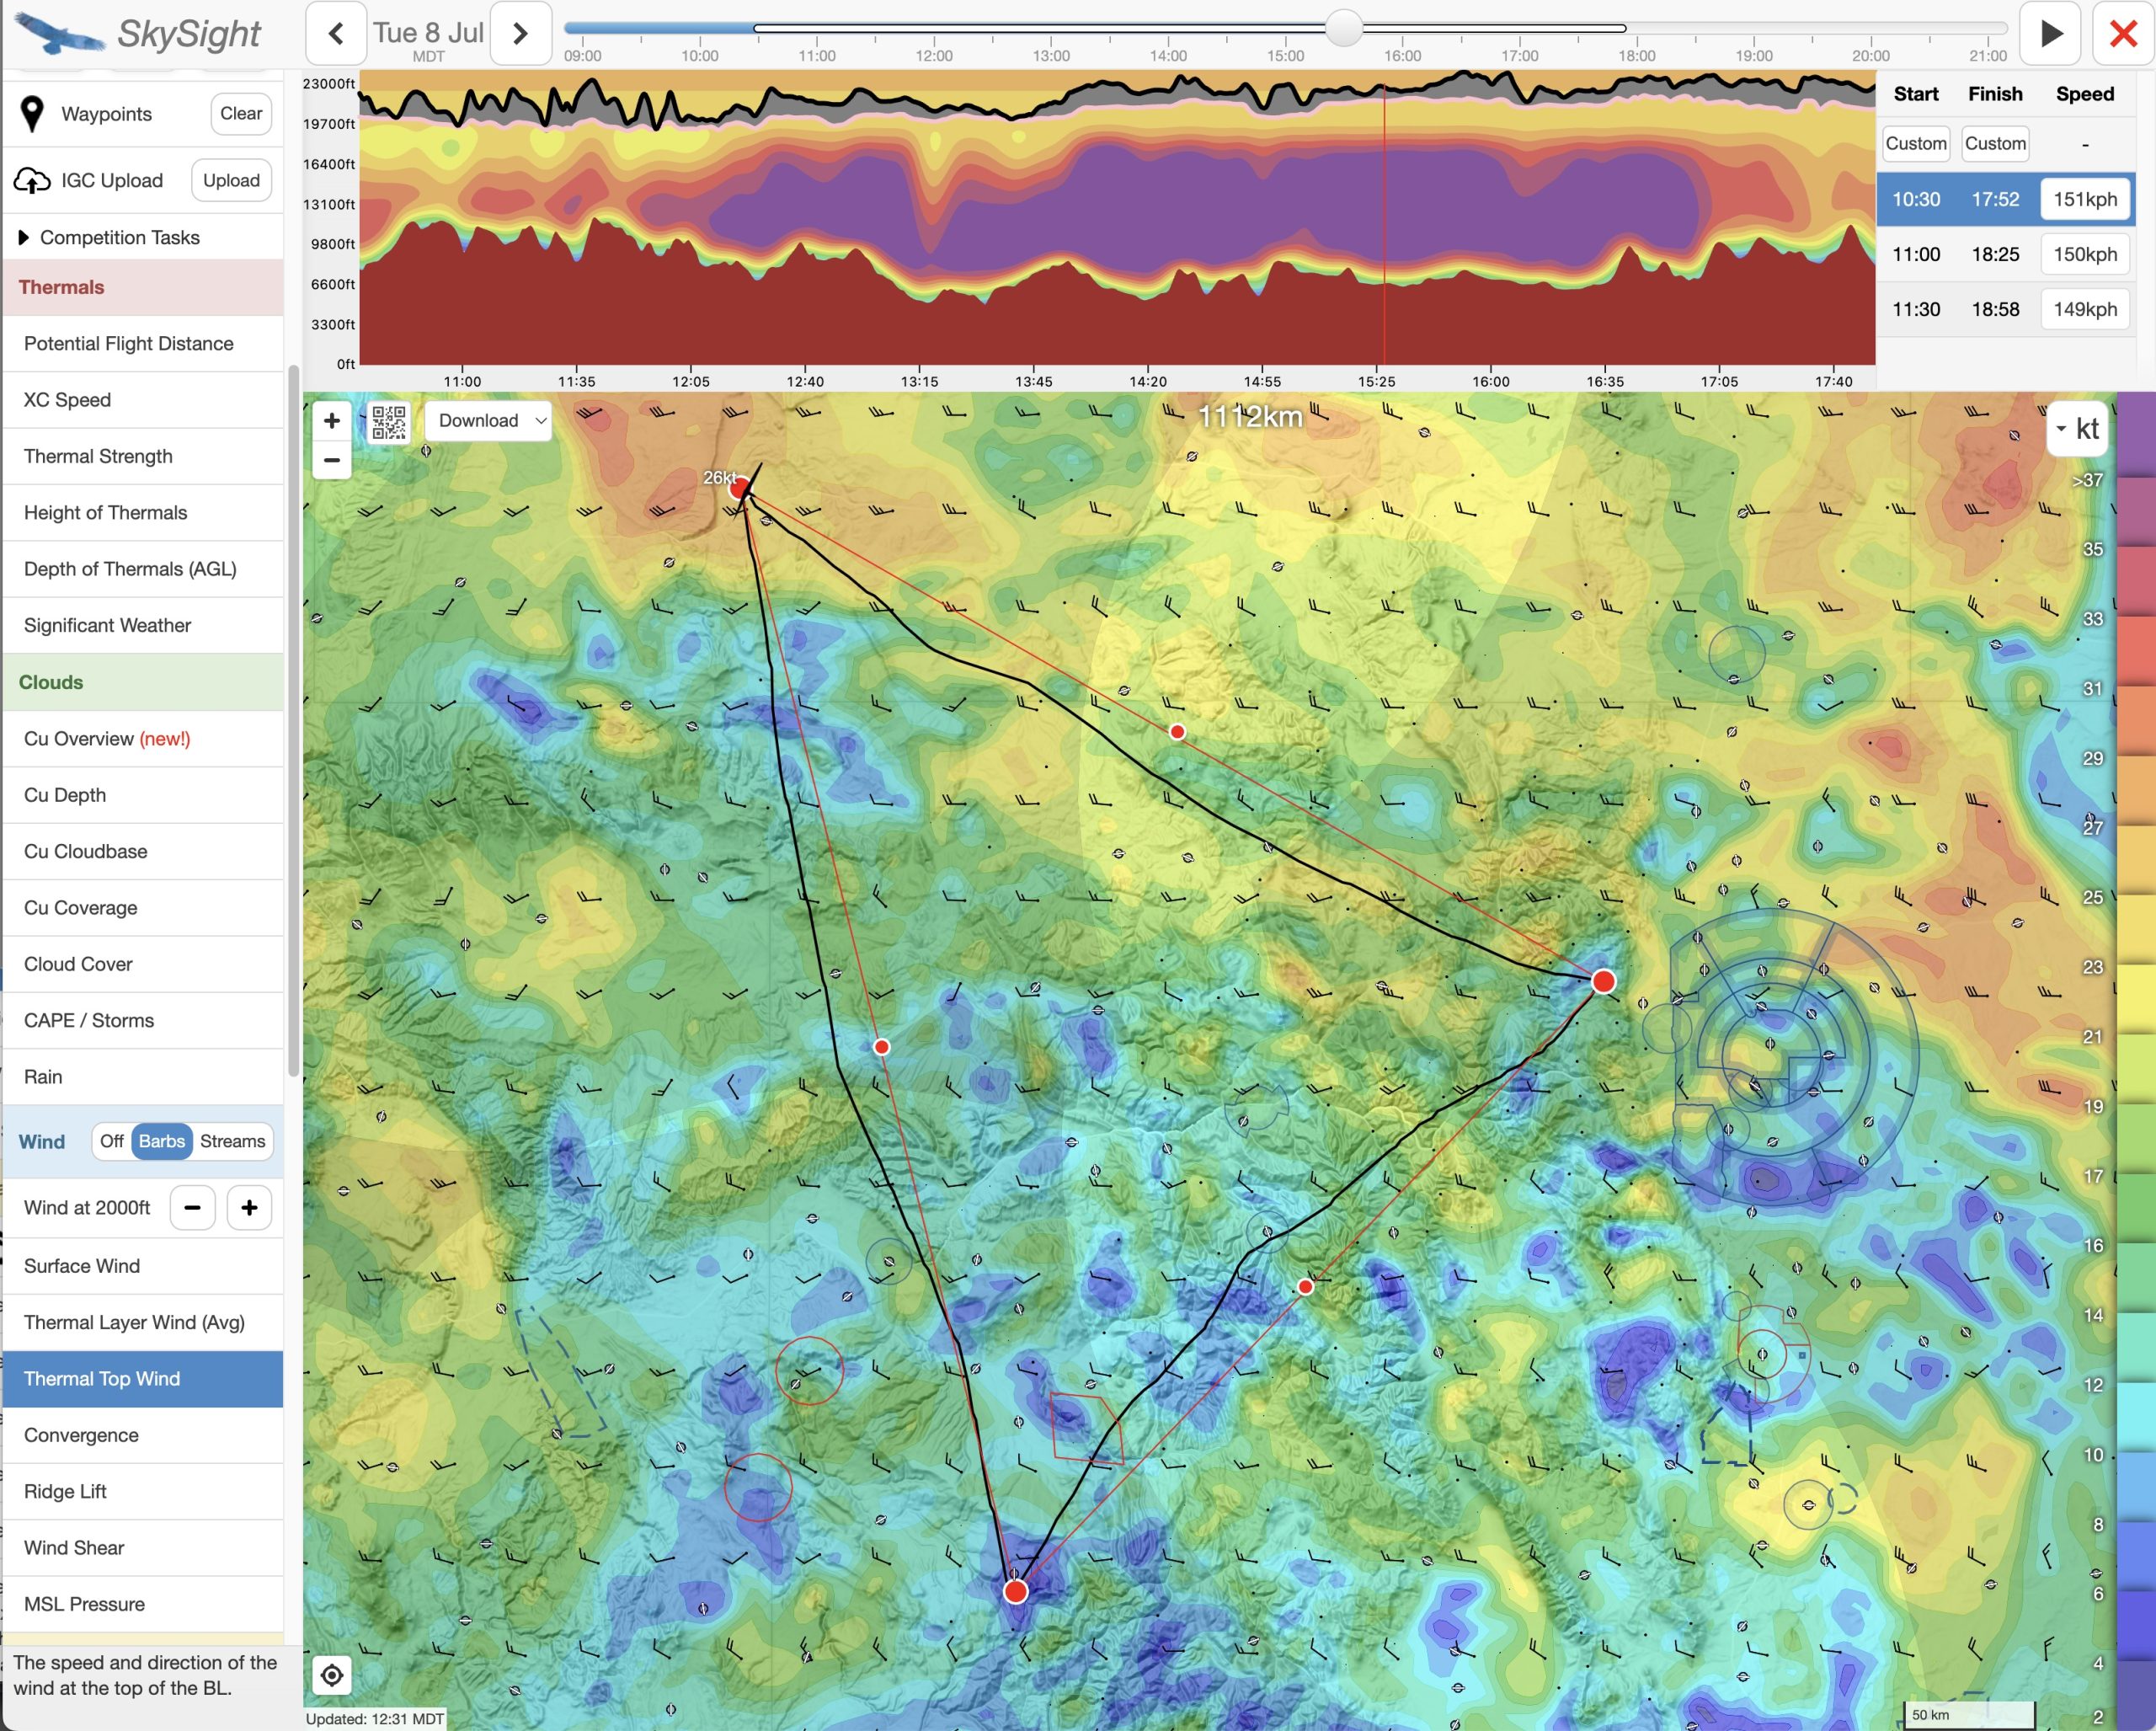
5. Wind Direction and Wind Speed

Wind can play a big role in determining potential task speeds. When setting big triangle tasks it is important to consider the likely possibility that the wind speed and direction will vary in different parts of the task area.  Because of this, with all else being equal, flying a triangle in one direction will result in a different task speed than flying it in the other direction.

Whenever possible, I also try to avoid legs directly into a strong wind when or where thermals are weak (e.g. very early or late in the day).

Considering the wind speed is also very important for setting appropriate mental expectations of the attainable speed on each leg.

July 8 was forecast to be a light wind day. Skysight projected a modest headwind of 10-15 kt on Leg 1; a light cross wind from the west on Leg 2; and a potentially very helpful tailwind around 15 kt on Leg 3.  I was prepared for a relatively slow first leg (anything over 100 kph average would be acceptable to me given the head wind and the still weaker thermals).  Leg 2 would have to be fast as wind would not be a factor and thermals would be strong. I expected that Leg 3 could end up being the fastest (given the tailwind). (This would be very welcome but I wasn’t prepared to count on it).

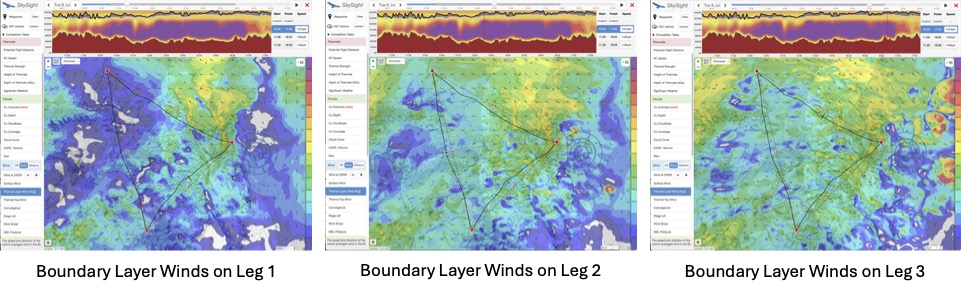
I also like to compare the forecast wind speed for the average of the boundary layer with the forecast wind speed for the top of the boundary layer.

Sometimes the difference is marginal, sometimes it is very significant.  If wind speeds at the top of the boundary layer are much higher than for the boundary layer on average, this means that I want to stay very high when flying with a tail wind, and I plan to stay a little lower when flying into a head wind (provided that this can be done safely).
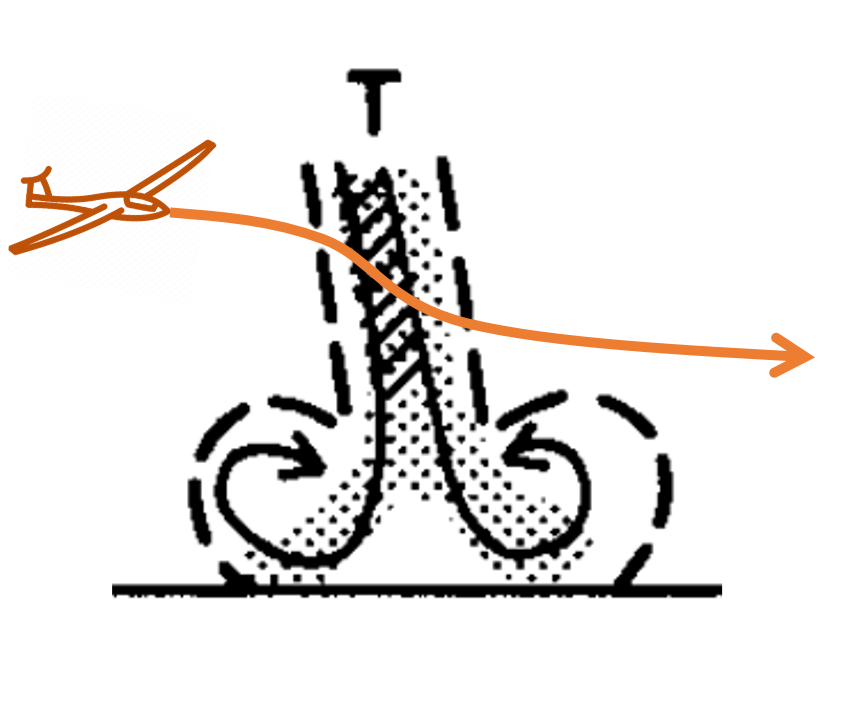
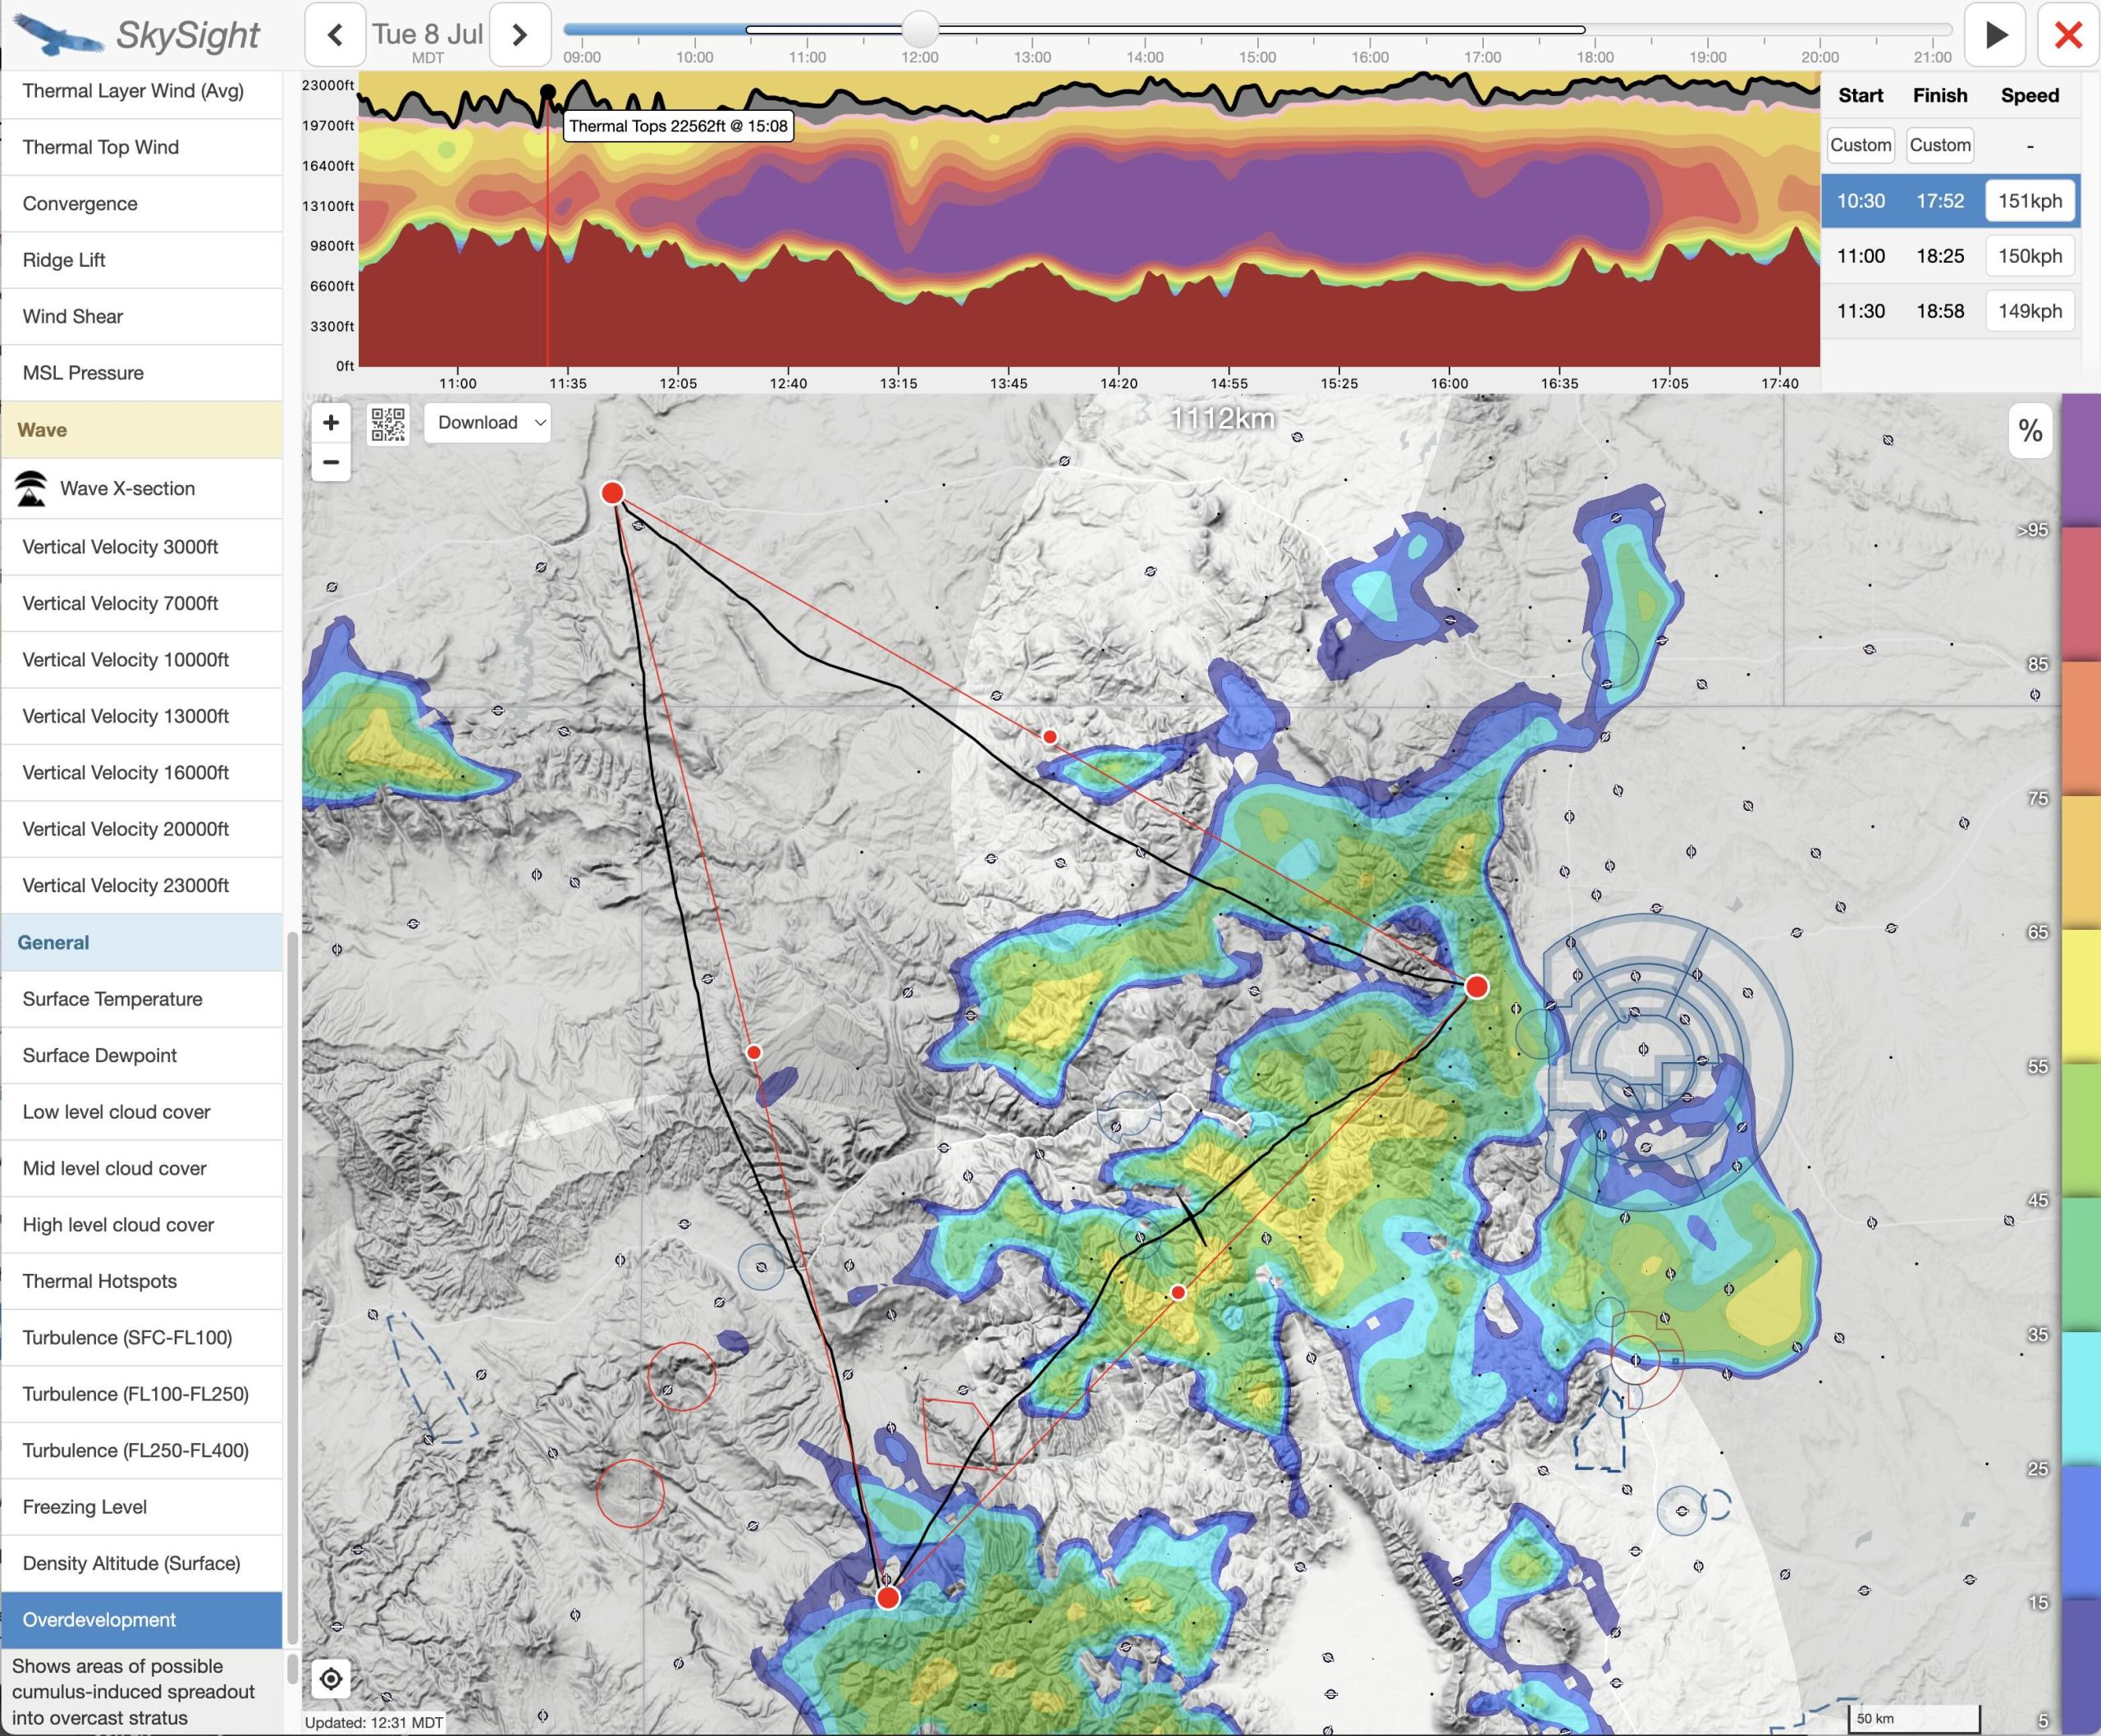
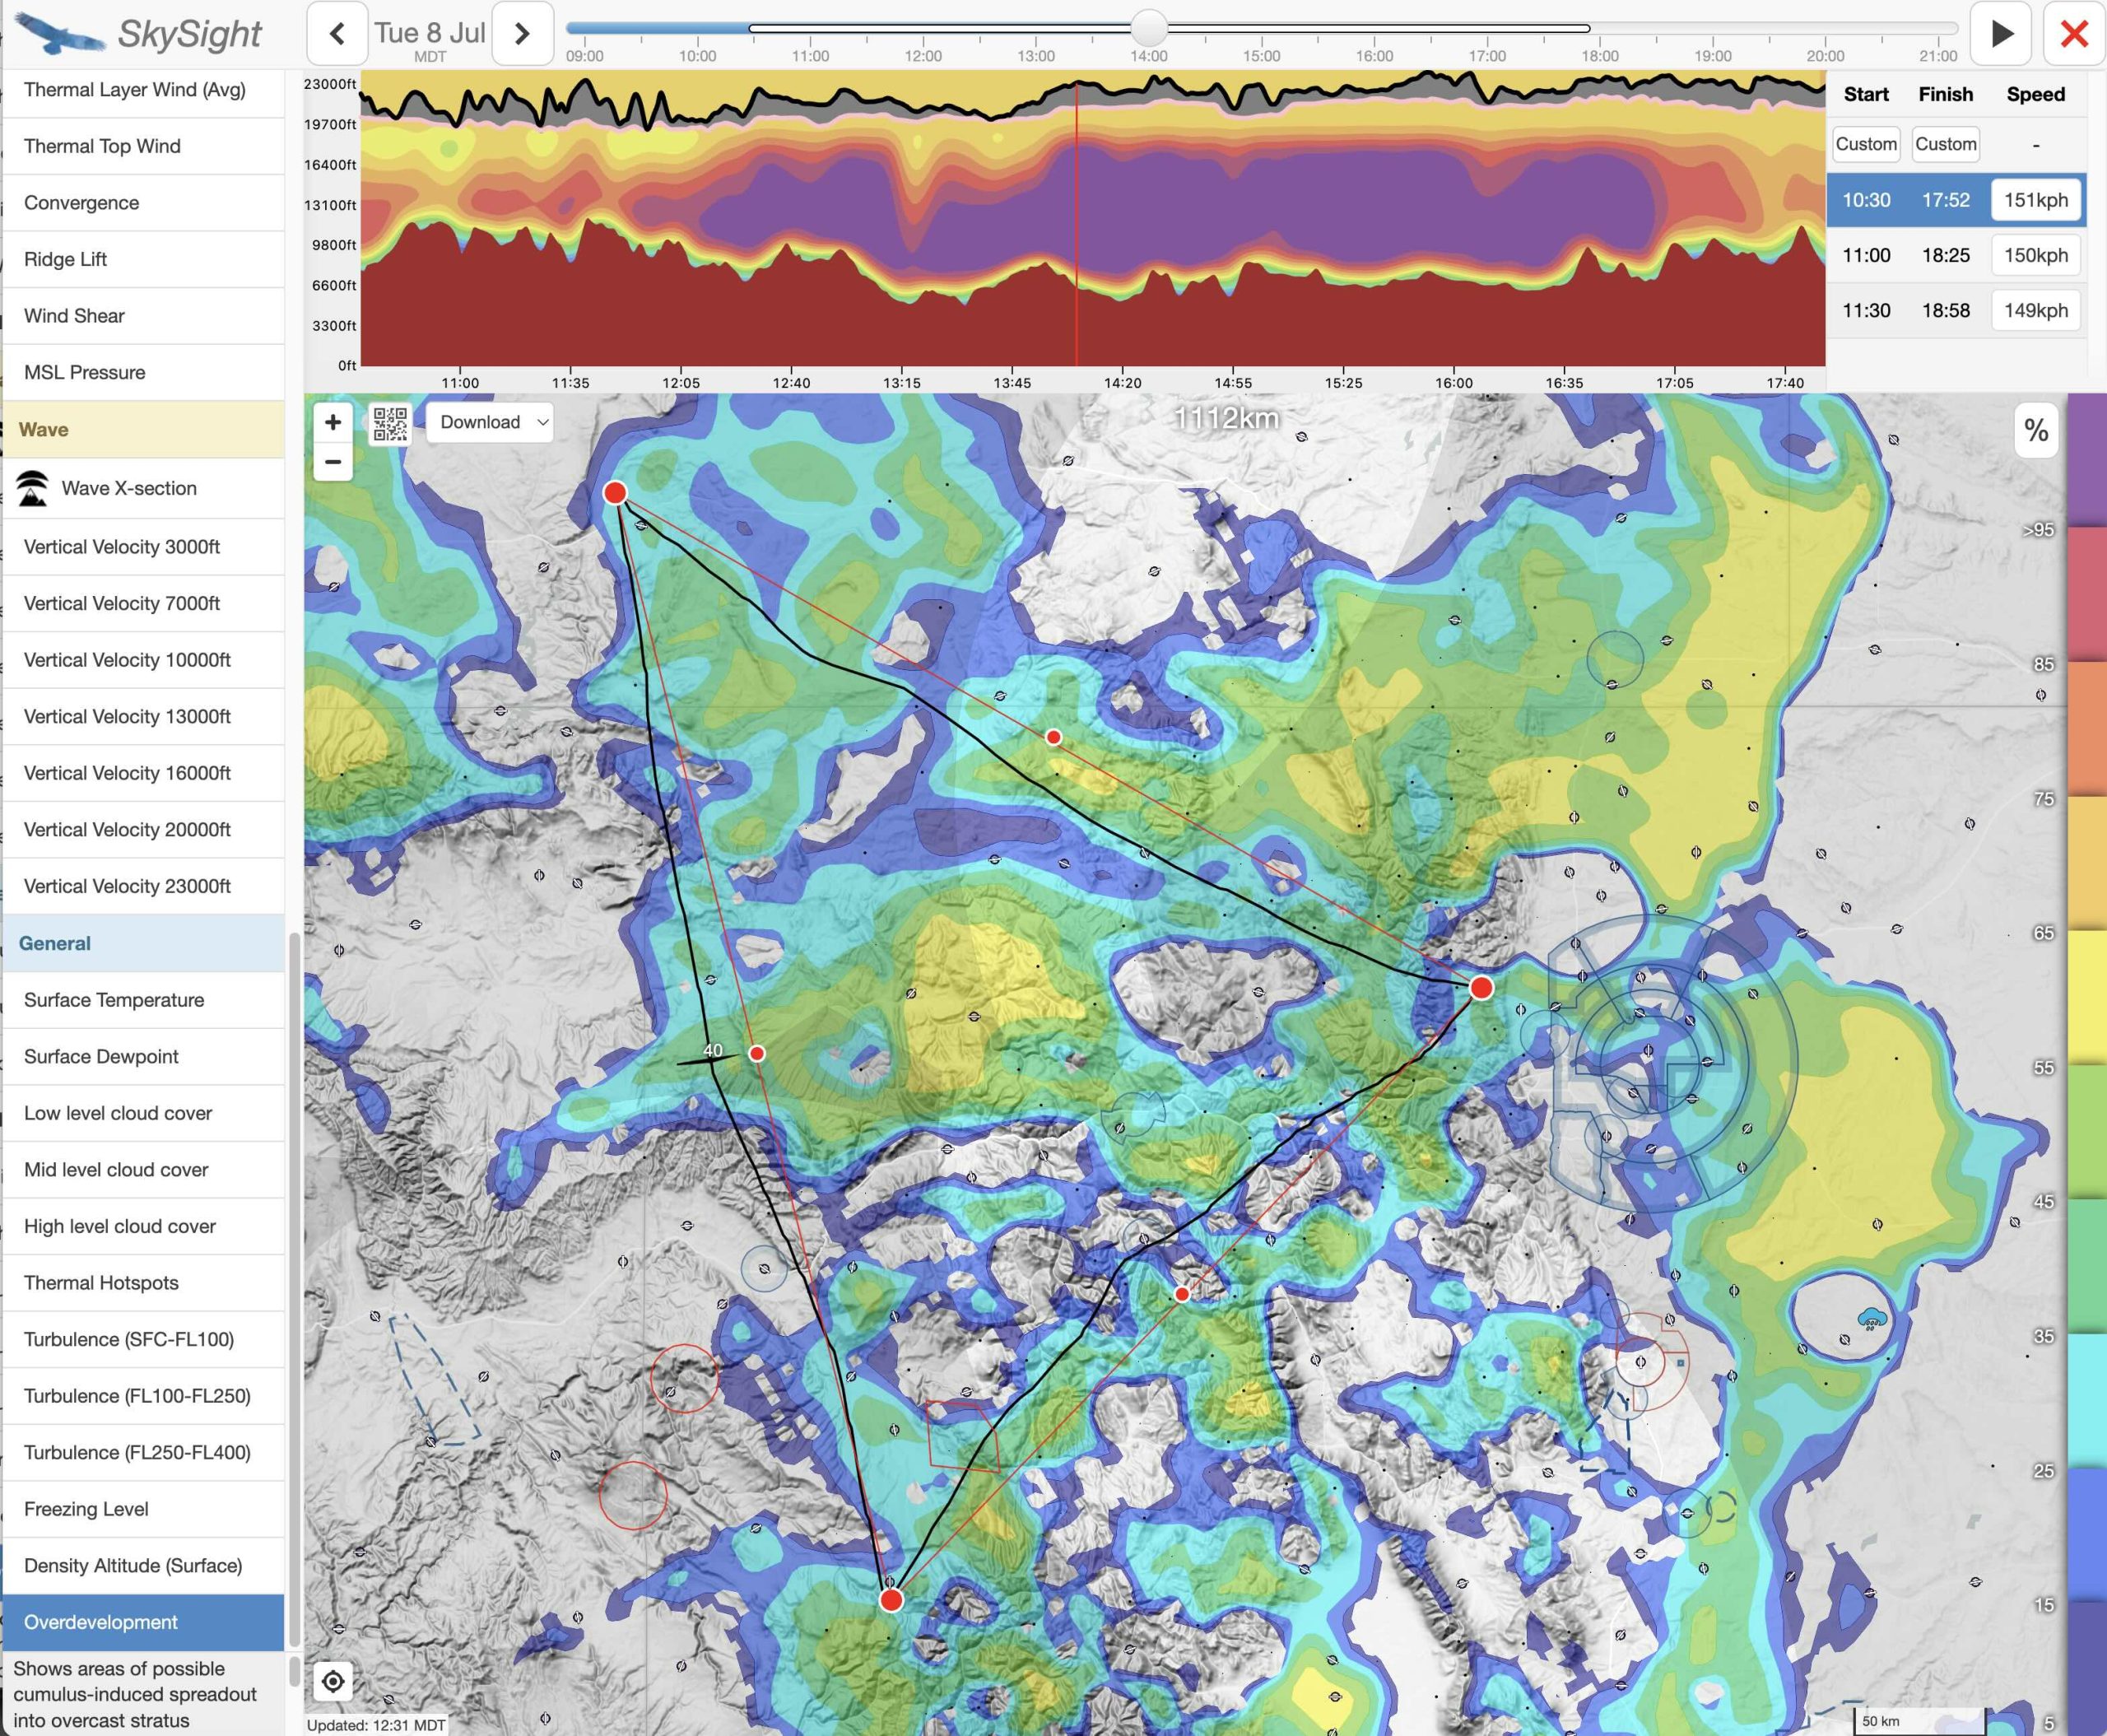
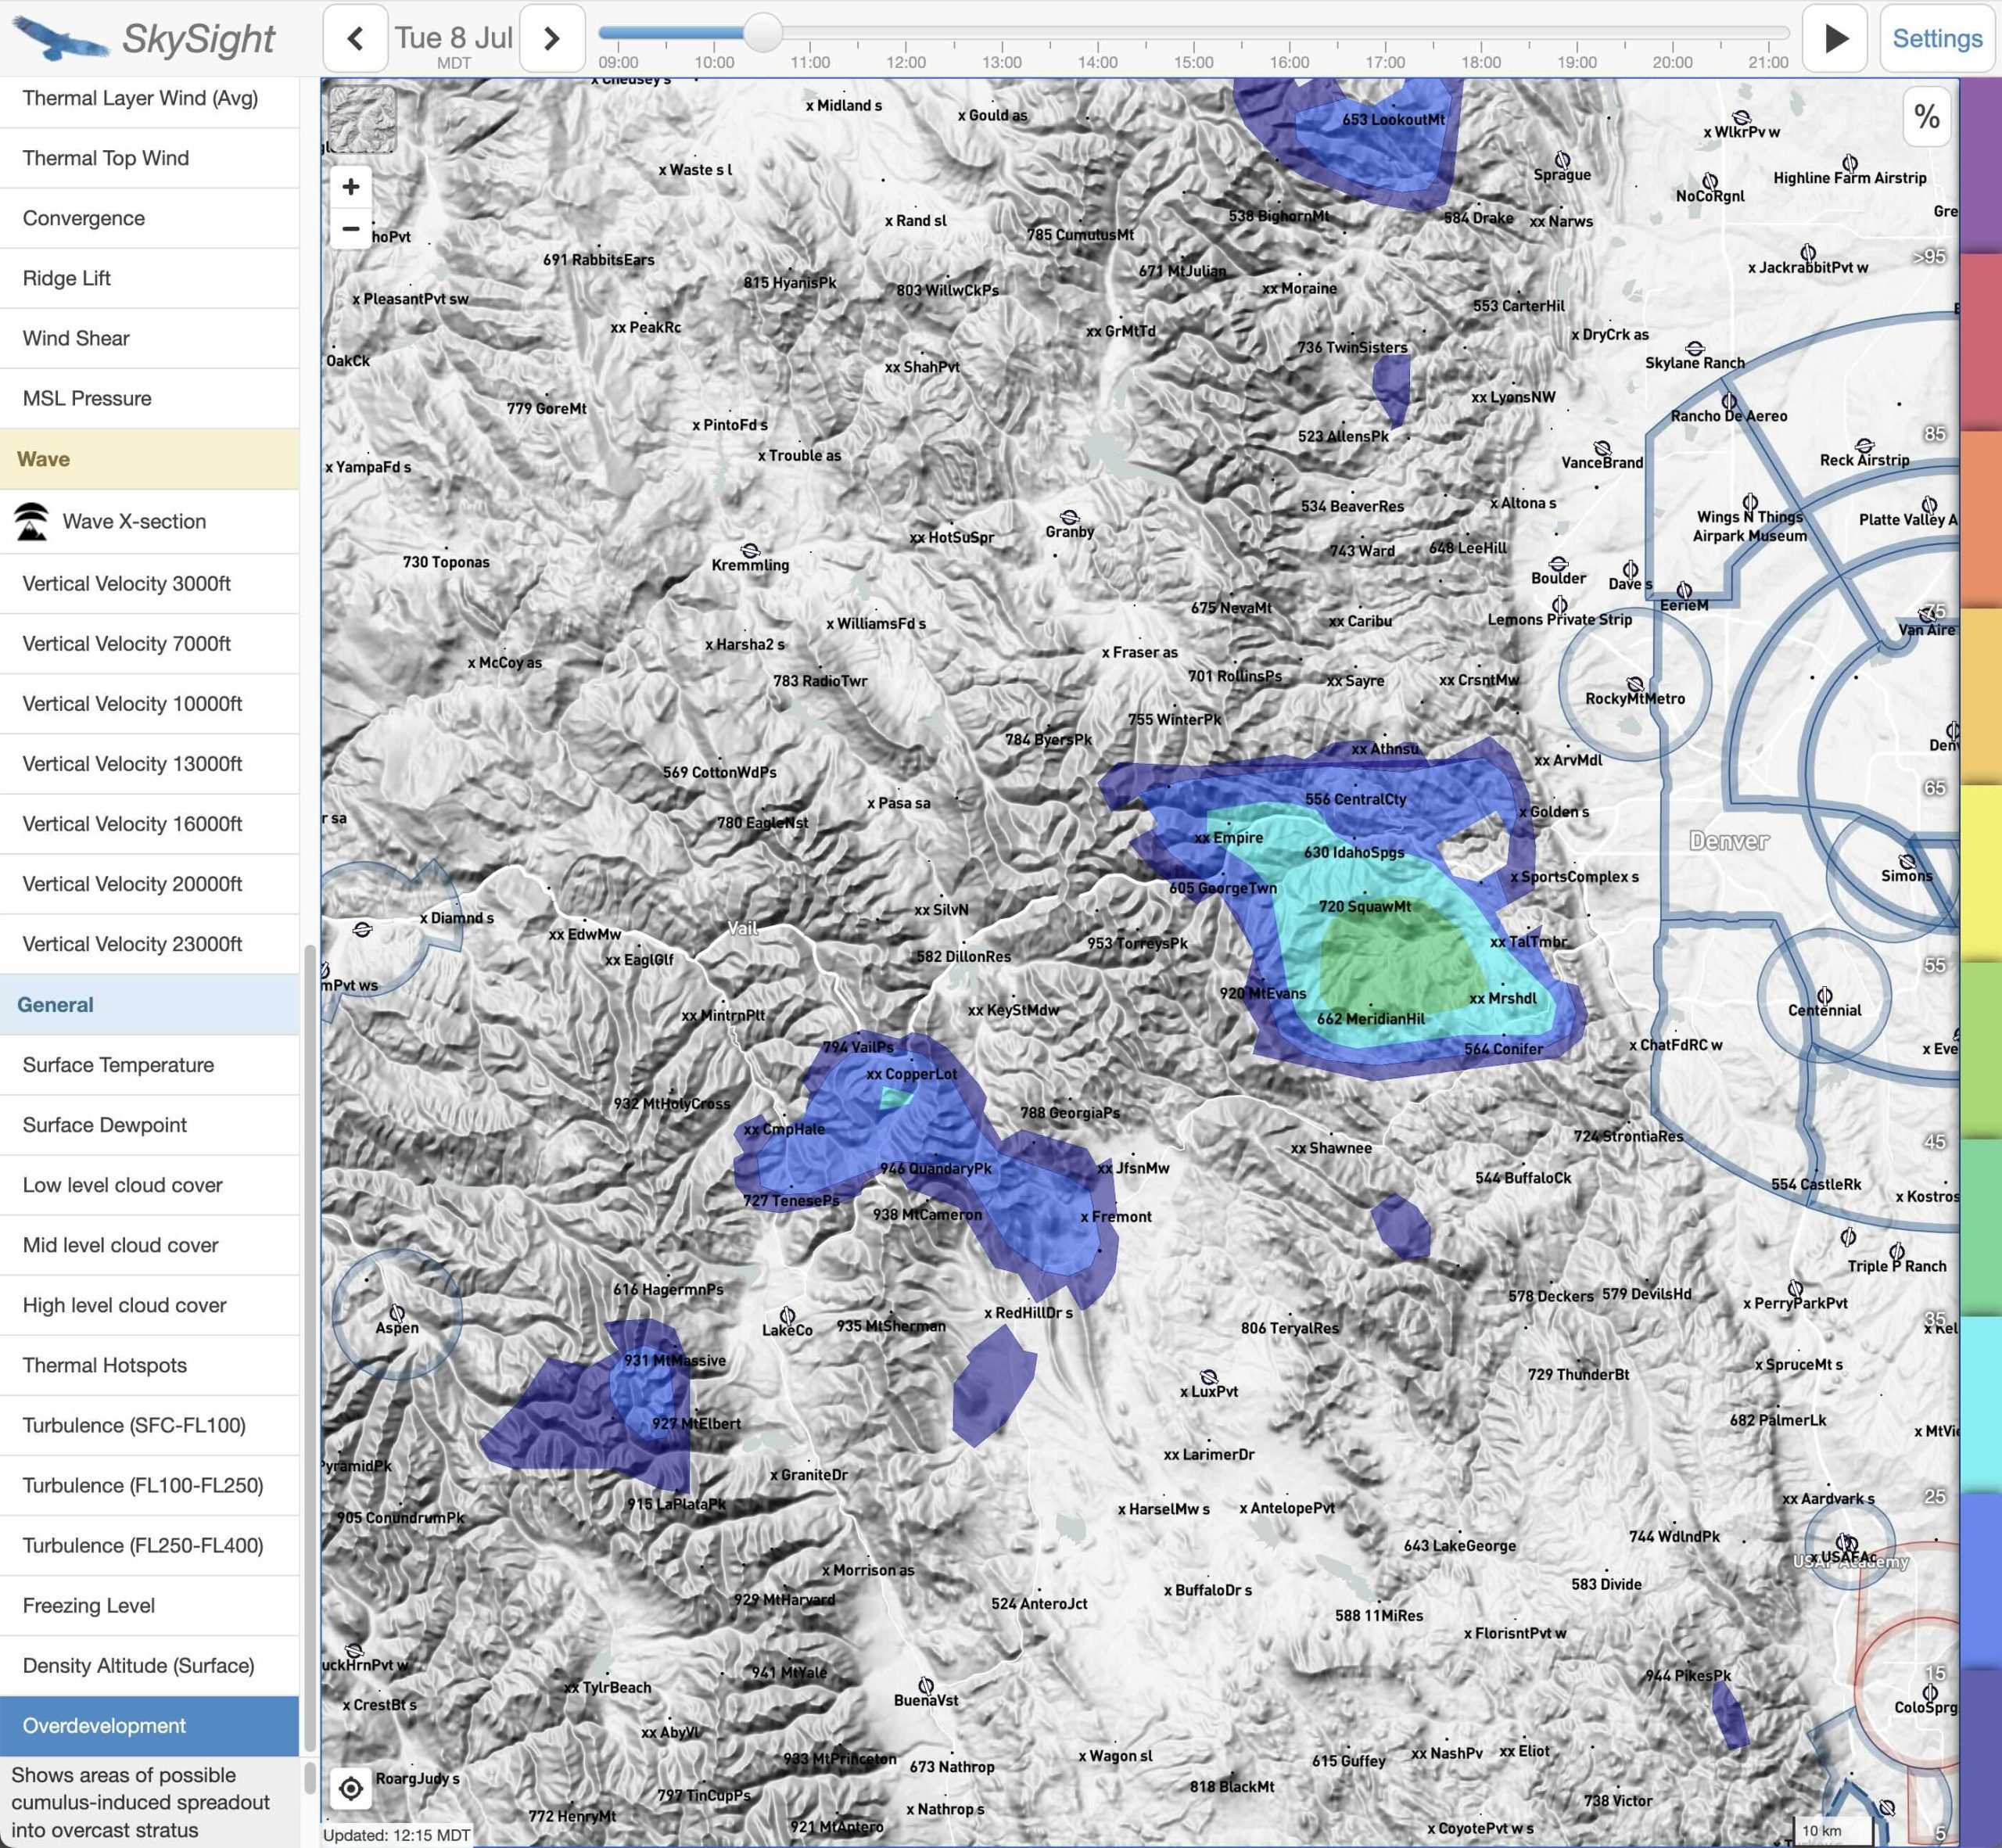
The winds at the top of the boundary layer were also forecast to be modest overall. However, staying high on Leg 3 could a real boost to my speed when it would be most welcome.
6. Overdevelopment

Overdevelopment is a tricky thing.  A little bit of it tends to be good because it characterizes a somewhat unstable airmass and good thermal strength.  But get too much of it and it quickly become a problem: clouds spread out, making it harder to find the lift; virga and rain cells form, forcing detours; and overshading of the ground suppresses new thermal development.  Add even a little bit more, and there could be thunderstorms and gust fronts – real safety concerns.

Our experience tells us that overdevelopment usually gets worse during the day.  I want to draw attention to the fact that this is not always the case.  Sometimes an airmass will gradually dry out as air temperatures increase, reducing the prevalence of overdevelopment throughout the day rather than increasing it.  Such days – although somewhat rare – are often the best for very long flights because they tend to start very early without blowing up later.

Furthermore, long tasks almost always involve flying through air masses with different characteristics.  Some air masses may be prone to overdevelopment while others are not.  When you find yourself surrounded by virga cellls and showers it is easy to assume that everywhere else is just like that even though conditions 50 kilometers further on along the course might look much better.

In my experience, Skysight tends to under-forecast cloud development and therefore also under-forecasts overdevelopment – at least in the Western US.  Even if there is only a small chance of OD forecast, I expect some virga to appear.  Once Skysight suggests 50% or more chance of OD at a particular time, a safe soaring flight through such an area may not be possible.

For the flight on July 8, the potential for (too much) overdevelopment was my top concern.

OD was forecast to be an issue even on the first leg in the morning.  To deal with this, I would plan to launch as soon as possible to make it past the area where OD was forecast early.  But what would I need to expect on Leg 2?
The OD forecast for Leg 2 looked quite reasonable.  A little bit can be helpful and the forecast showed drier conditions to the west of the course line.  This suggested to me that heading north at the edge of overdevelopment would not only be possible, but likely fast, especially with the sun in the west at this time of day. But looking at Leg 3 I worried that it might become a problem later in the afternoon. The only potentially problematic area could be to the north of Grand Junction, where I might face a line of OD that I may have to push through.
To my relief, the forecast suggested that OD would peak on Leg 3 by 3PM and then start to diminish.  If this forecast would hold, Leg 3 would provide near perfect conditions for a speedy return.  It would also be safe: this was my #1 consideration because the first 90 miles of Leg 3 (between the airports of Rock Springs, WY and Dixon, WY) would be over totally unlandable, rocky, desolate, and uninhabited desert terrain.

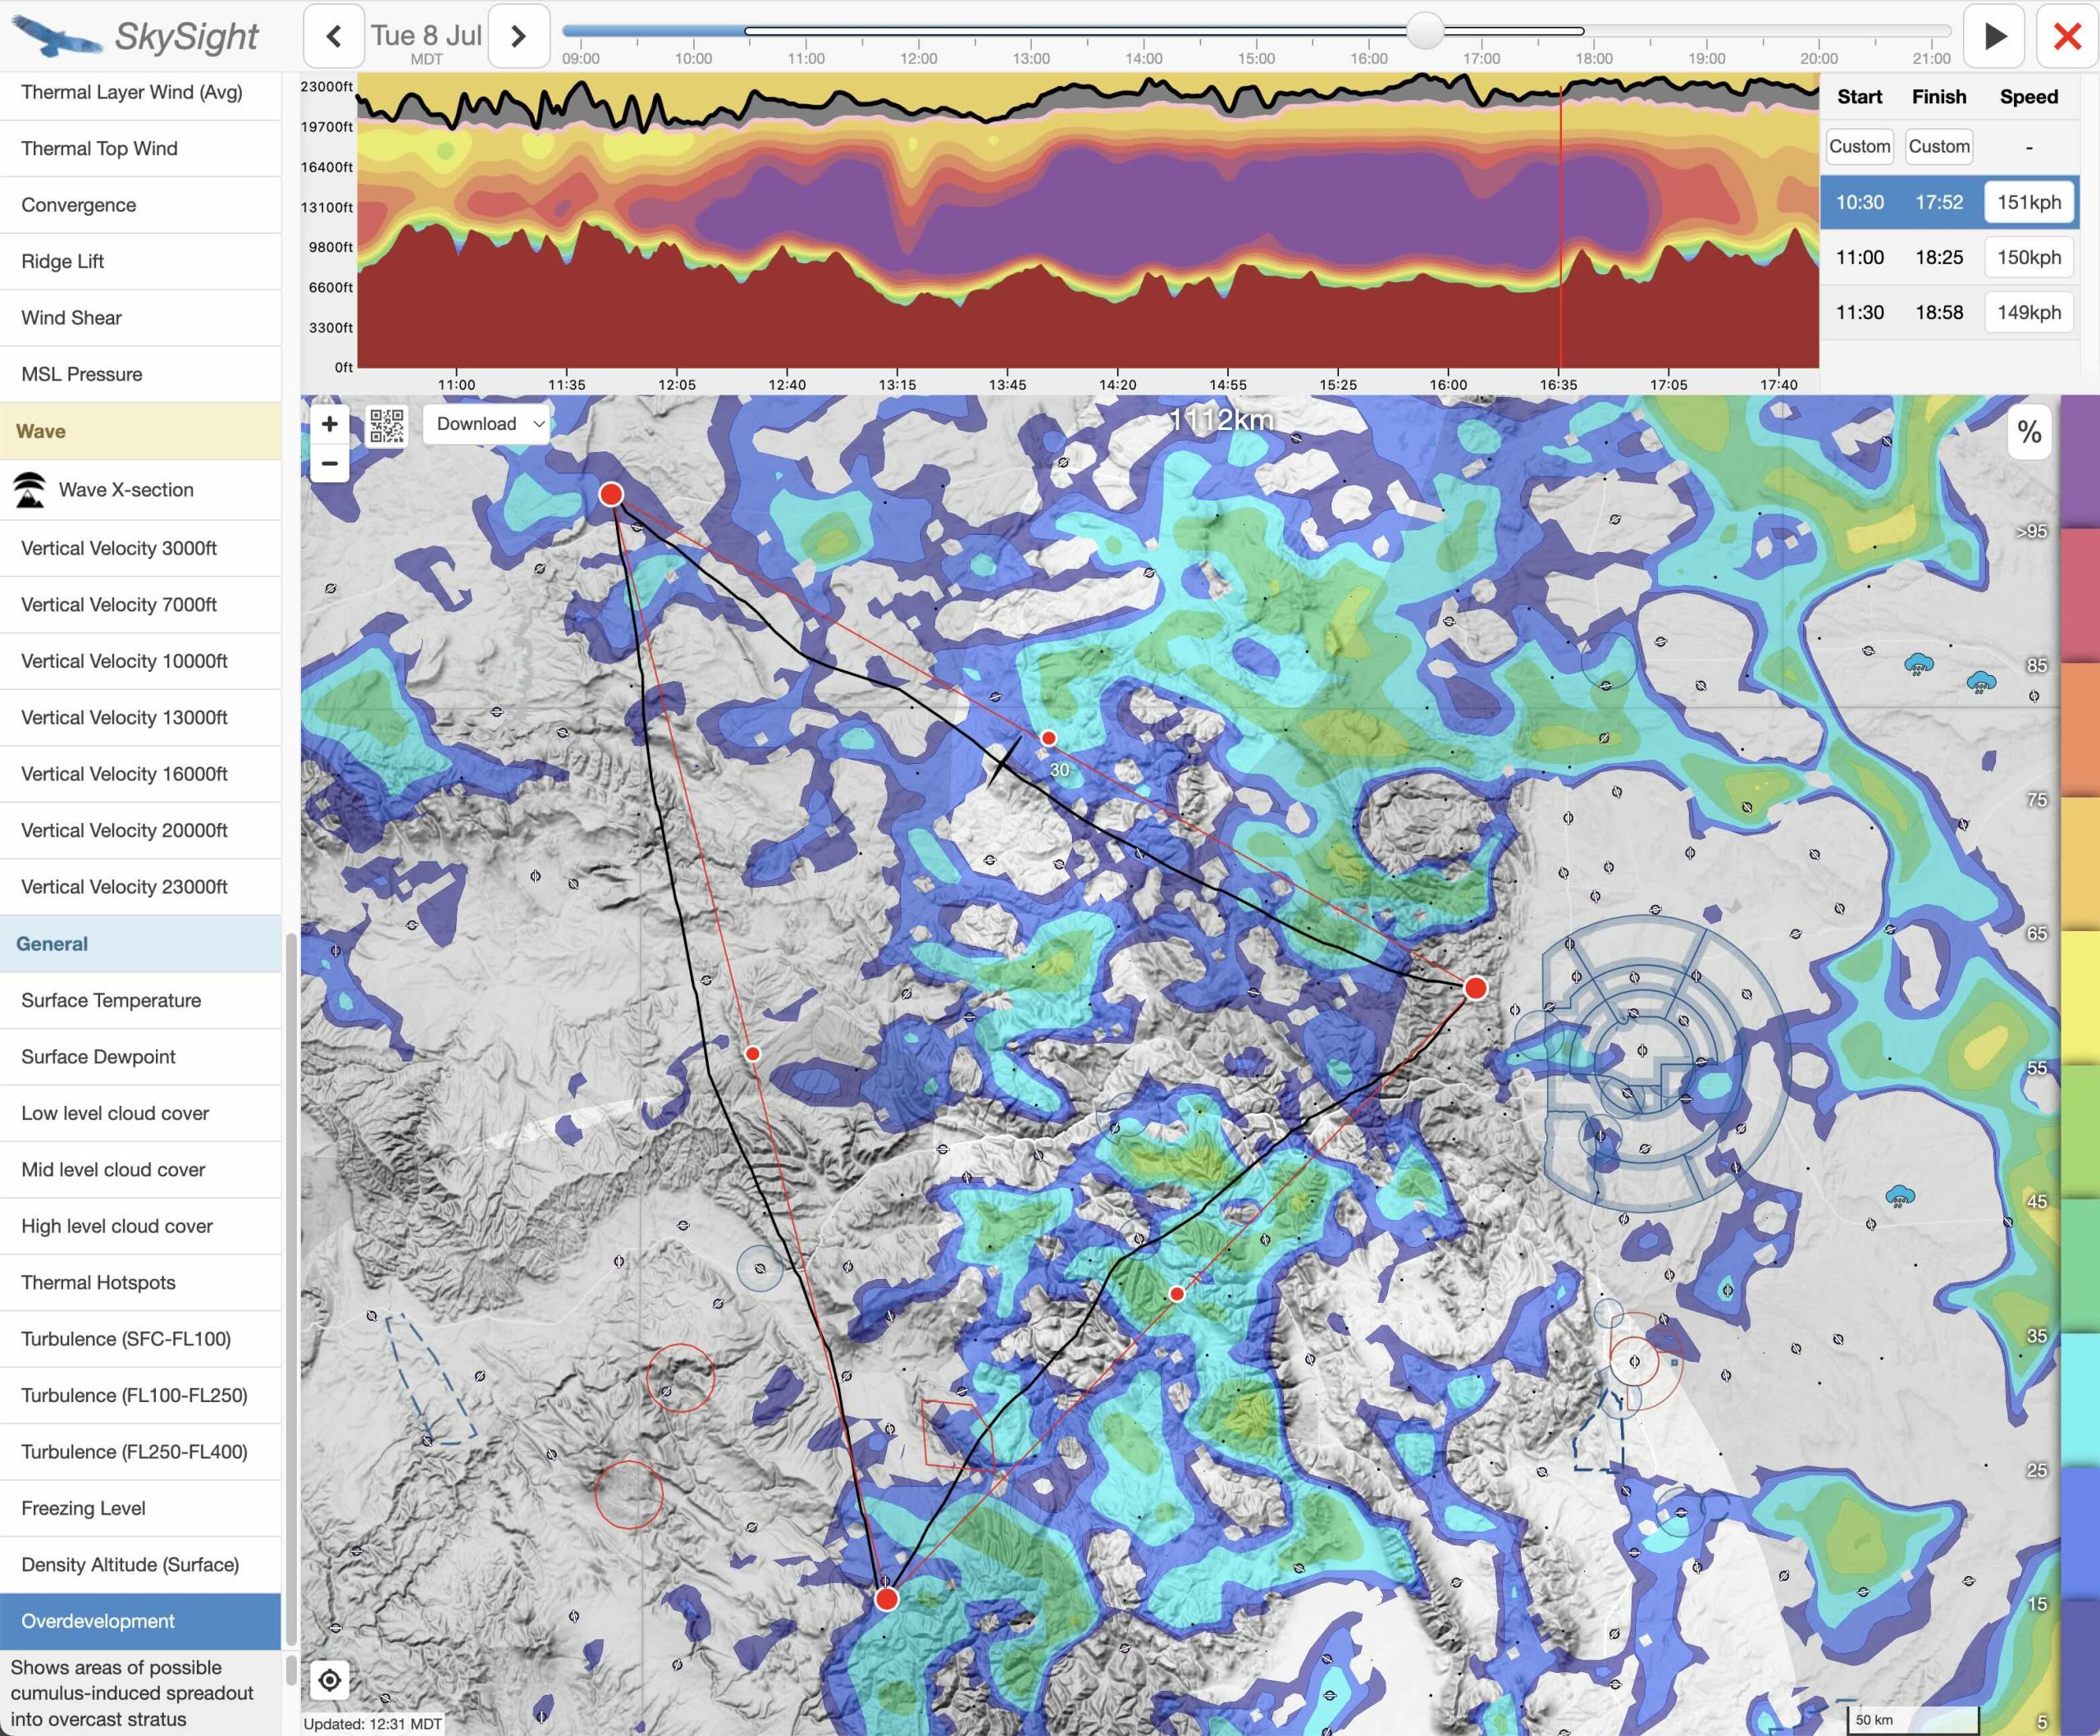
My careful preparation for the eventuality of OD proved crucial in the execution of the flight as we shall see later.

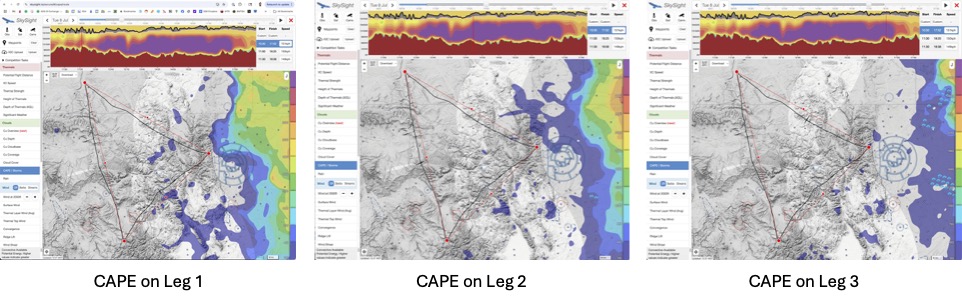
7. CAPE Index and Significant Weather

I also take a quick look at the CAPE (Convective Available Potential Energy) Index which measures the propensity for vertical development and thunderstorms. I want to see as little of it as possible because even values as low as 250-400 Joules can be an indication of severe thunderstorm activity in the mountains.

The CAPE forecast only shows a propensity for severe storms over the plains east of Denver while the task area is largely free of any elevated levels. (Ideally I prefer to see no blue markings at all.)

Sometimes, I also double check the “Significant Weather” chart but this is mostly to ensure that I have not overlooked anything.

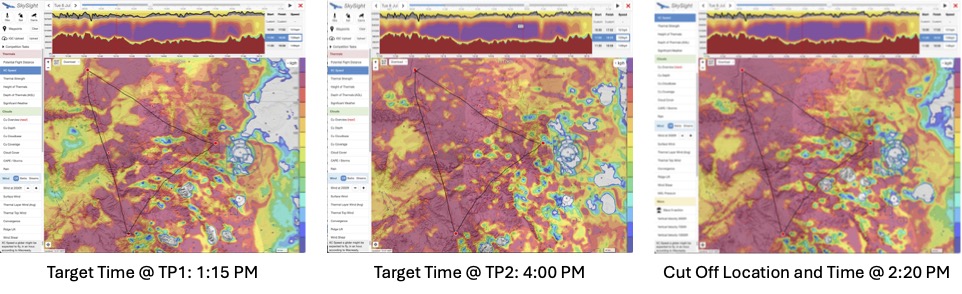
8. Turn-Point and Cut-Off Timing

Finally, with very long flights it’s important to have a time plan to know whether it makes sense to keep going before time is running out.

For me, this is usually as simple as setting a target time for reaching each turn point, and a point and time where I would decide to cut the flight short if I fall behind schedule.

For triangles, the cut off point and location is typically somewhere along the second leg at a point where it would become obvious that I can’t reach the last turn point on schedule.  (This is where the advantage of triangles that have the Start/Finish Point along one of the legs becomes obvious: they allow for a much later cut-off point than triangles that have the Start/Finish at a corner. )

For long Out and Returns, I simply set a latest turn-around time:  if I don’t reach my turnpoint by that time, I commit to giving up on the task and turning around.

Doing this type of planning at home is important because it avoids that I have to do the mental math in the cockpit when all my concentration should be focused on flying well.  It also gives me the confidence to keep going all the way to the last turn-point provided that I am still on schedule (and as long as there aren’t any unanticipated problems along the course ahead.)

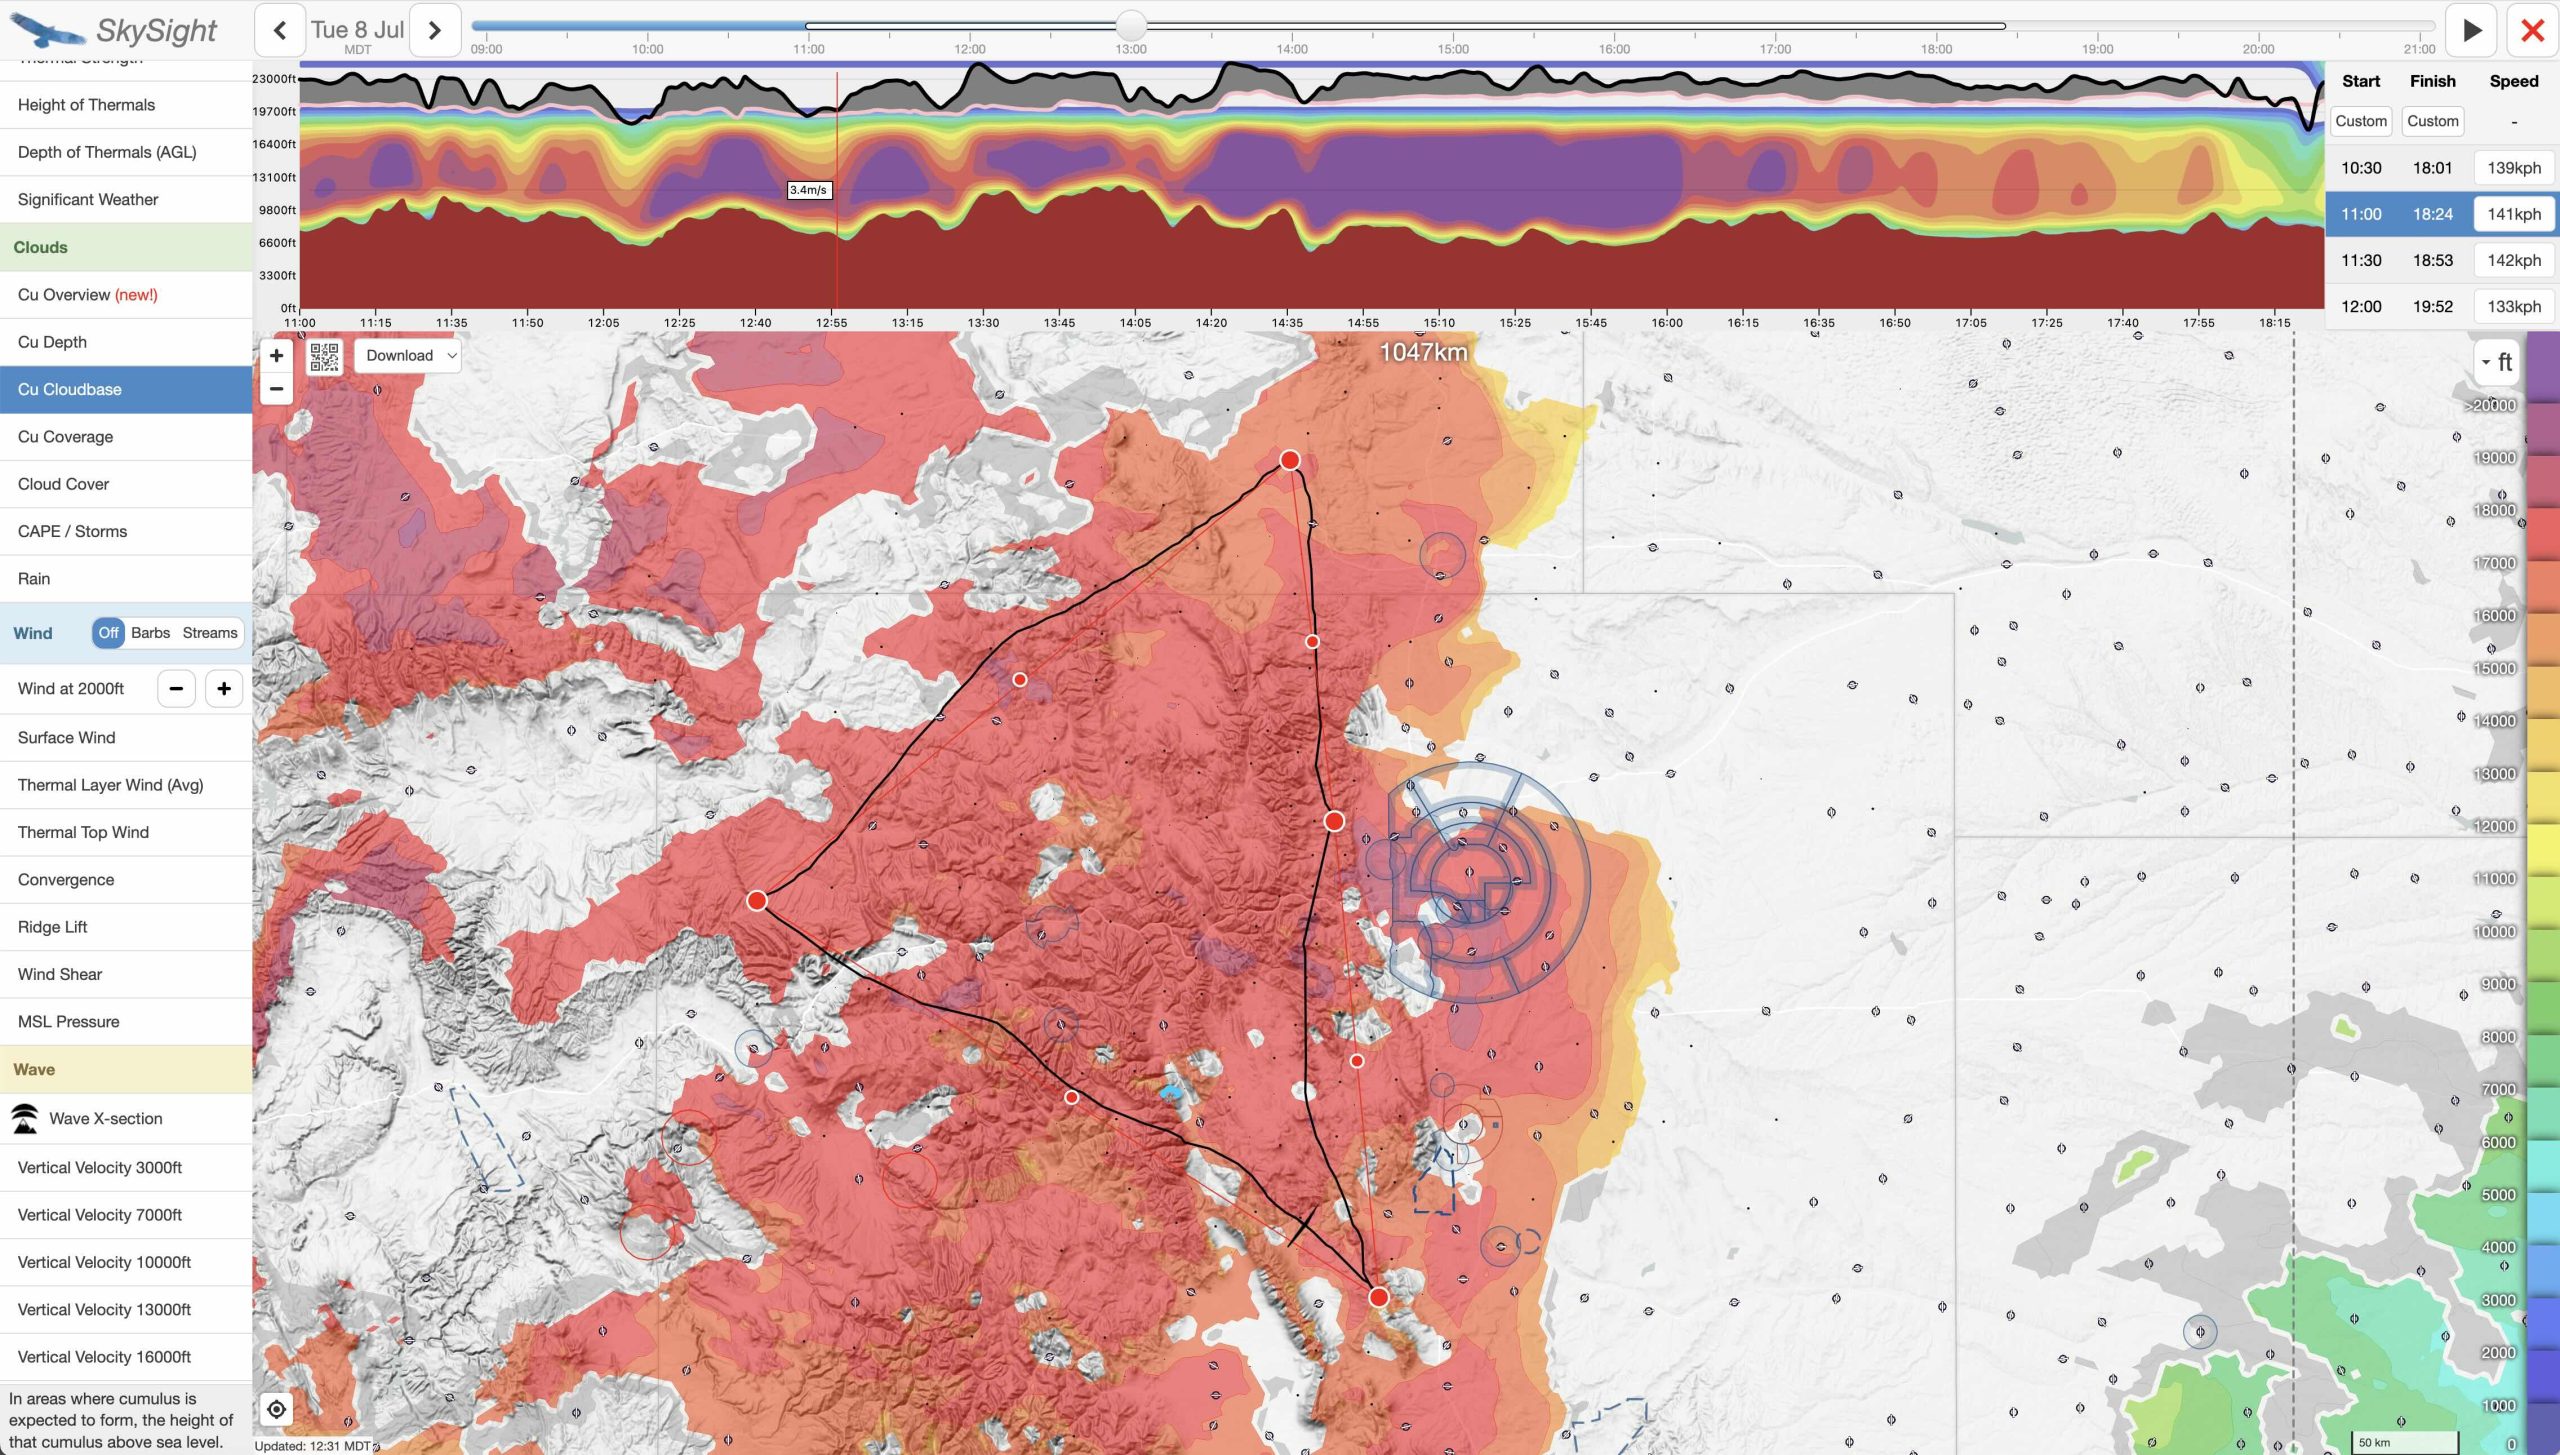
With Skysight, the tool to use for this is simply the Route Planning tool.  I usually pick the second to last possible start time that Skysight suggests for my task and then move my glider icon around the track, taking note of the time when each turn point should be reached.  For the cut-off point, I pick a recognizable point along the second leg from where it should be relatively easy to head home directly, and take a note of the time that I have to reach this point to stay on schedule.

(Note: I don’t like picking the last possible start time for this exercise because I would be committing myself to flying as fast as Skysight considers possible – something that rarely works.)

Using the methodology described above I established target times for turn points 1 and 2, and a cut off time along the second leg at 2:20PM by which time I wanted to reach the high ground north of Grand Junction (at the so called “Book Cliffs”), where the greatest potential for overdevelopment on Leg 2 was forecast. If I would not reach the Book Cliffs in time, and if the remainder of the course would look problematic, I would break off my task and head towards home.

Step 4: Stress Testing the Route

If I’ve done Step 3 well, I should already be well prepared and ready to go.  However, especially with very long flights that require a high average speed for successful completion, it helps to look for potential problems that may arise along the way, and to form a mitigation plan should the problems be worse than anticipated.

1. More OD and Storms Than Predicted

Given Skysight’s propensity for under-forecasting clouds and OD I try to determine where this could become a real issue along the course and what I would do if this is the case.

That’s important for safety reasons because increasing OD and/or storms might mean that simply turning around and heading back home may not be possible.  So I ask myself if there is an alternative and safer way to make it back, or if I have to make plans to land someplace else and possibly spend the night.

Since storms are not just a sporting risk but a safety risk (more about this distinction), I also check the weather forecasts for important airports along my flight route using tools other than Skysight.  This will strengthen (or weaken) my confidence in the Skysight forecast, and it helps me understand if there will be safe places to land along my route should I have to break off the flight.

My favorite tool for this is meteoblue.com because it is based on many weather models and provides predictability ratings for each point forecast.  Low predictability means that the various weather models disagree with one another.  Days with low predictability are usually not well suited for very long flights. The “multi-model” view then allows me to dig deeper if necessary and helps me understand if storms could become a real safety threat, especially late in the day.  In addition to airports, I usually also pick one or two points along the final leg of my route to see if storms are likely a real concern on the way home. (E.g. when I expect to come back from the northwest across the Continental Divide, I might check the forecast for Longs Peak and Estes Park; from the southwest I may check the forecast for Mount Evans and Idaho Springs, etc.)

2. More Blue Sky Than Predicted

The inverse could also be the case such that there will be fewer clouds than anticipated.  To be prepared for this I look for the forecast thermal heights and thermal strength over areas near the task line that actually are predicted to be blue.

This helps me anticipate whether a lack of clouds would just indicate a dryer airmass (where I could still anticipate to find good lift in the blue), or whether it would suggest a problem with thermal development in general (e.g. a strong inversion, weaker thermals and/or lower thermal heights).  The former would just slow me down somewhat (as long as flight safety is not compromised), the latter would suggest that the task as planned may not work at all on that particular day.

If there may be big blue gaps with no lift at all (e.g. when crossing an area with a strong inversion layer below), I try to plan ahead of time to understand if climbing up high before such gaps will allow for a safe and successful transition using a long glide near the best glide speed considering the expected wind.  (E.g., in Colorado, the transition from South Park to the Wet Mountains early in the day is an example where this strategy can be quite successful, and Skysight is usually quite accurately forecasting the width of the gap that should be anticipated as well as any helping tailwind or hurting headwind.)

3. High Clouds

If high clouds move into the task area, they can shield the ground from the sun and cut off thermal development.  The exact extent, position, and thickness of high clouds is not easy to accurately predict.  If any high clouds are forecast in the task areas it is good to watch out for them an be prepared.  On my first 1000km triangle flight in Colorado, high clouds were my biggest problem.   I also had not looked for their likelihood in my task planning and they took me by surprise.  I have since made it a habit to check for the potential of high clouds ahead of time.  Using the time slider, it only takes a a few seconds to do so. (No high clouds were forecast for July 8 throughout the entire task area.)

4. Other Issues

Once on course there are obviously any number of other issues that one might encounter: the wind could be stronger than forecast causing broken thermals, the thermals could be weaker, the clouds lower, etc.   Such issues may make it impossible to complete a long task as planned.

If I have done my homework ahead of time, I am usually able to quickly recognize such discrepancies if they occur.  This helps me decide early if it makes sense to try to continue on task or whether it’s better to change my plan and make something else out of the flight.

Flight Execution

In this second part of the article, I recount the flight itself.  This is where it will become clear that the thorough flight preparation did not only help me pick the most appropriate task for the day but that it played a key role in in-flight decisions as well.  Especially, it gave me the confidence to keep going when things looked challenging or questionable ahead.
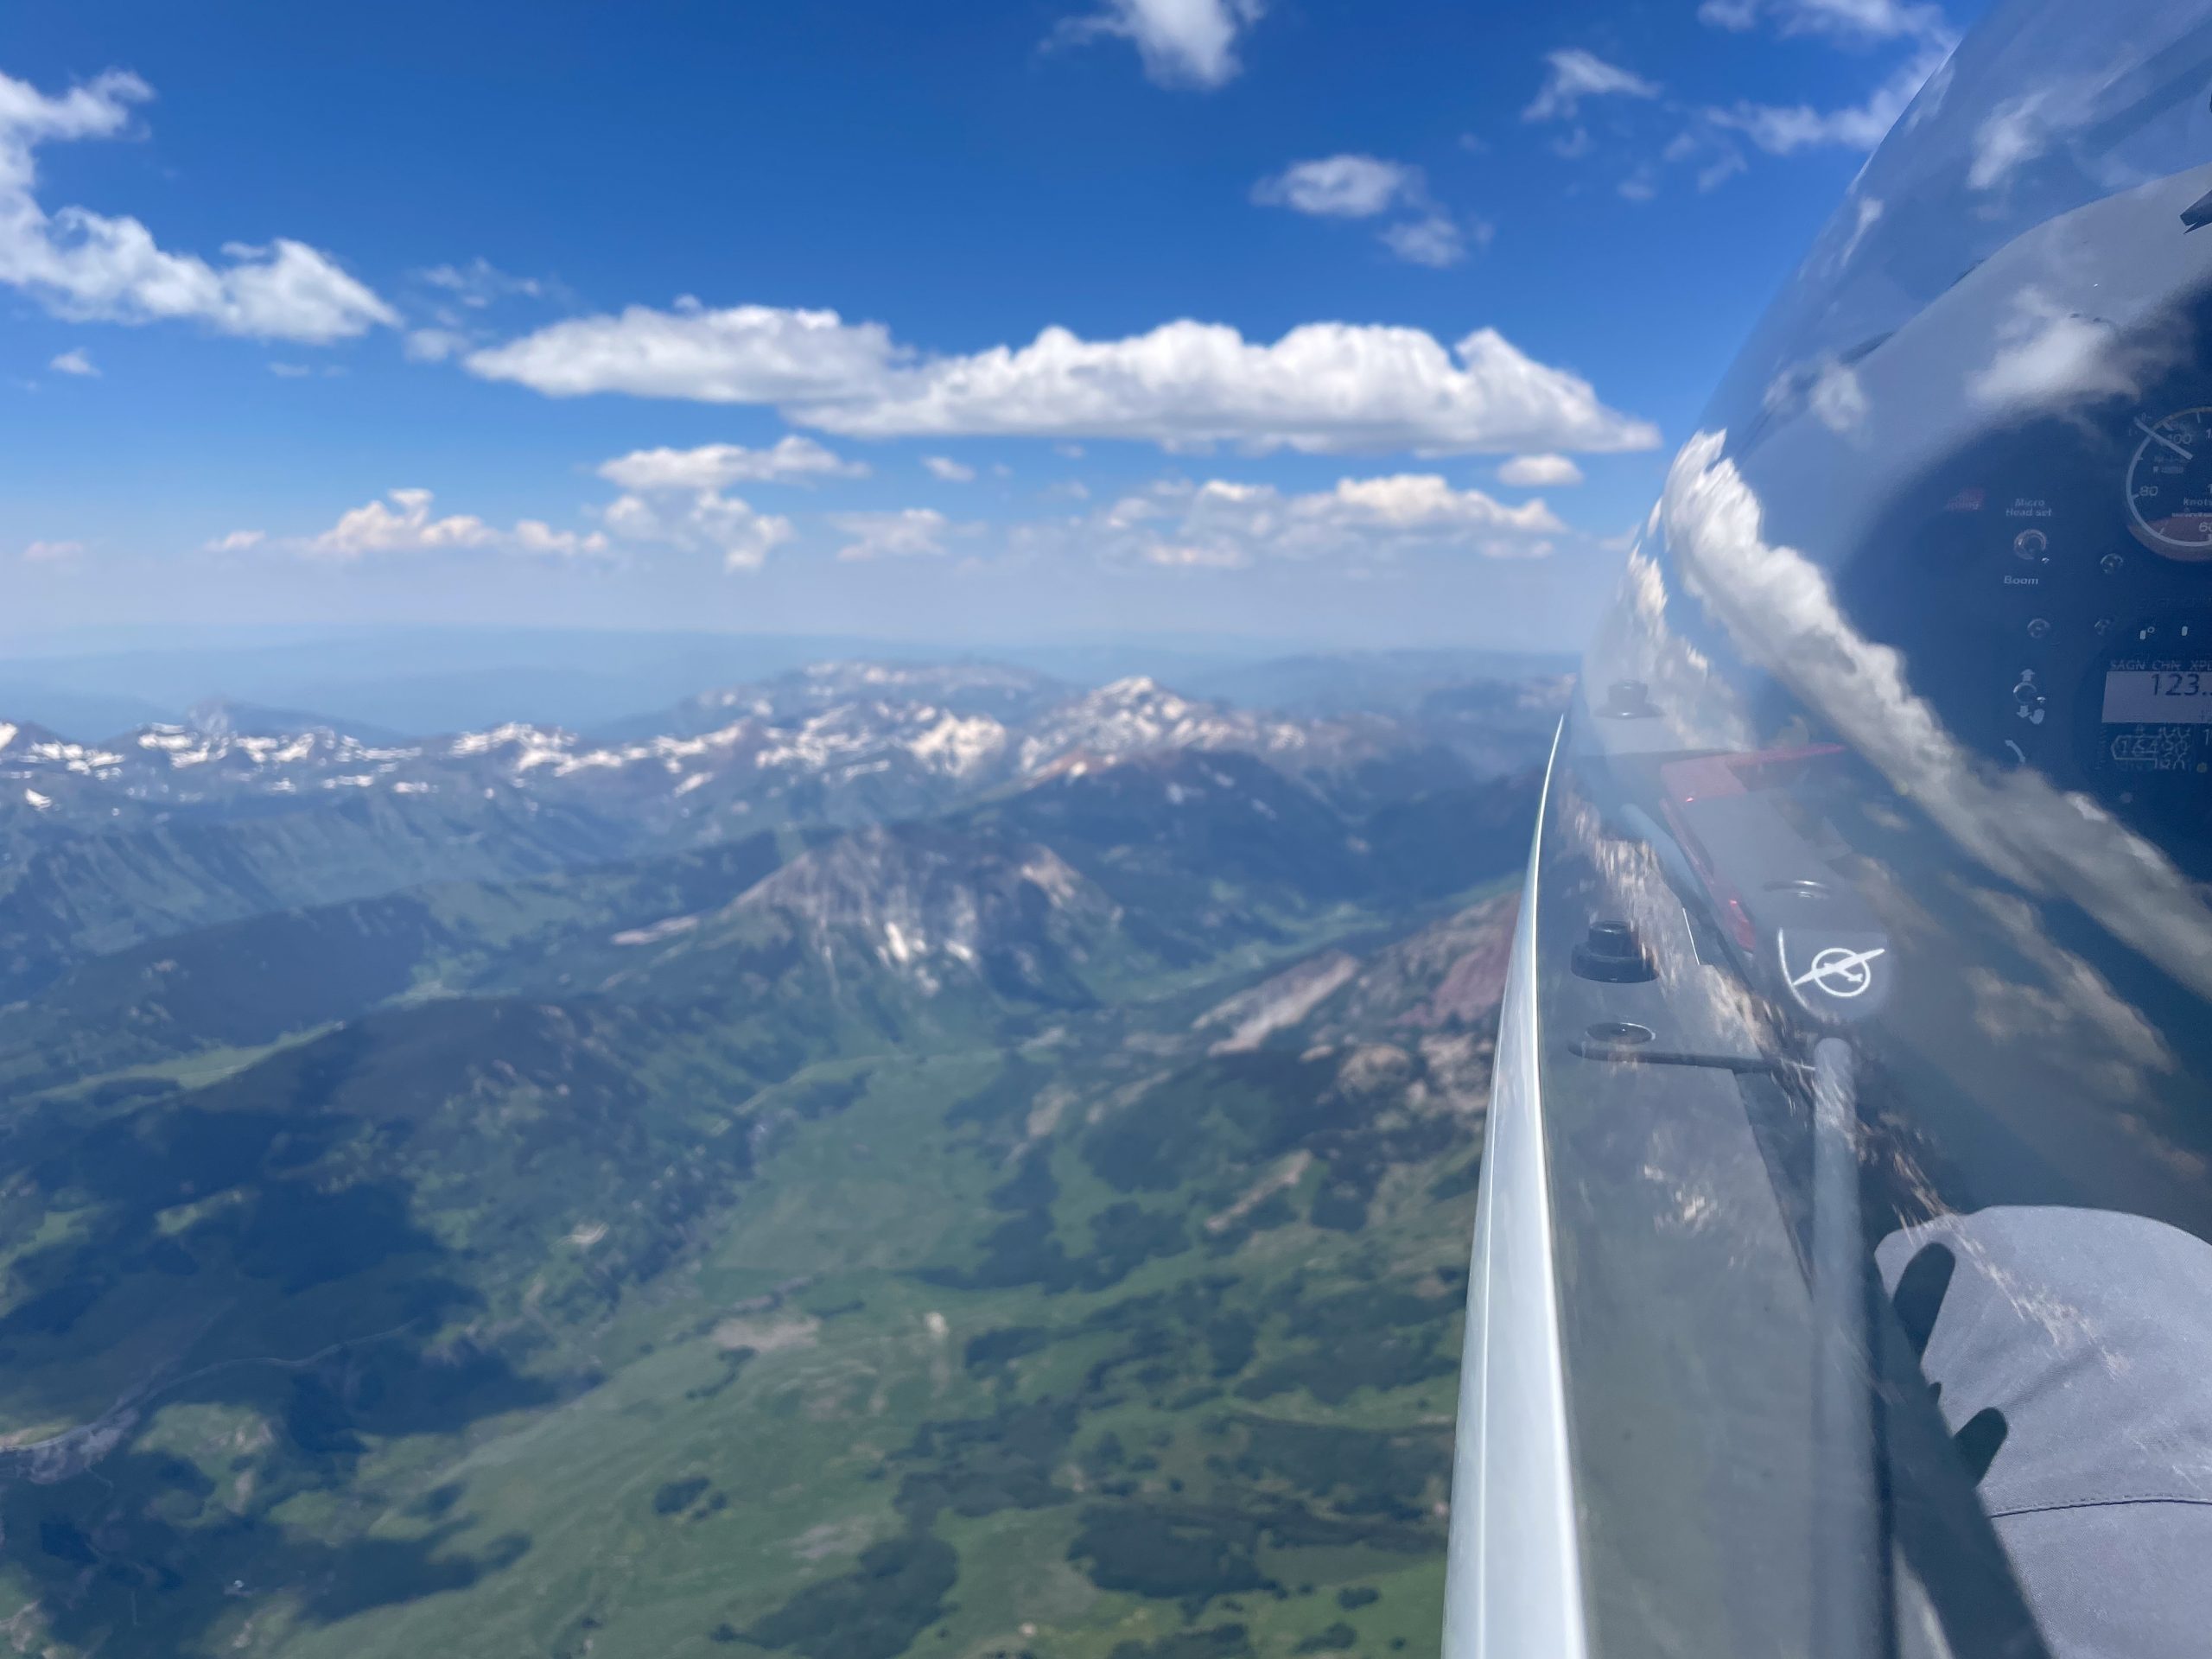
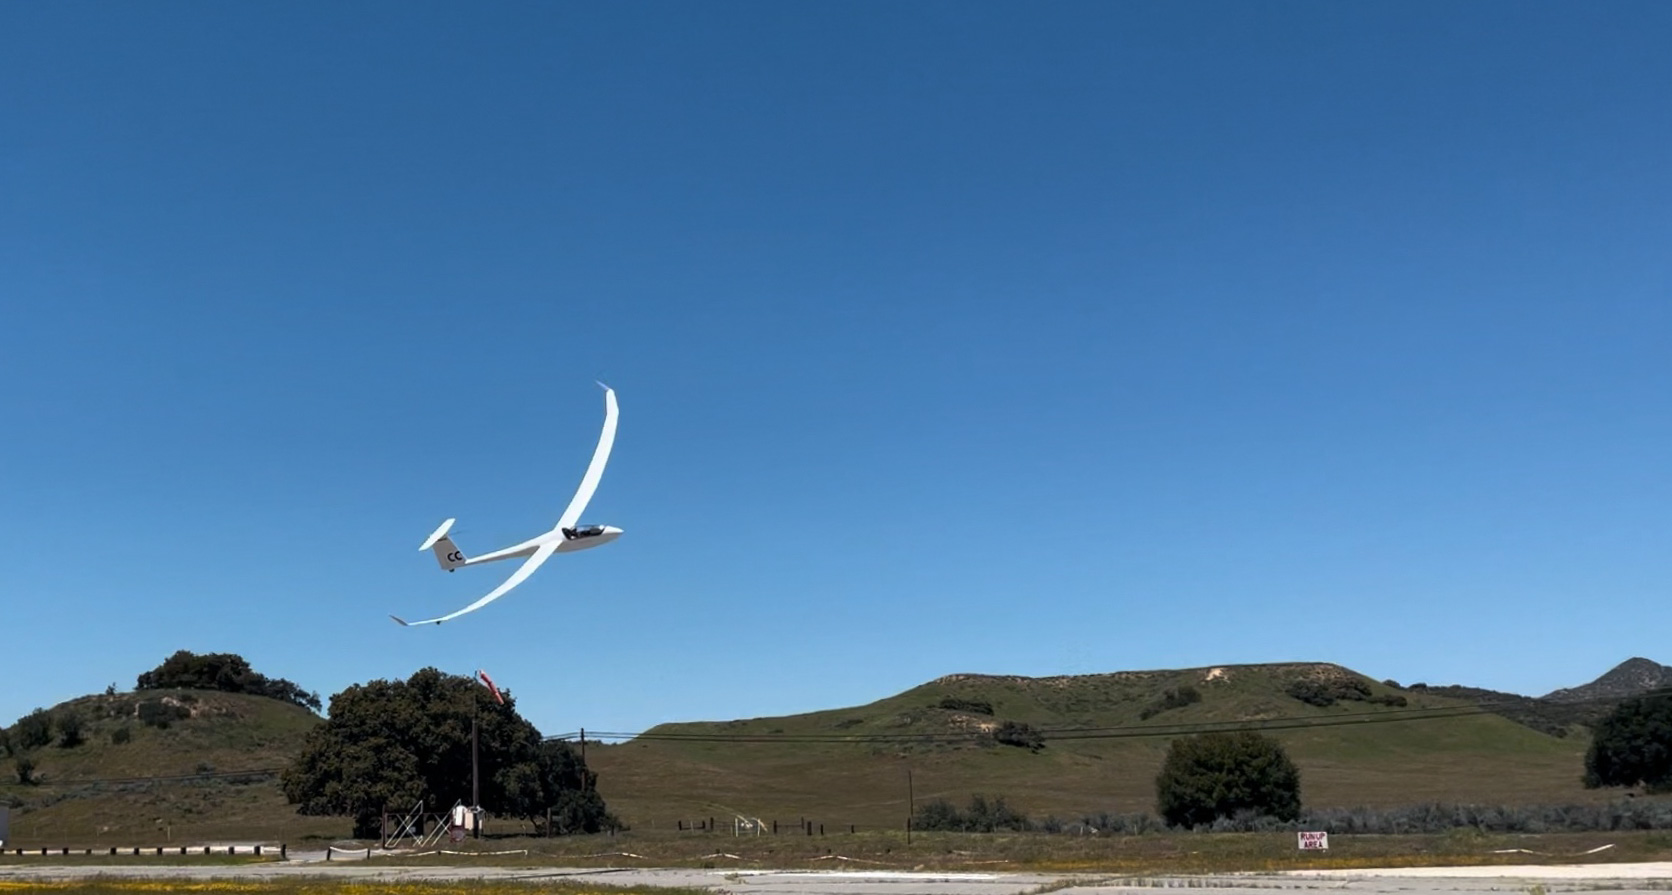
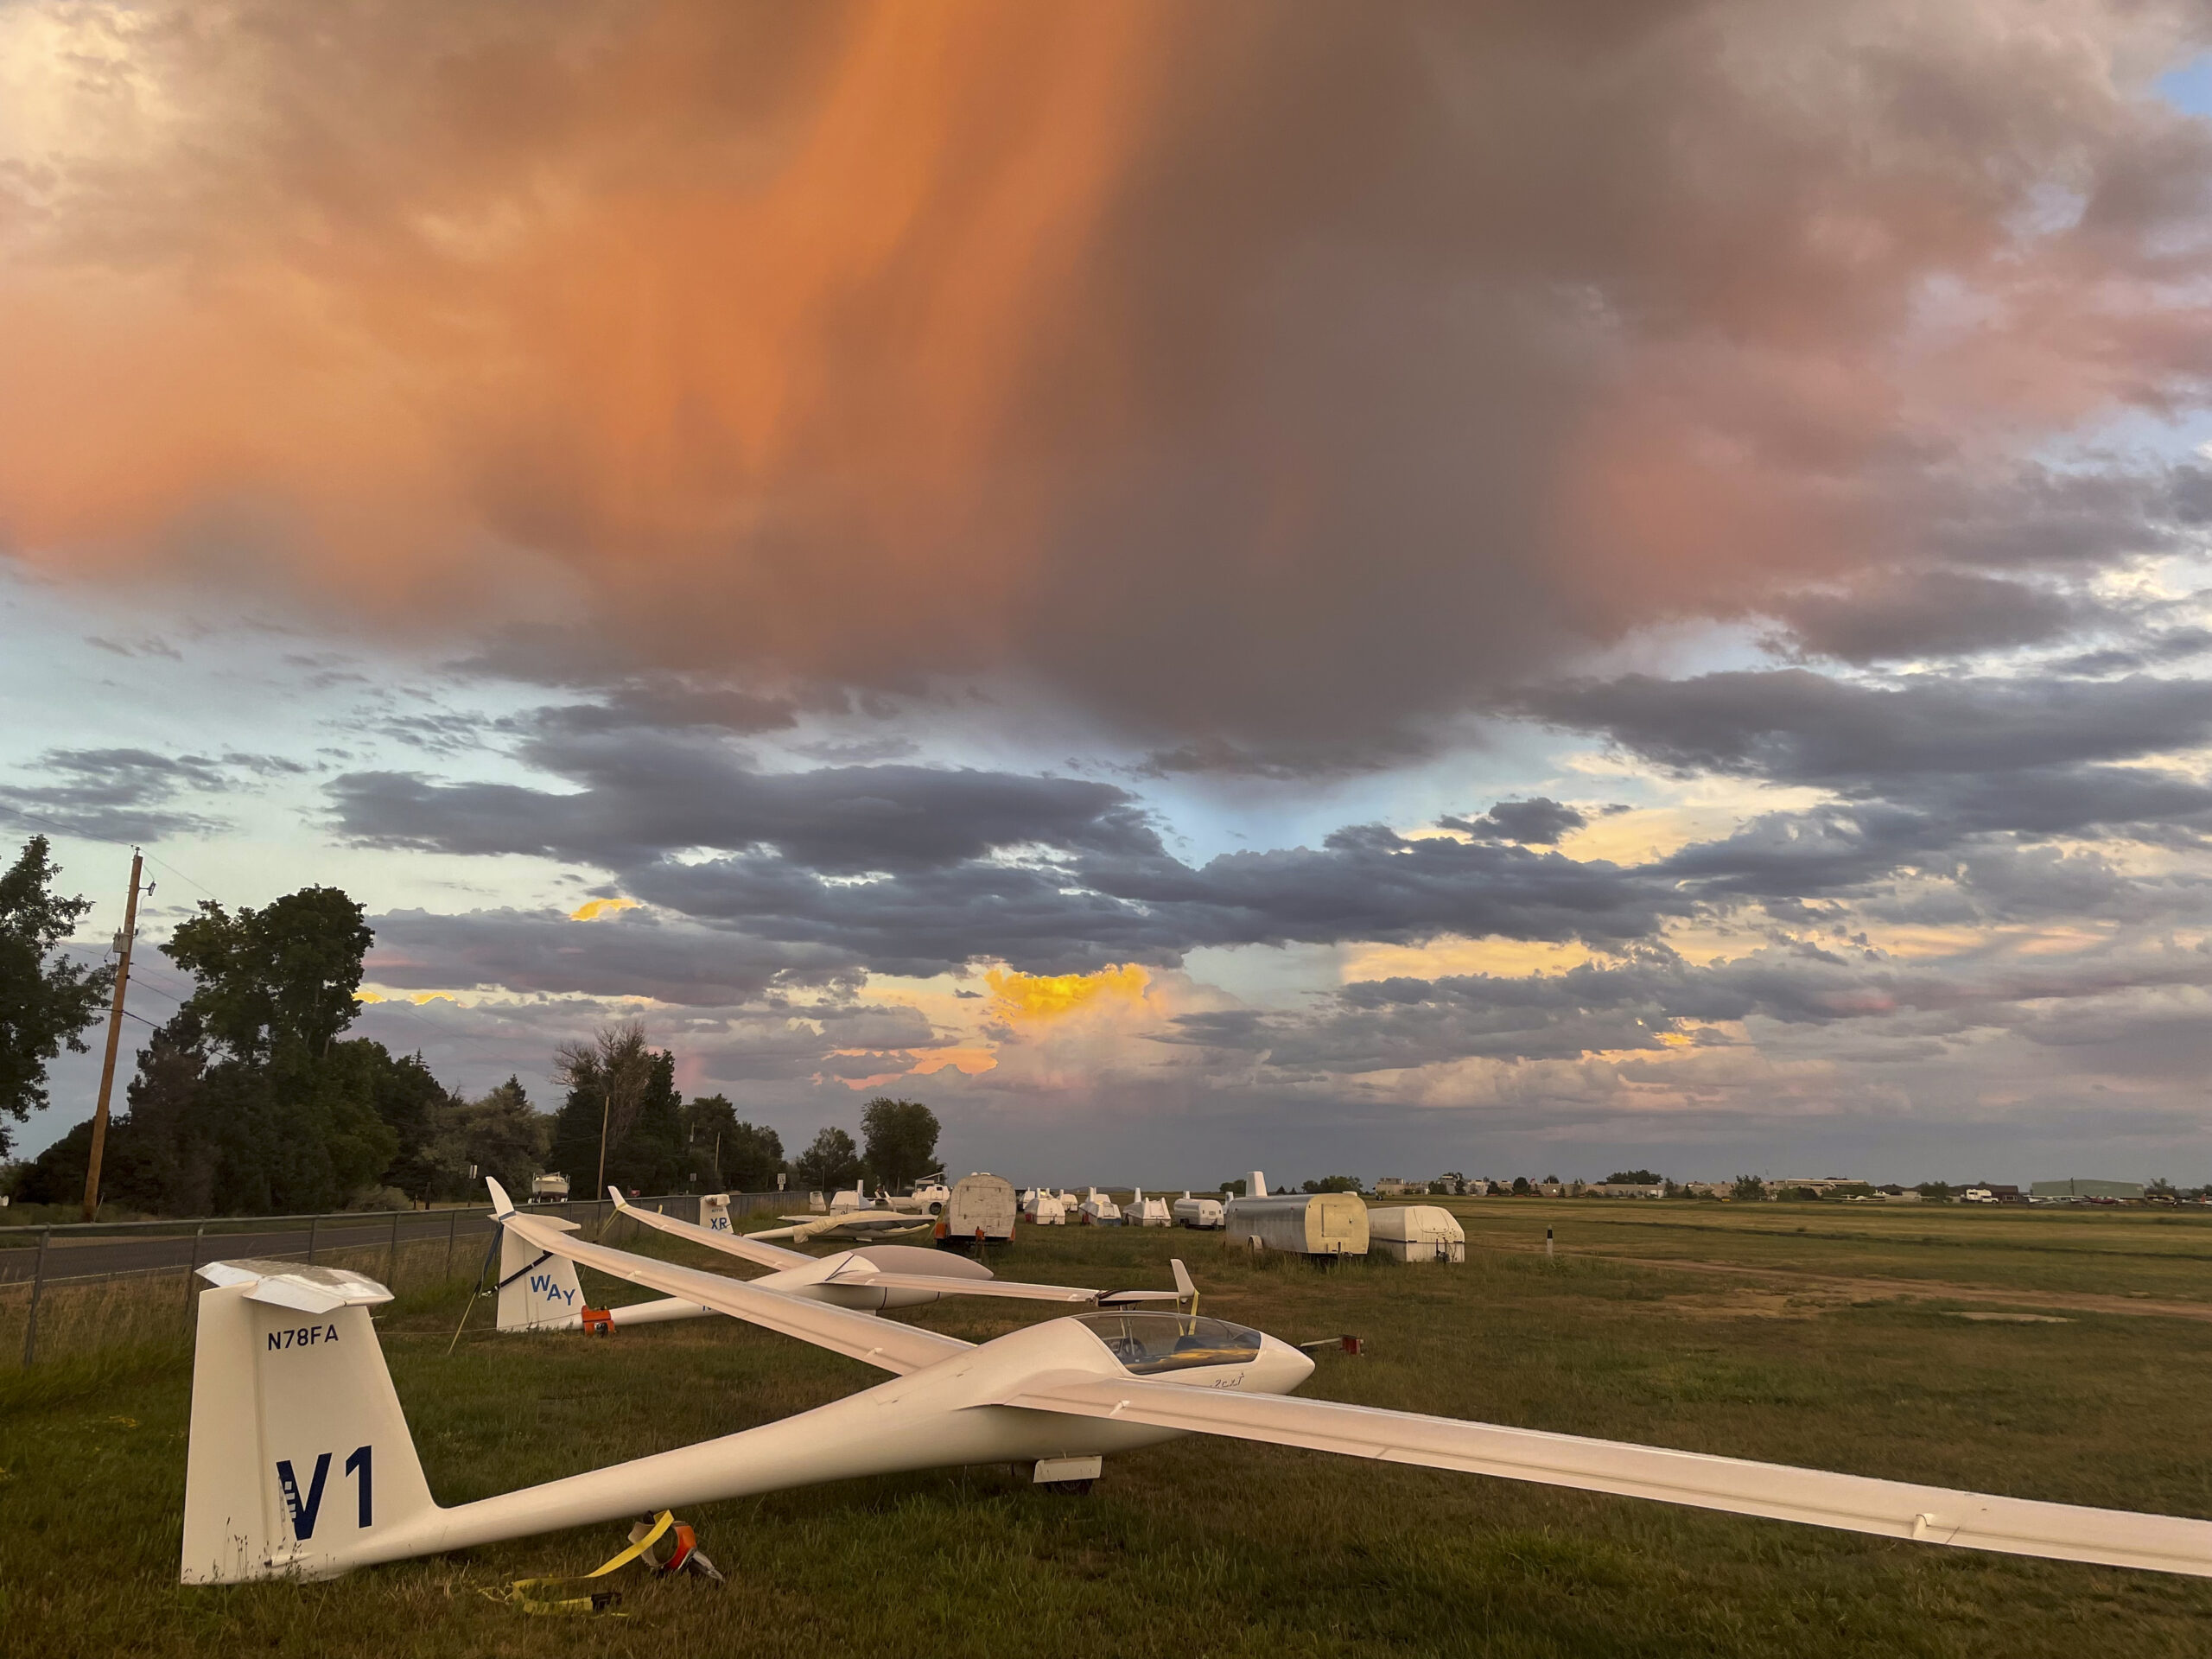
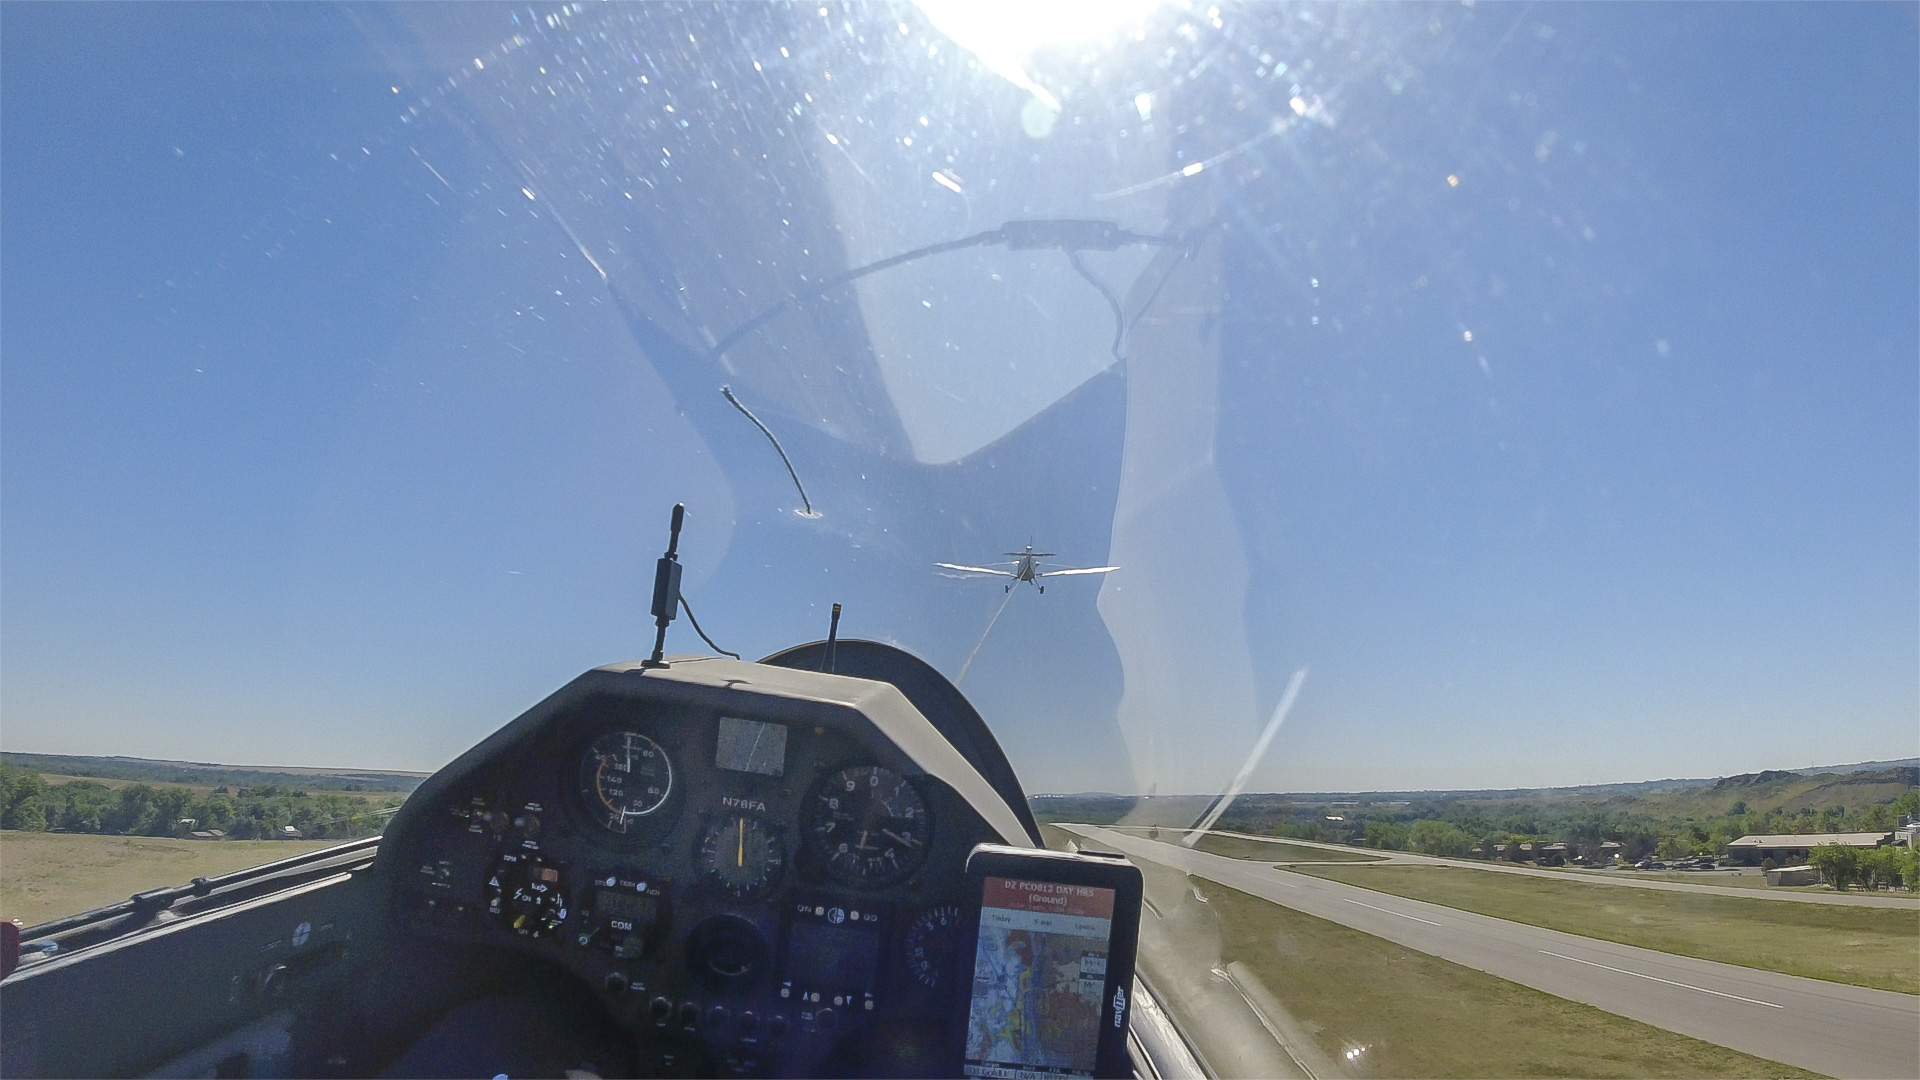
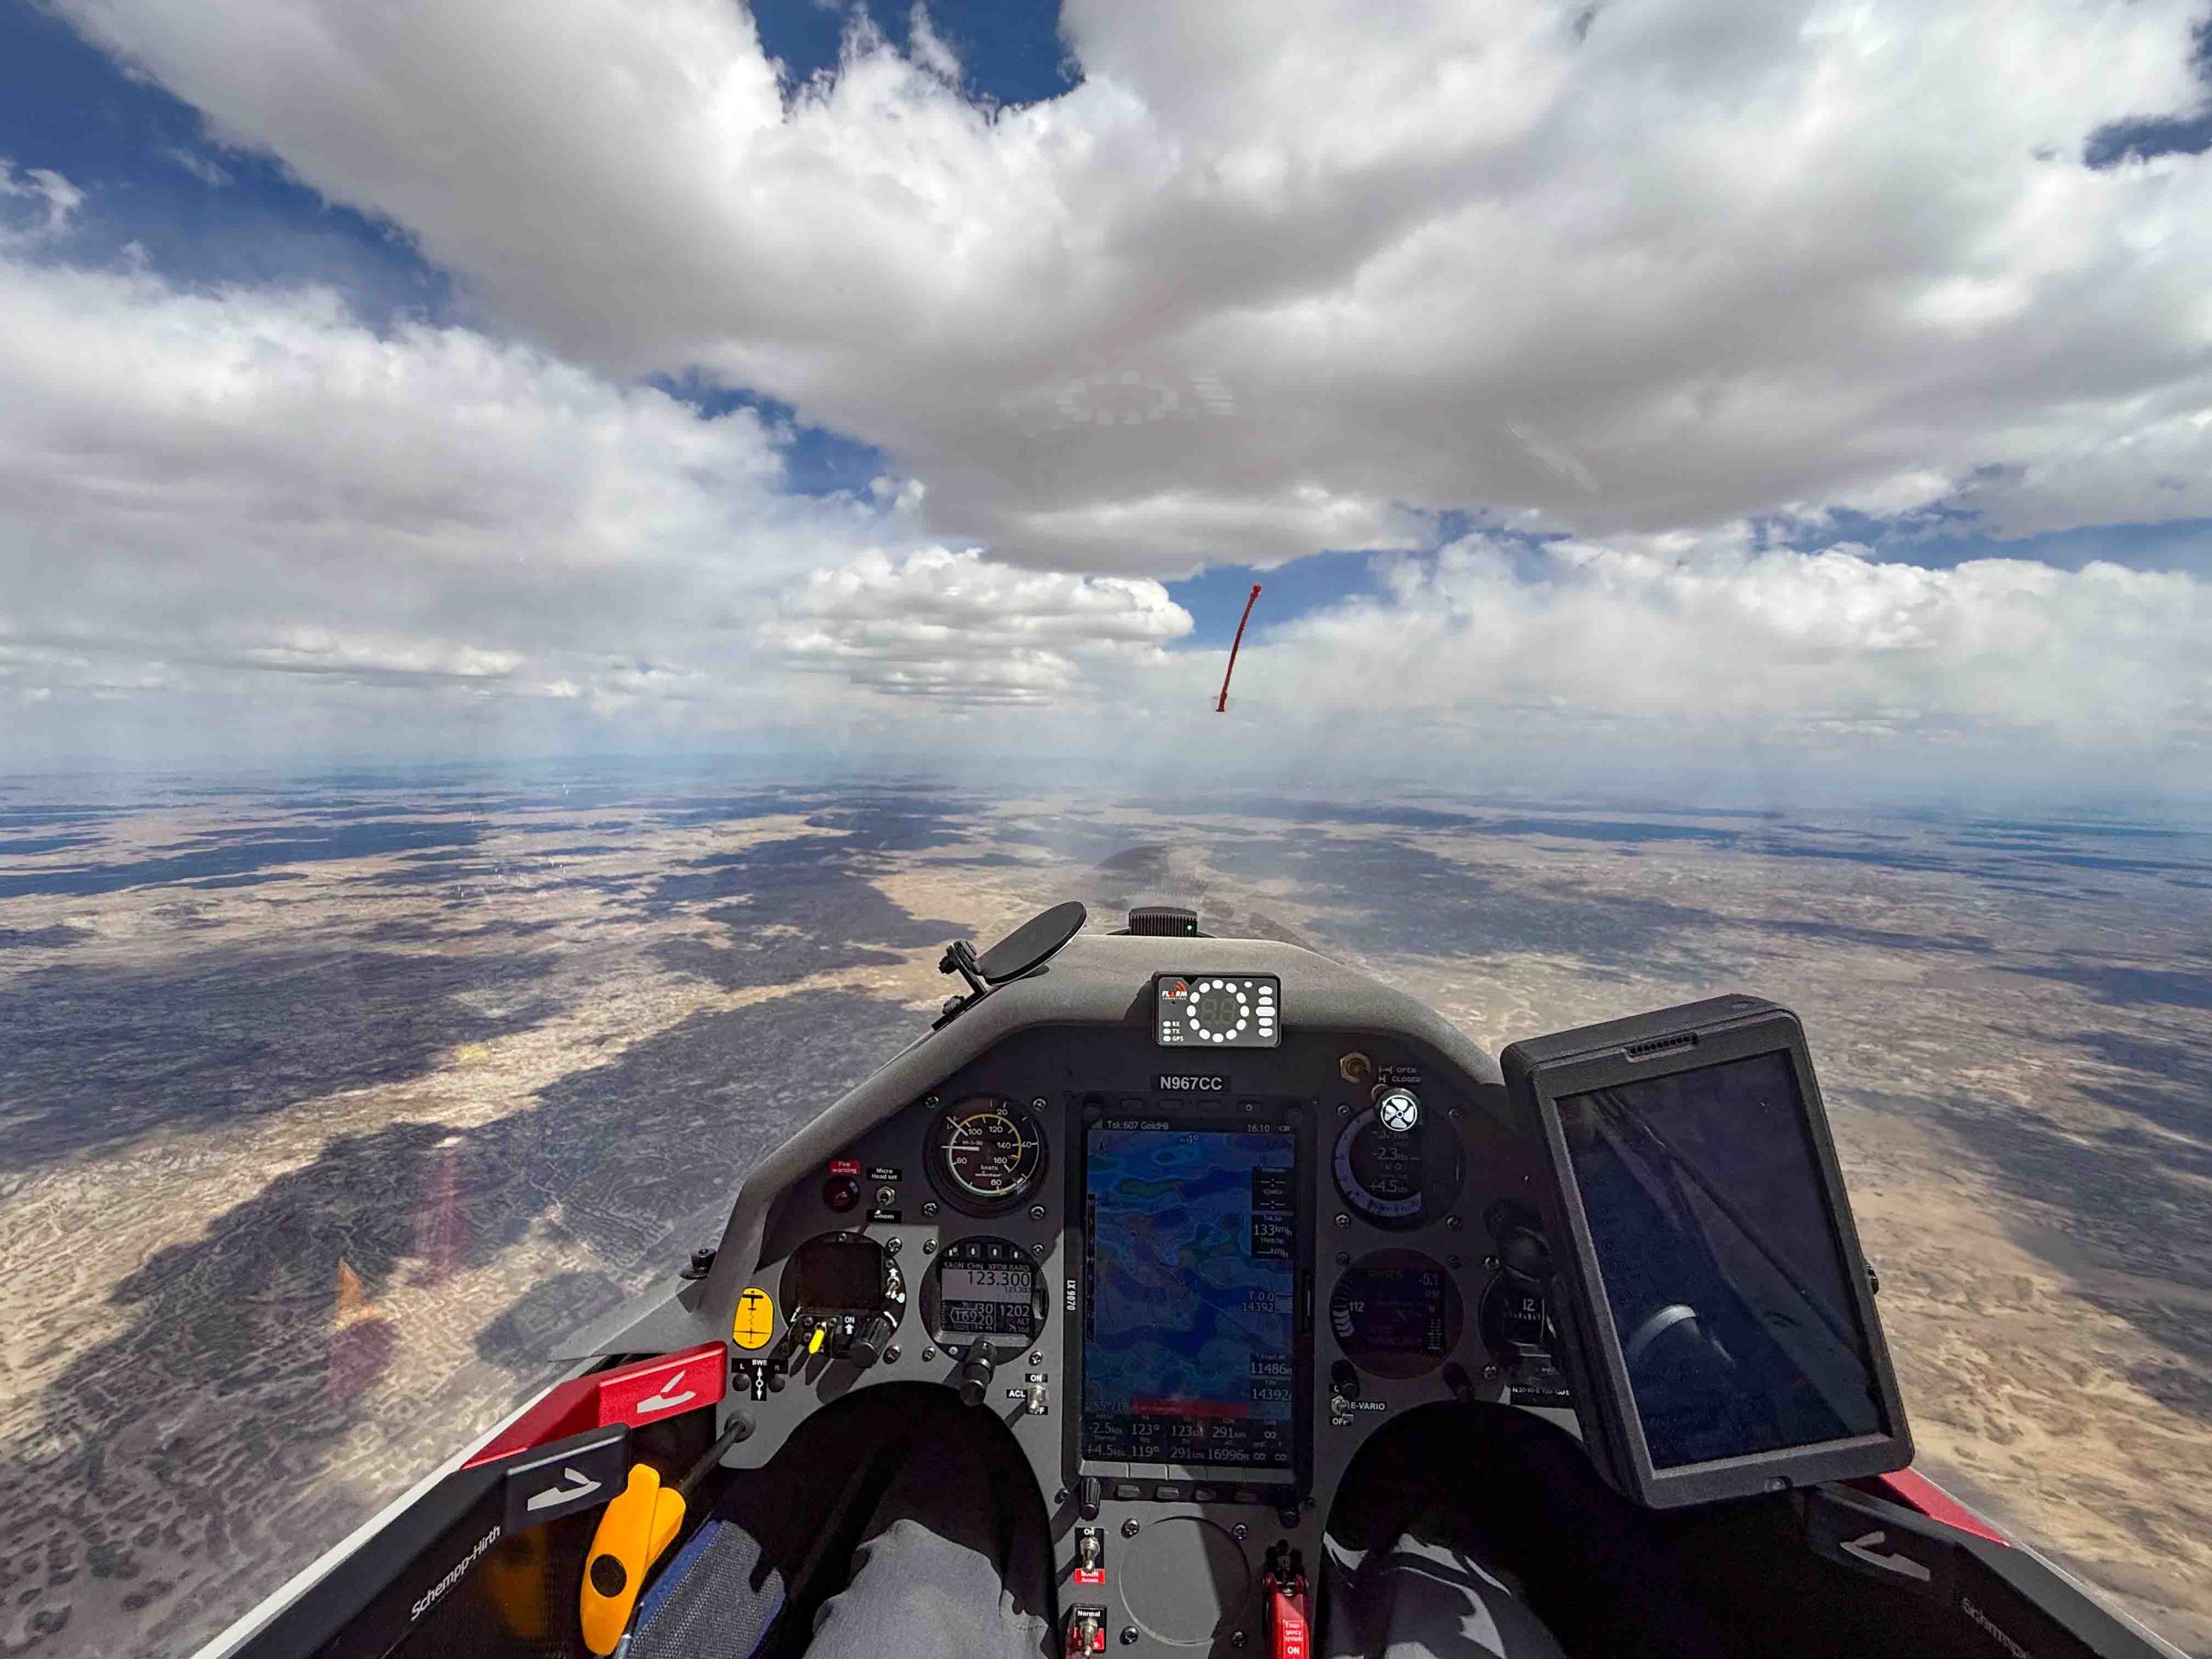
Launch

Around 9AM I could already see the first clouds building some 30 km or so to the southwest of Boulder. But near Gold Hill, my declared Start Point, the sky was completely blue.  For a moment I contemplated changing my flight declaration, move the Start and Finish Point further south and motor to the first lift.

Upon some reflection I realized that an earlier start could put me in trouble on Leg 2, which would only begin to develop around noon. So I kept the flight declaration unchanged and waited.  By 9:40AM there was still no cloud near Boulder but I decided it was time to launch anyway.  I took the usual tow route towards Nugget Ridge where I encountered the first strong lift a few miles away from my Start Point at Lee Hill.  I stowed the engine and quickly climbed to 12,000 ft where the lift topped out, hitting the inversion layer.

I decided to start anyway and headed to Gold Hill, crossing the start line at exactly 10AM, 30 minutes ahead of schedule.  Unfortunately there was no further climb at Gold Hill and my altitude of 11,700 ft meant I was too low to head straight to the clouds in the southwest (towards Idaho Springs).

I had to follow the convergence along the eastern edge of the foothills. West of Golden my fourth attempt to climb higher was successful: at 10:28 AM I reached 16,700 ft and was on my way.

Leg 1

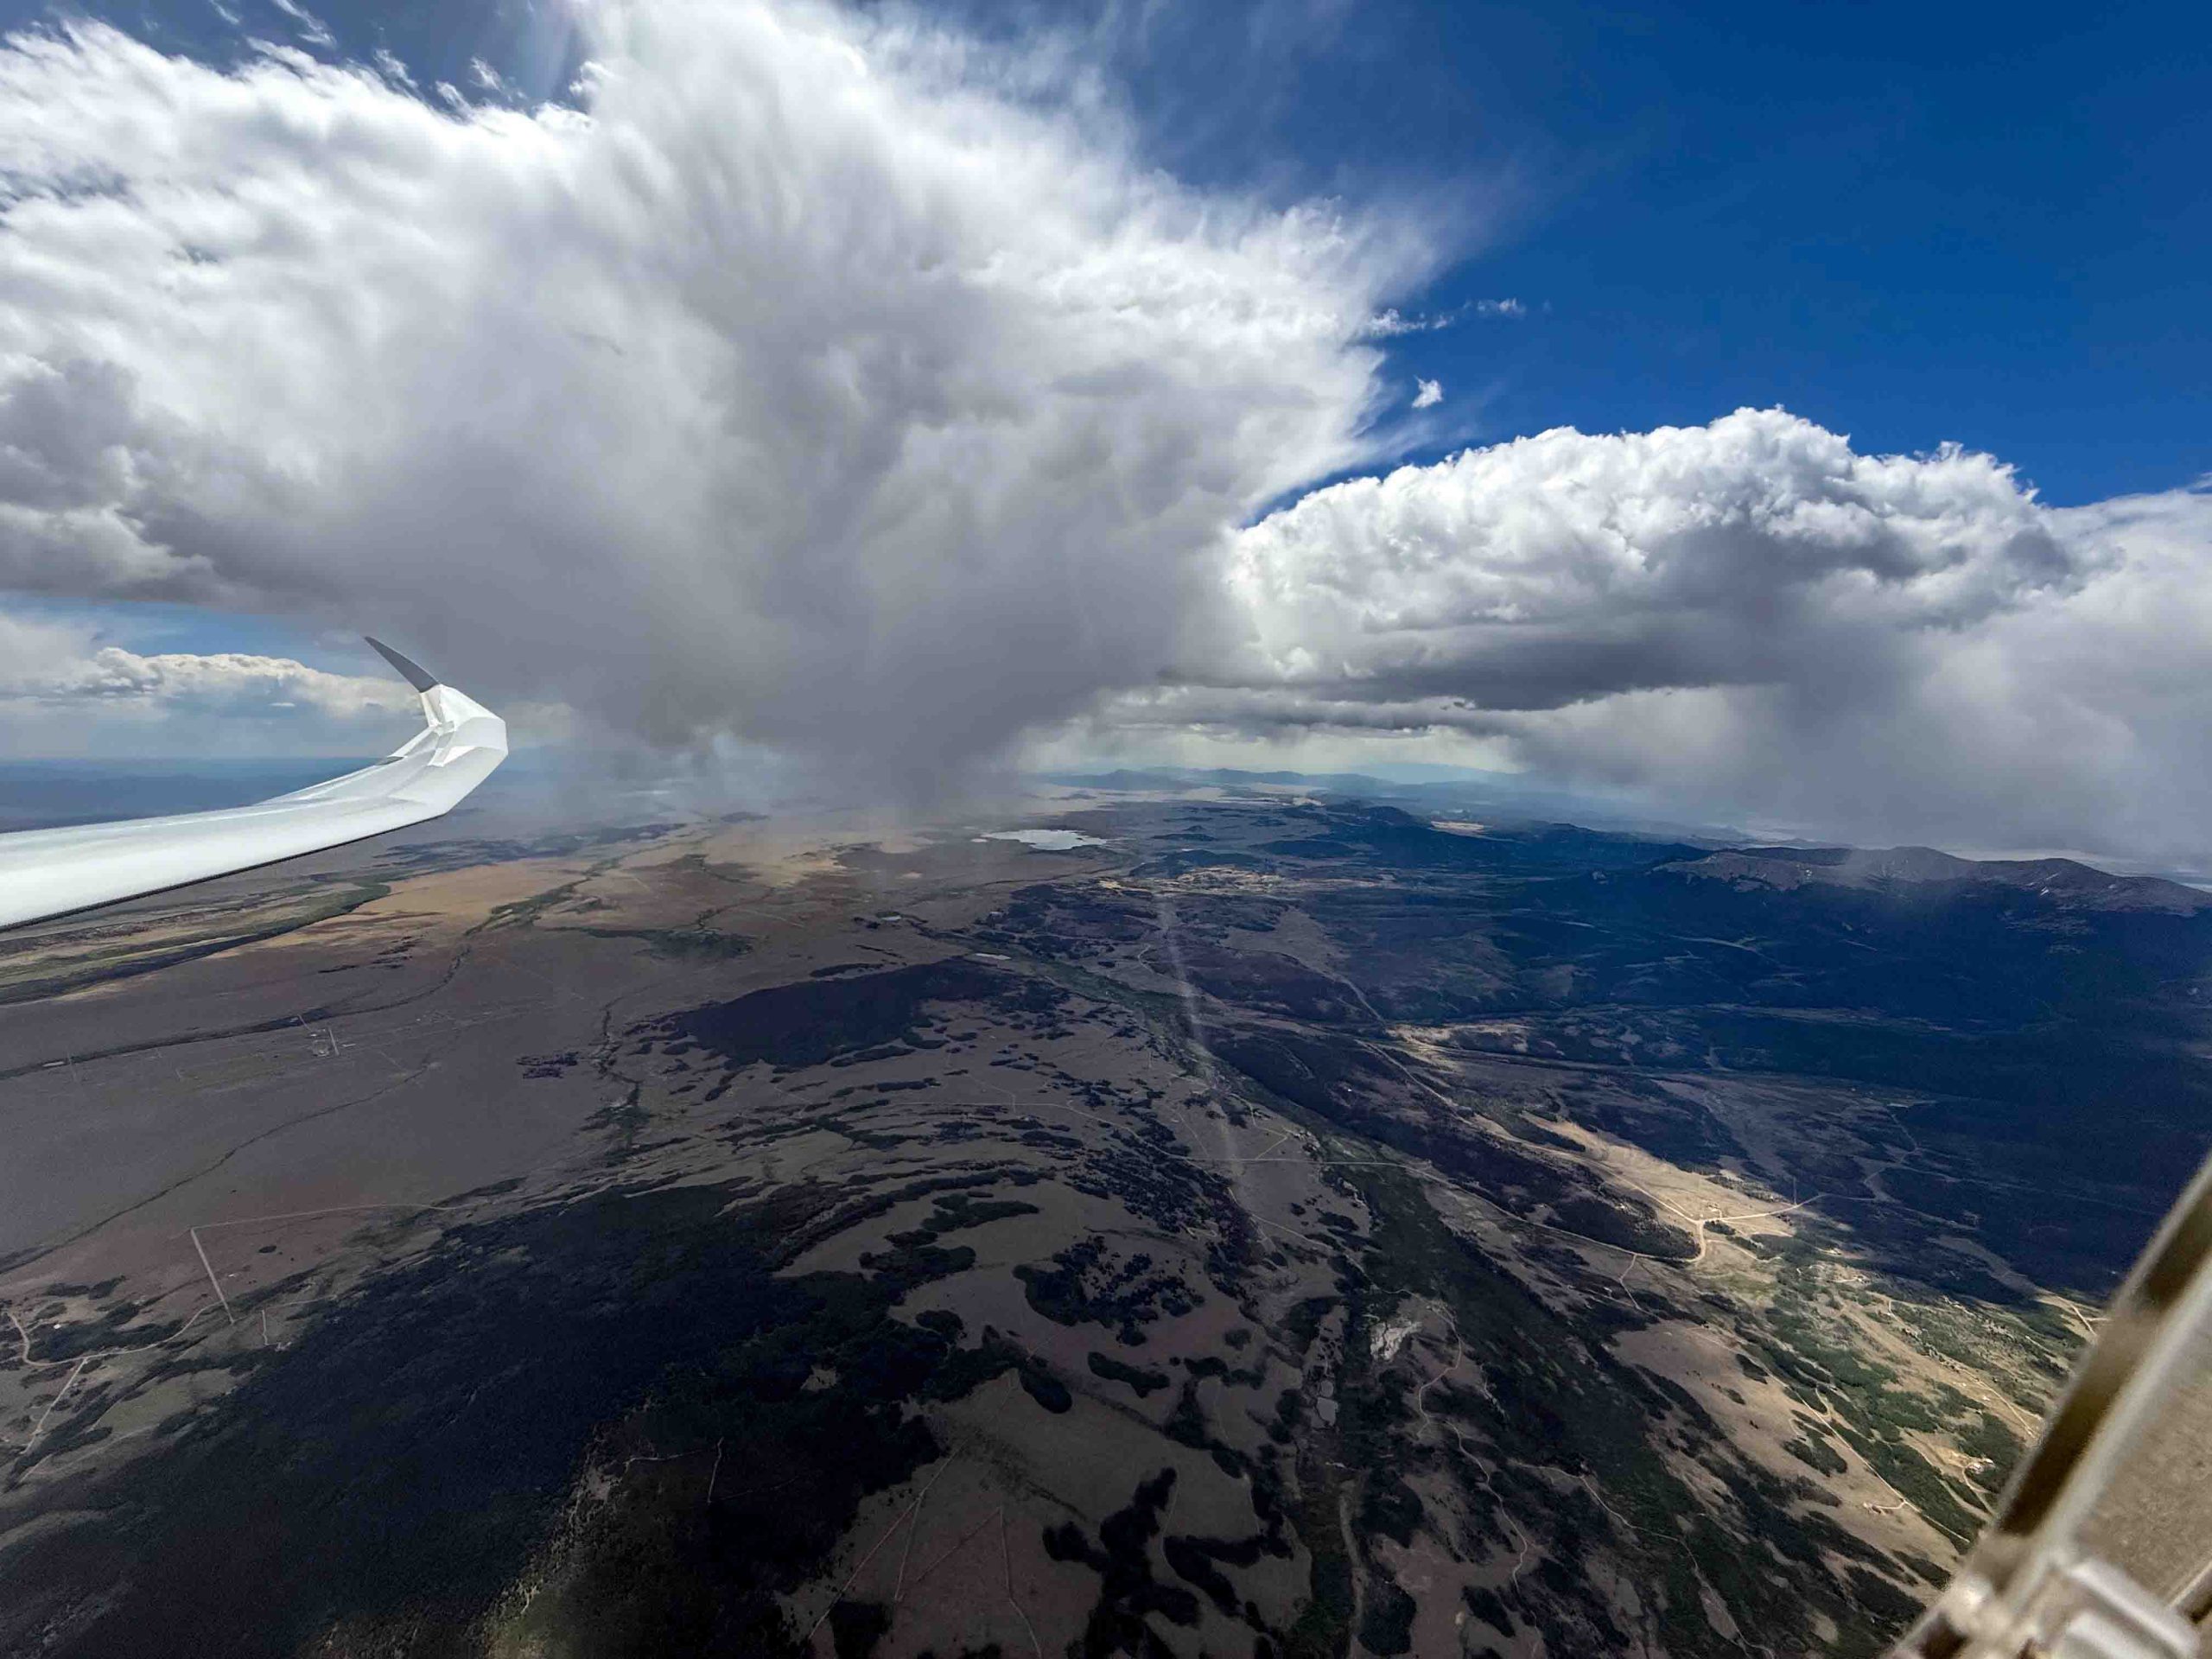
Now at altitude, I got a good luck at the beginning of Leg 1 ahead.  It was only 10:31 AM and there was already over-development ahead with several clouds shedding virga.

I’m east of Idaho Springs, about to cross I-70, heading WSW. Virga and rain is falling south of Mount Evans, obscuring the view into South Park.

OD so early in the day usually spells trouble for later.  But I recalled that virga had been forecast for this particular area and so I should not be surprised to see it.  I convinced myself that it really meant nothing for the rest of the flight.

Here’s the OD forecast for 10:30AM.  The virga is just where it is supposed to be. I just needed to get past it and it didn’t look difficult.

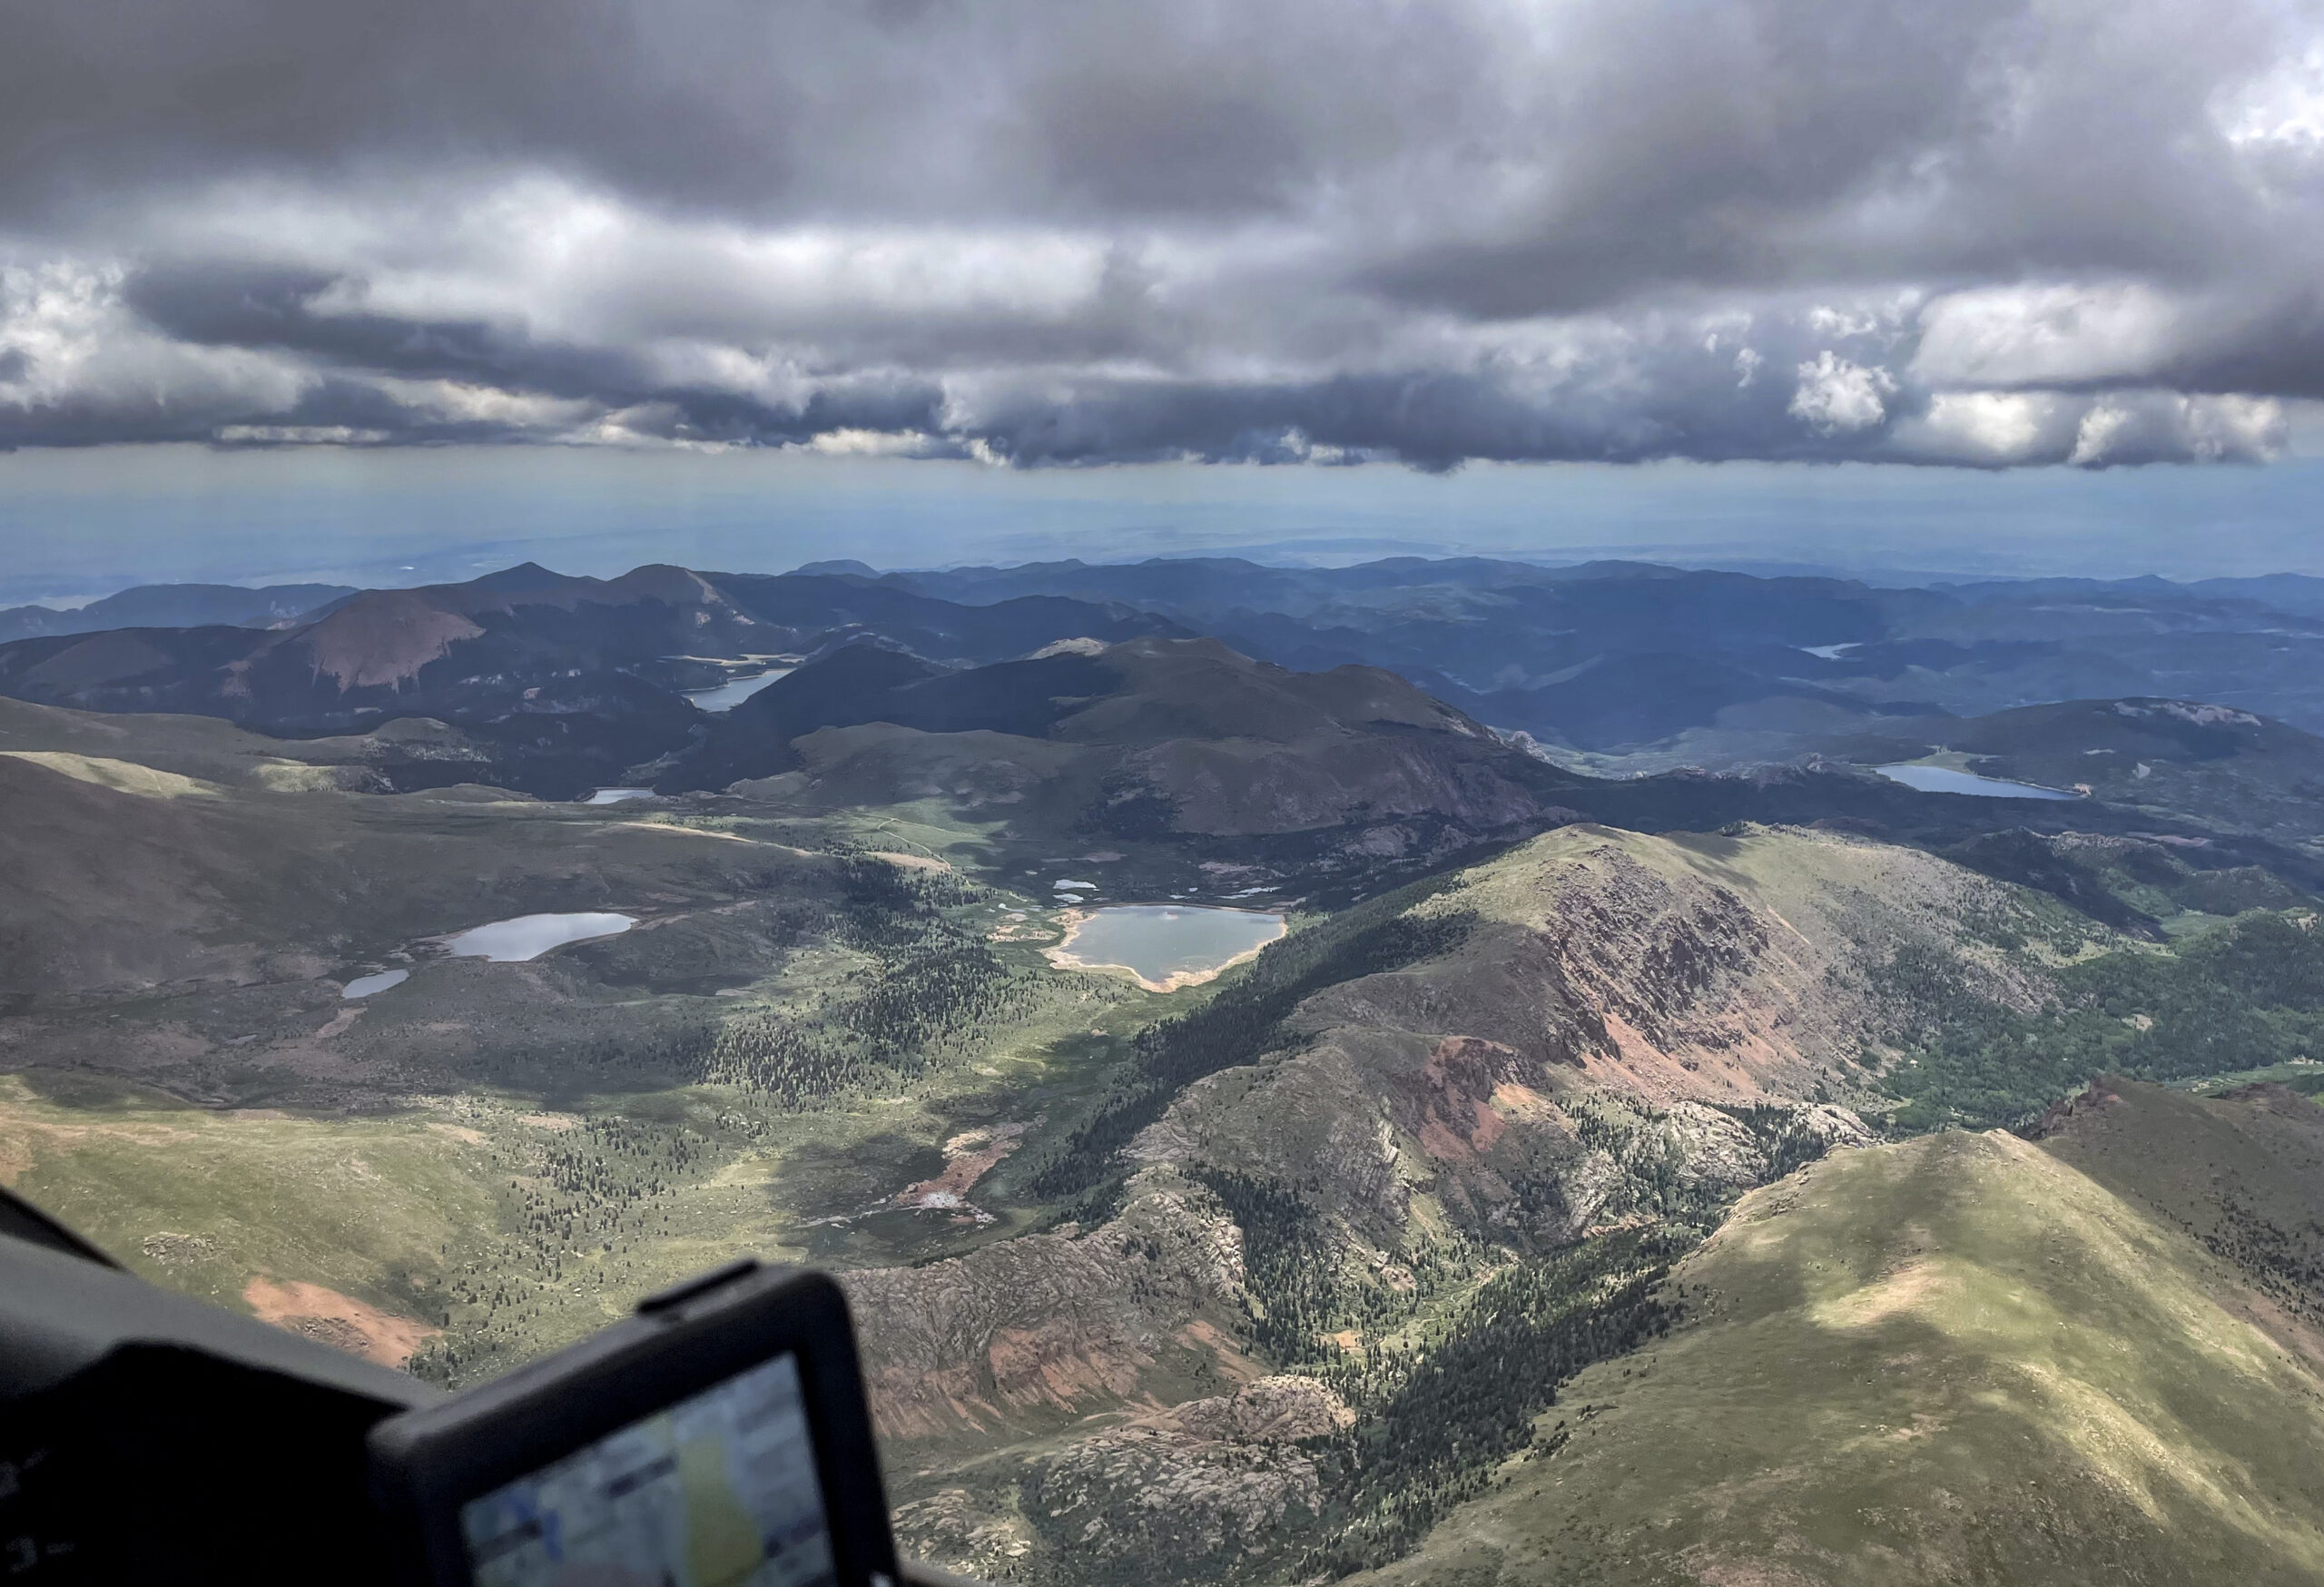
As expected, there was good lift underneath the dark clouds that didn’t shed virga yet. I managed to stay high and quickly made progress along the northern rim of South Park.

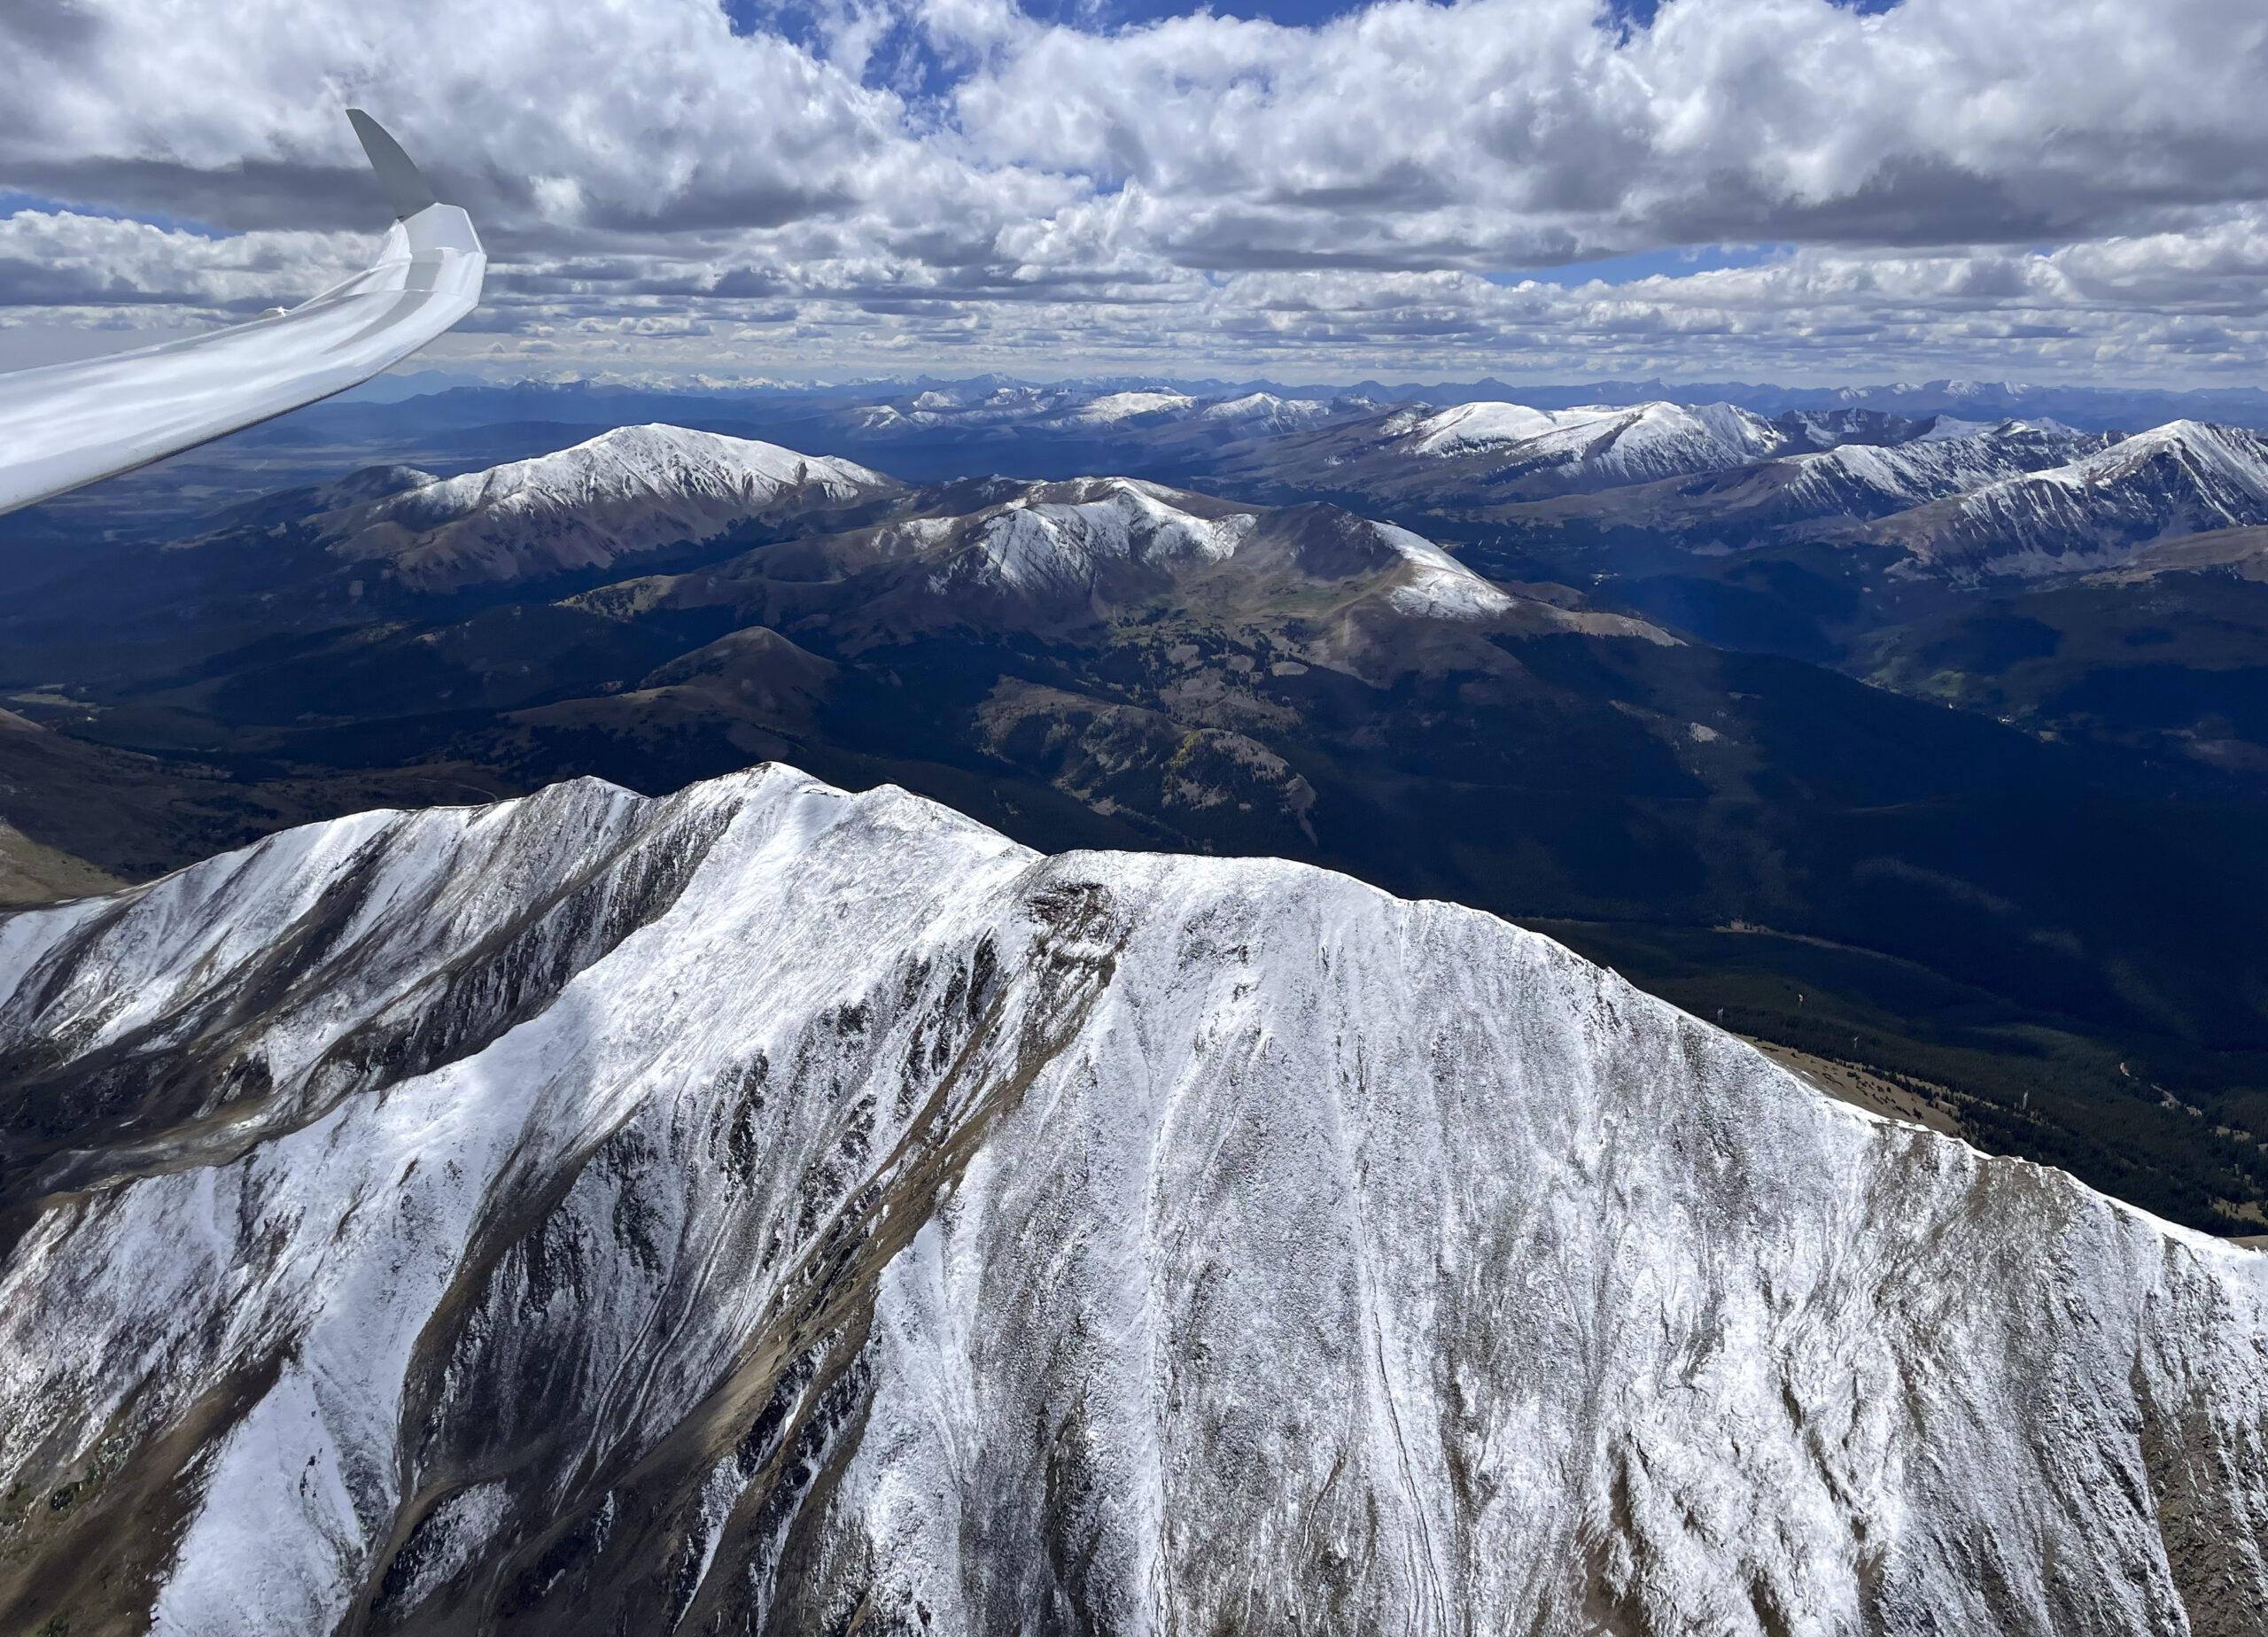
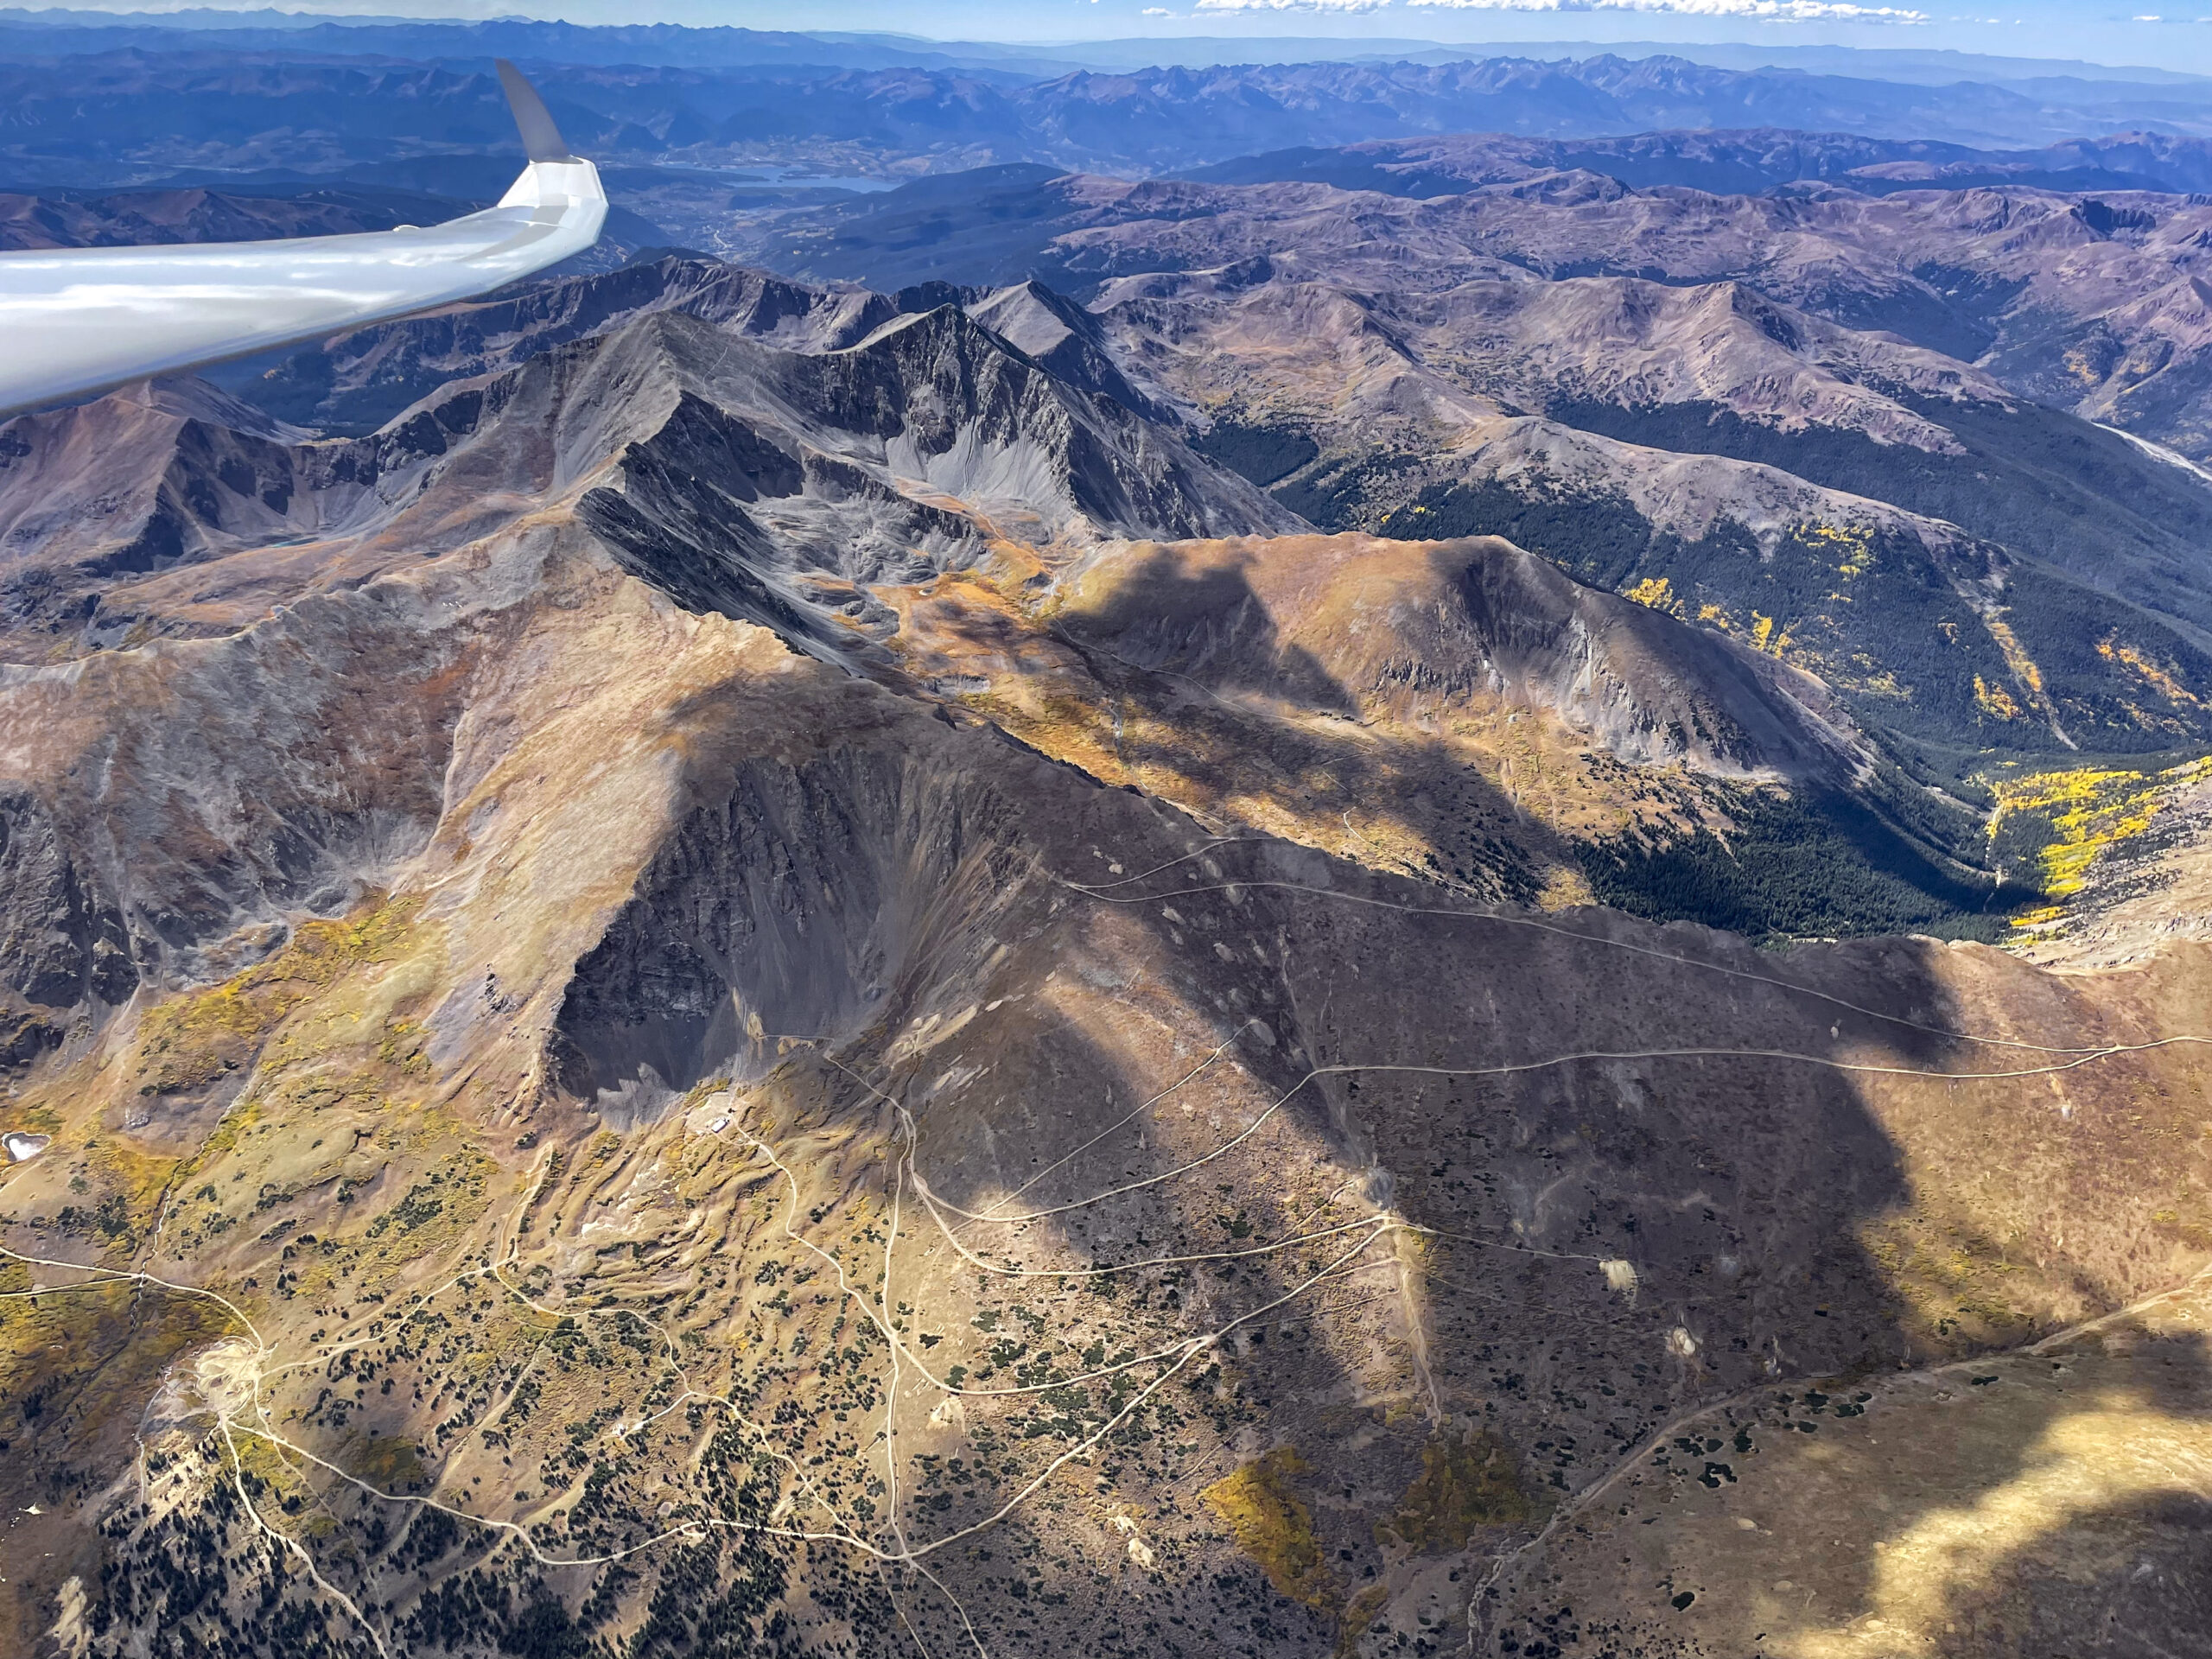
Then things started to look really challenging. Cycle times were extremely short and some of the clouds started to implode as I approached them. I remember a radio call at that time where I told one of my Boulder friends that I wasn’t sure yet whether I would be able to continue on task.

At 11:11AM the sky did not send promising signals that this could become a record day. If I had not done my homework, surely I would have thrown the towel at this point and given up on my task.

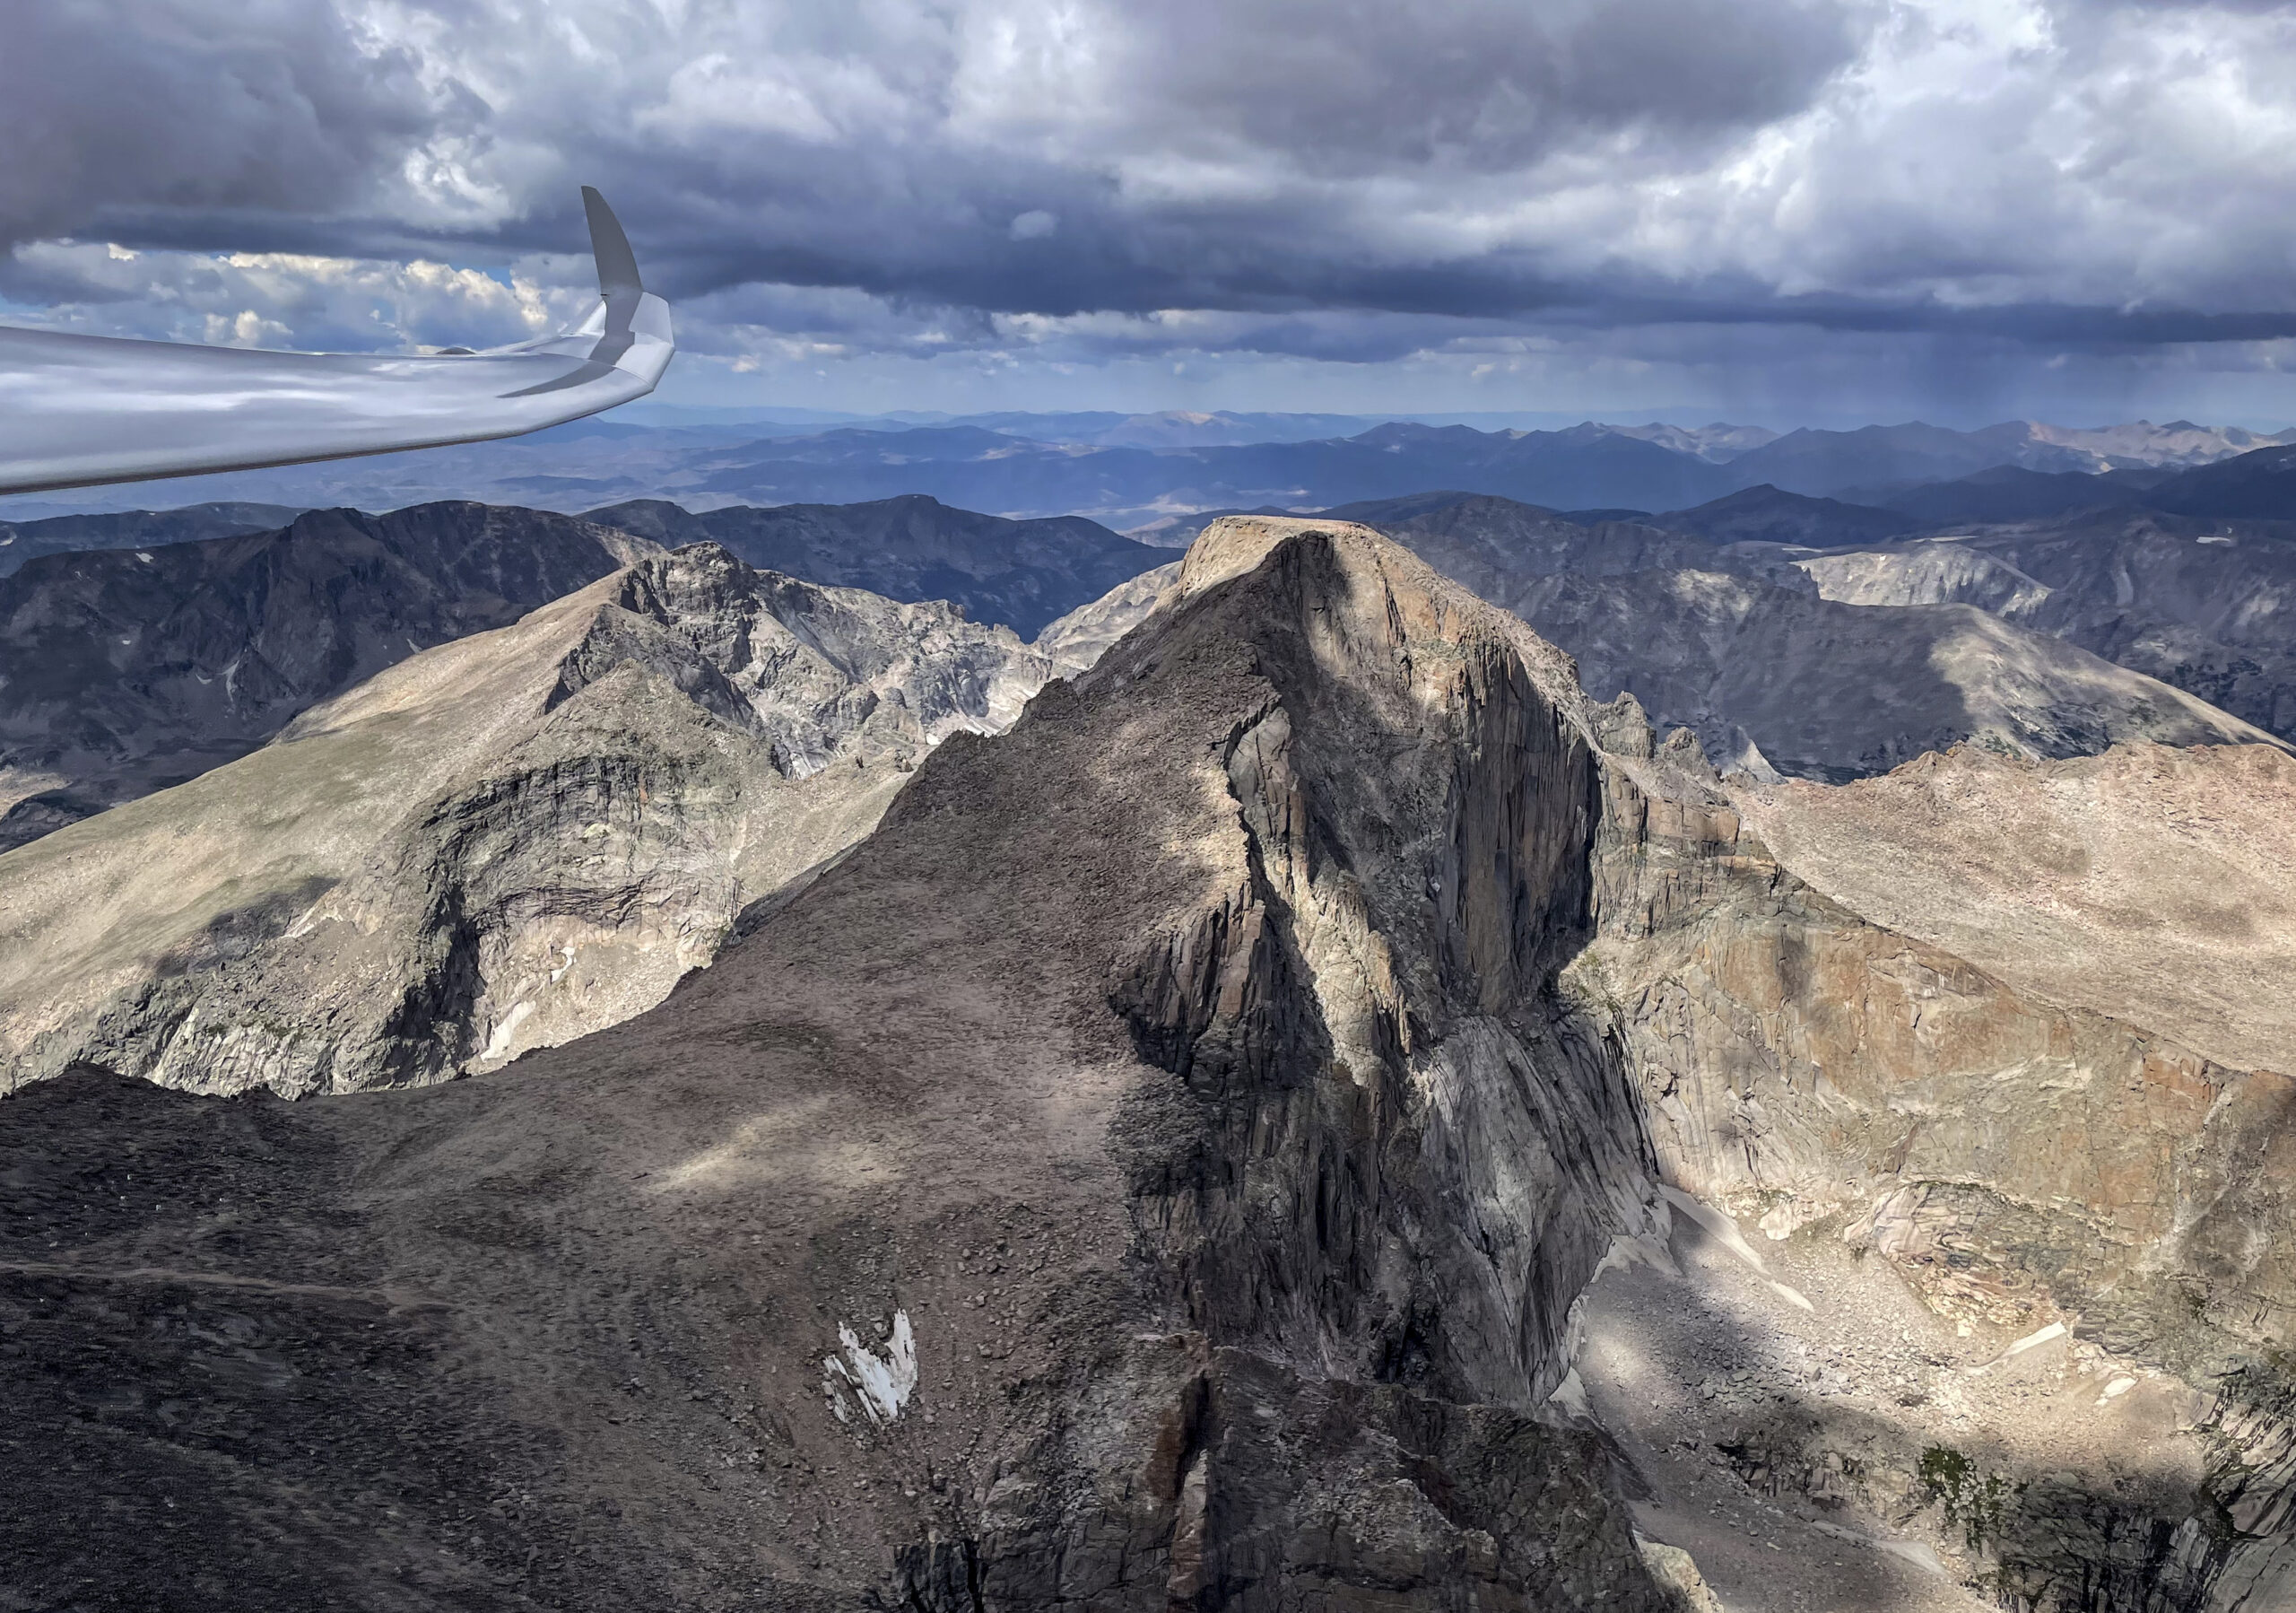
Shortly after this picture was taken I hit sink when crossing the Mosquito Range and the Arkansas Valley.  I wish I had another picture from that stage but I was too busy flying.  I had dropped to 13,300 ft and a big virga cell was sitting directly over Mount Harvard (14,423 ft).  I urgently needed a climb to get over Mount Yale (14,200 ft) and the Sawatch Range.

The situation wasn’t unsafe because I could have easily glided to the south along the Arkansas Valley but my record attempt would probably have been over.  Fortunately, the virga outflow triggered a rough thermal in the lee of the Sawatch Range, propelling me back to 16,000 ft and granting me safe passage over the mountains into Taylor Park.

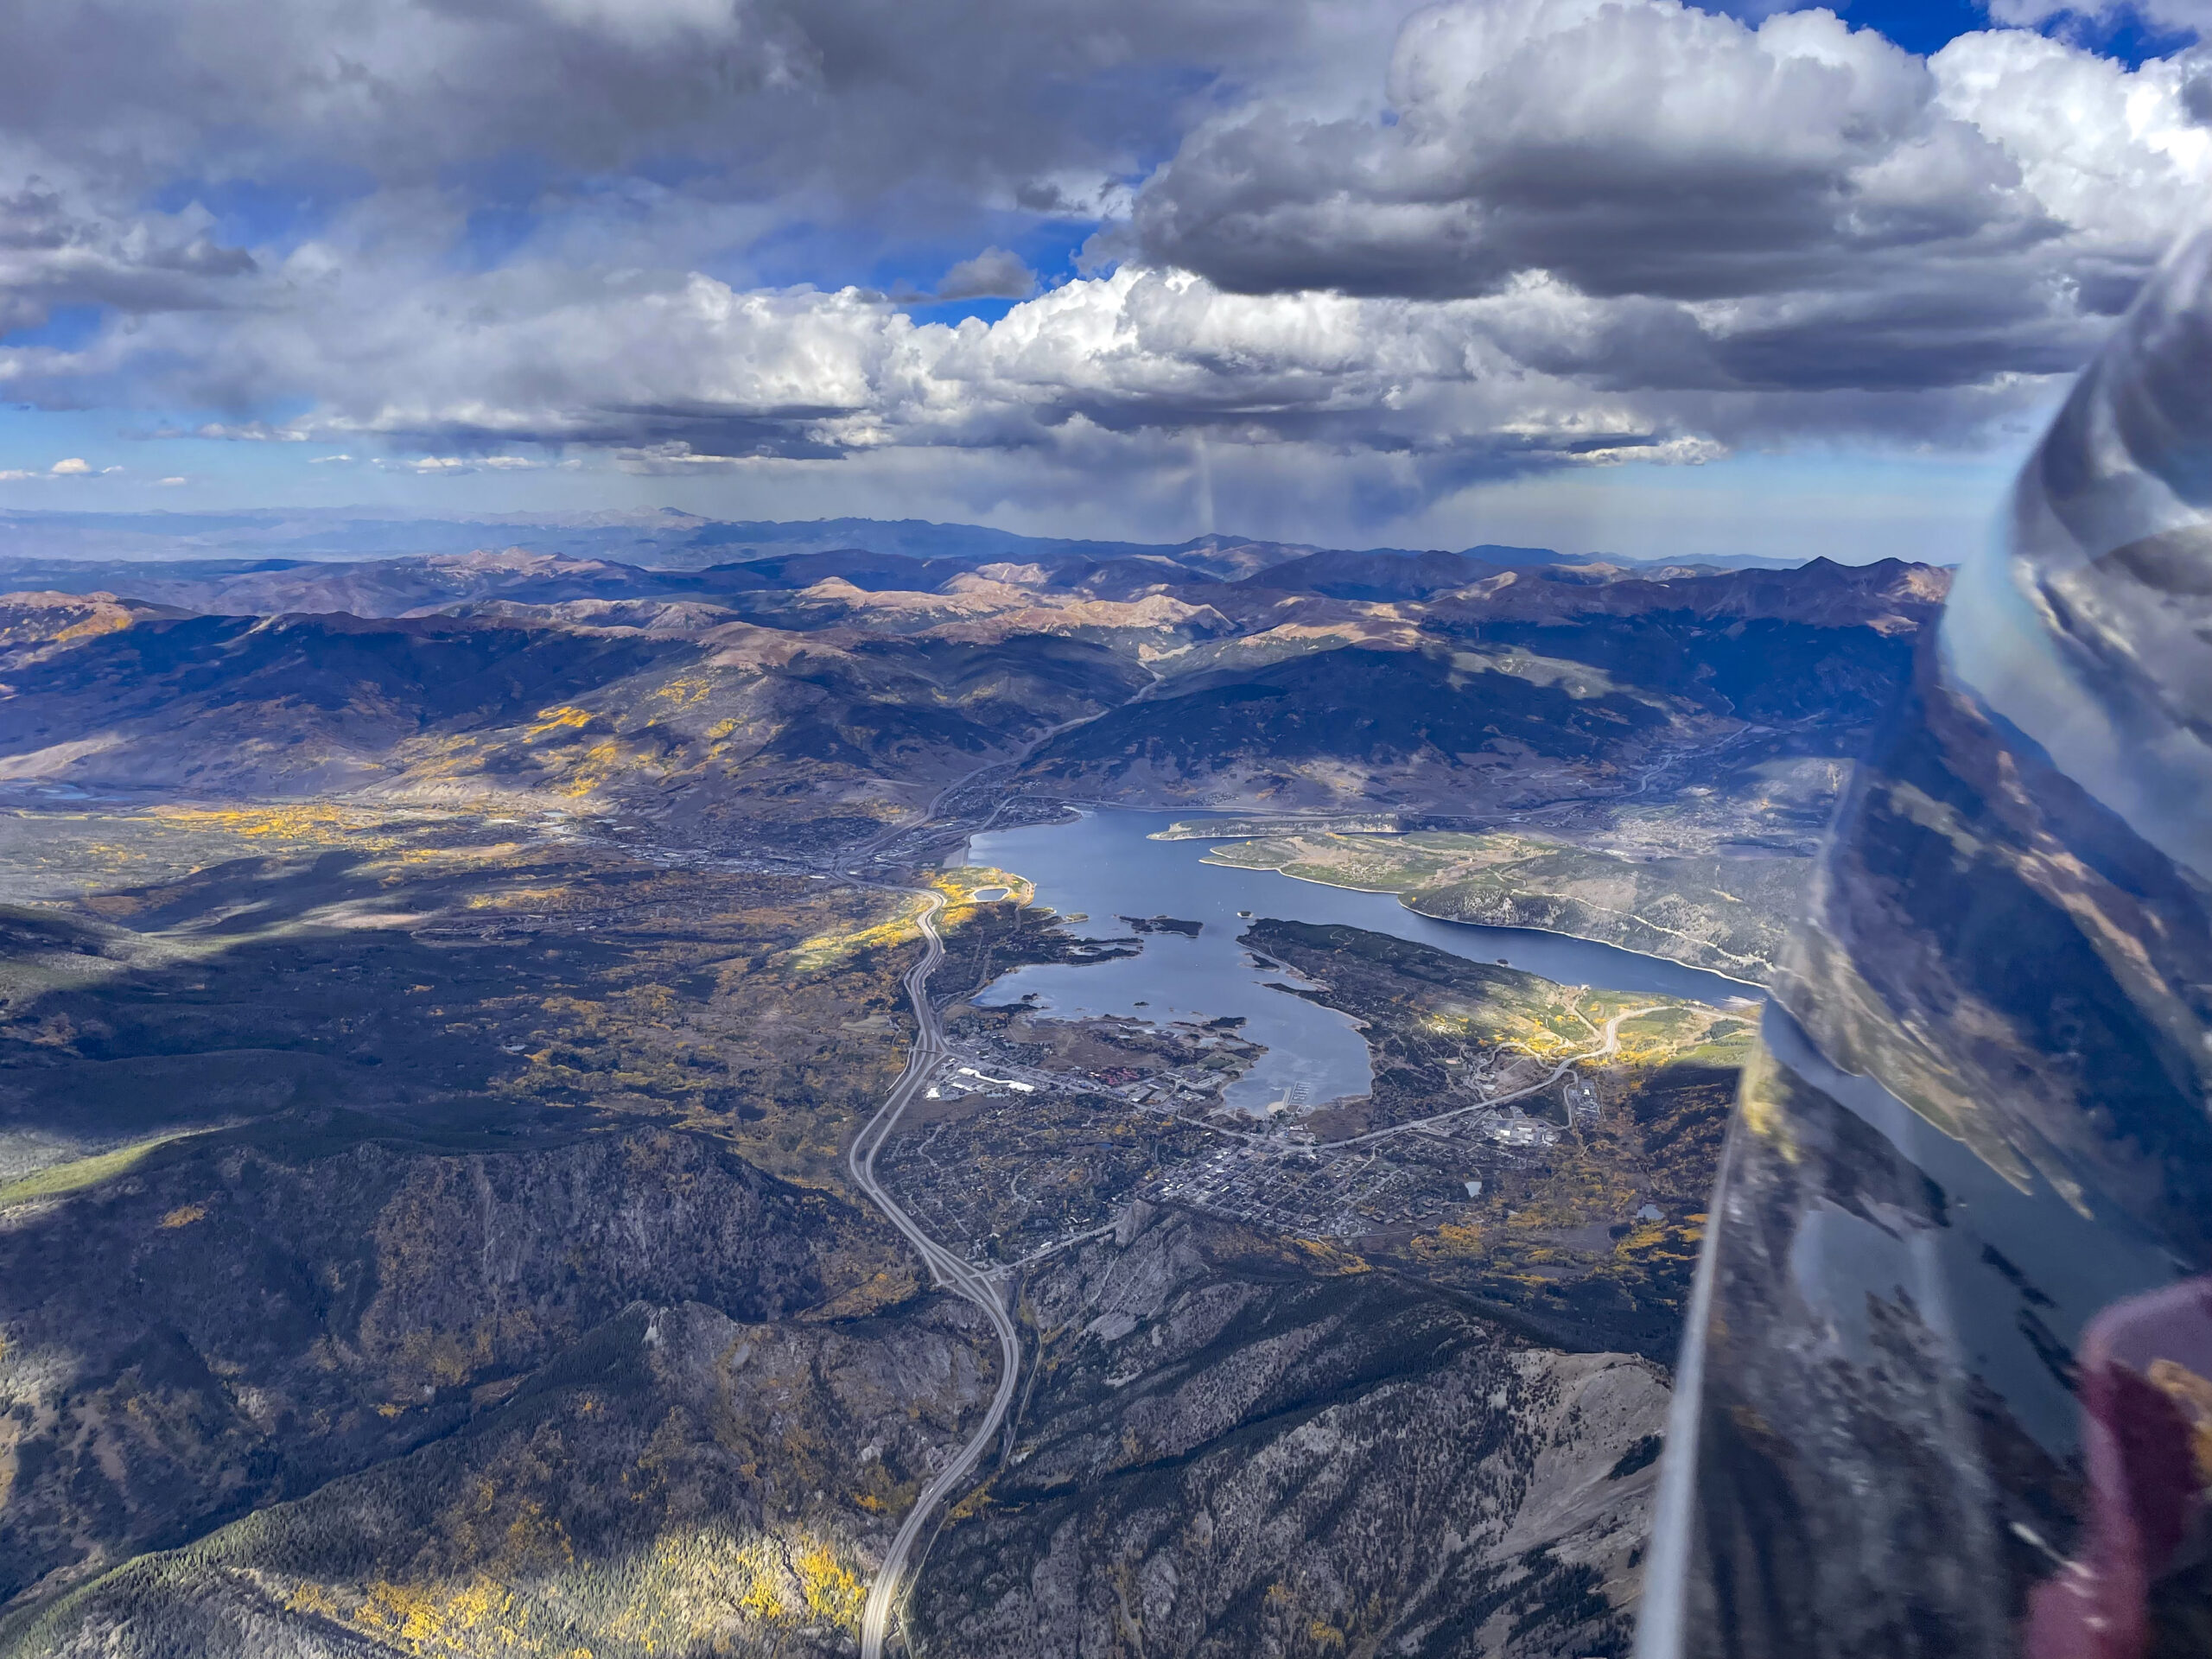
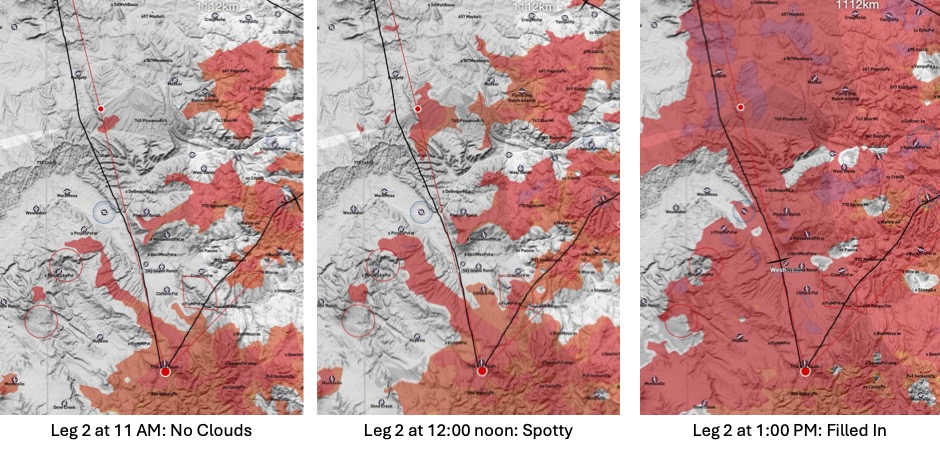
Back in the sun, a good climb to 17,000 ft and the route ahead looked distinctly better.  Unsurprisingly the Gunnison Valley was blue but with clouds along the perimeter to the north and the south.  The south side looked slightly better but would have been a substantial detour. I decided to stay on the north side. There was still a blue gap across the Gunnison river to the west but I expected this to fill in by the time I would get there, just as the forecast had predicted.

The satellite image for my position at that time (11:40 AM).  Note the extent of OD immediately behind the glider icon.  Had I decided to return home at this time, I would have flown straight to the north before tracking east. Traversing back over the Sawatch Range and through South Park no longer looked safe.  Also note that there was still a blue gap over the Gunnison to the west.  This would close by the time I got there 30 minutes later.

I kept going as the route ahead looked better than anything I had seen so far.  There was one last bout of virga near Crested Butte, but the sky towards the west kept improving as the forecast had suggested.

At 12:26 PM I crossed the Black Canyon of the Gunnison.
Nice clouds had formed in time just over my crossing while the rest of the Gunnison Valley was still blue. The Black Canyon is below, the Blue Mesa Reservoir is center left.

I could now see a clear route to my first turnpoint.  It looked easy to reach without a slow down.  This gave me the time to start to look ahead towards the second leg.  At 12:30 PM there were still big blue gaps. Plus there was another concern: a thick line of virga to north of Grand Junction.

20 minutes ahead of reaching turn point 1 I began to wonder about the second leg.  There were 2 concerns: (1) a lot of blue sky except for one line of clouds above the Uncompahgre Plateau, and (2) a solid wall of virga above the Book Cliffs north of Grand Junction.

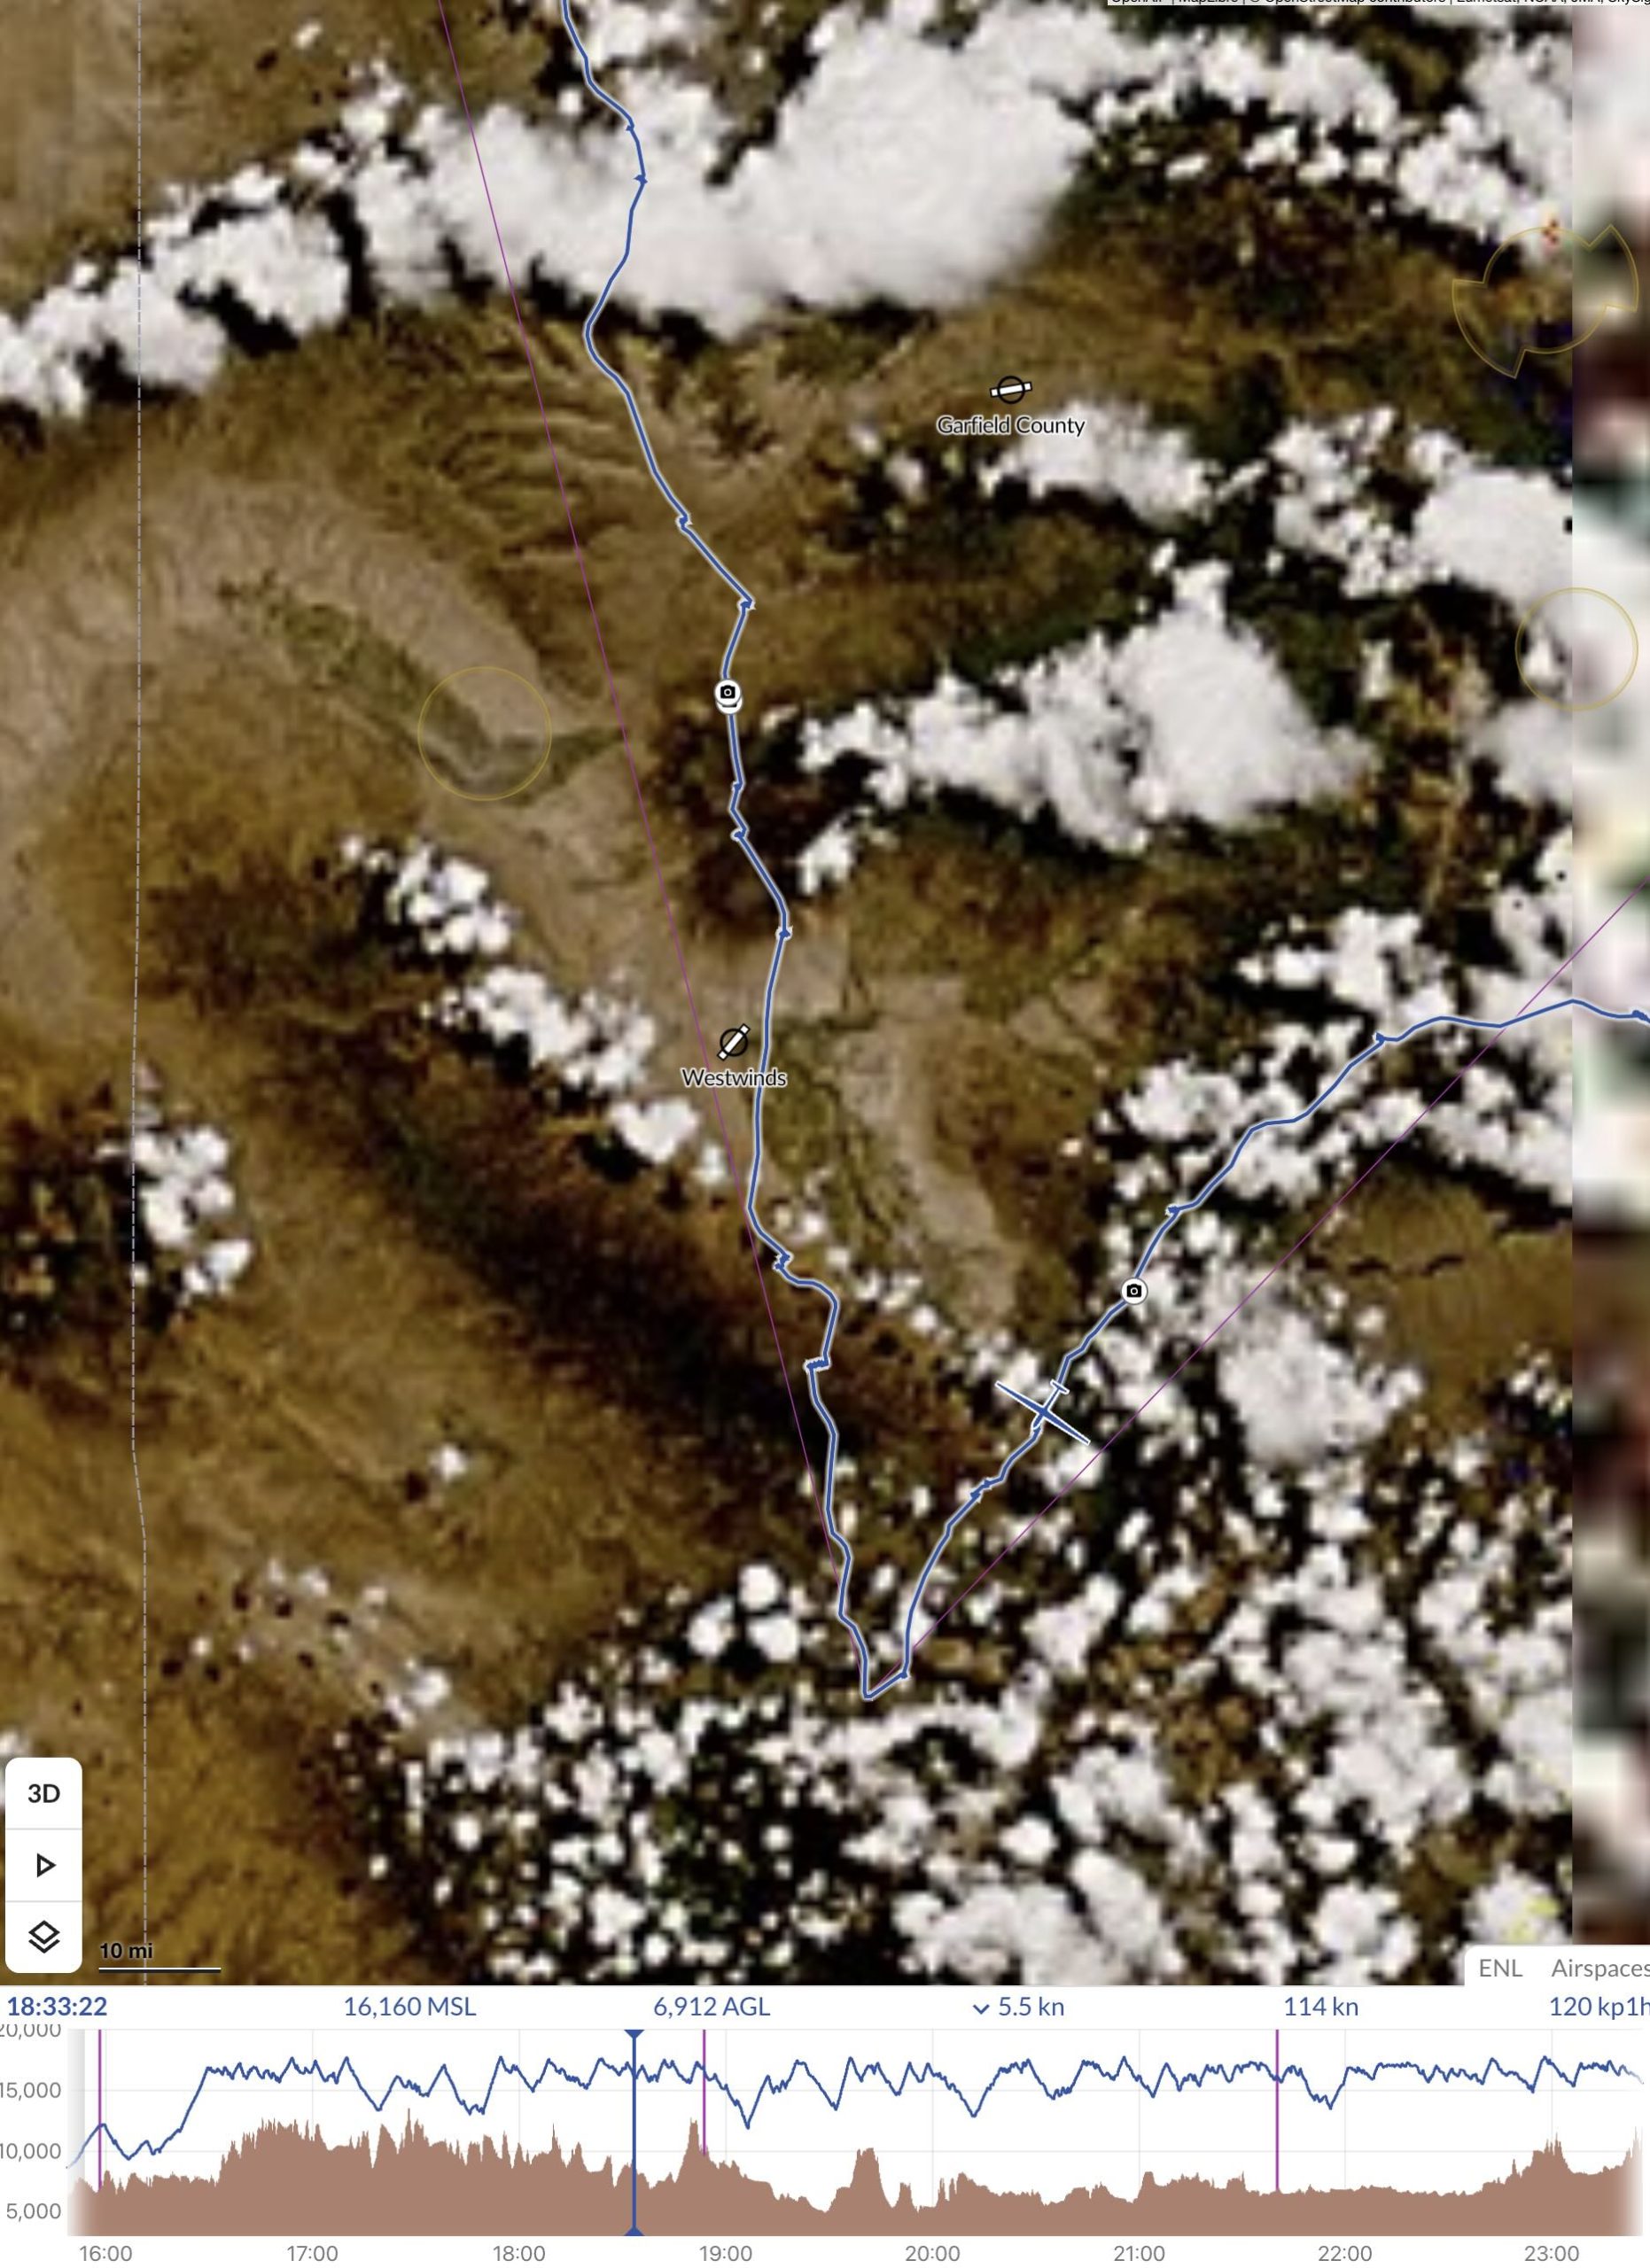
I had hope that the blue gaps would fill in within the next 30 minutes, just per the forecast.  With respect to the virga over the Book Cliffs, it was not unexpected either but it looked more formidable than I had anticipated.  I decided I would stay on plan for now and assess the situation later as I got closer.

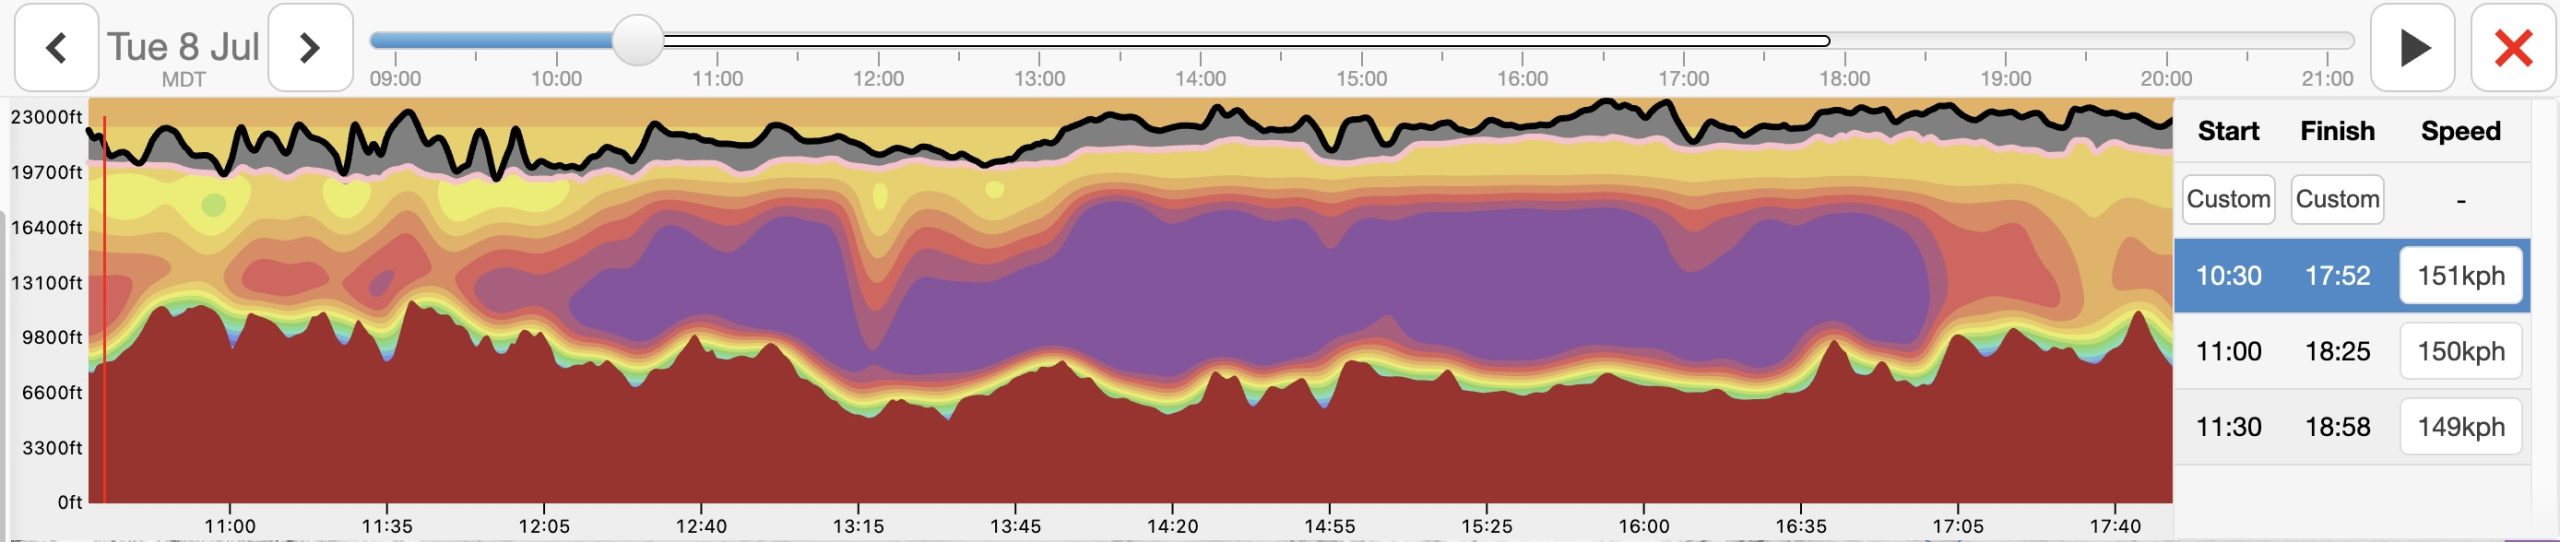
At 12:53 I reached my turnpoint northwest of Telluride.  Despite the initial detour on my first leg, I had only lost 7 minutes against my timeline and was still 23 minutes ahead of schedule. My average task speed showed 108 kph despite the headwind, in line with my expectations.  So far so good.

Leg 2

There weren’t a lot of clouds as I started my second leg, but there were some.  In my experience, clouds tend to be more reliable the fewer there are. Which makes sense: if it takes a particularly strong thermal to form a cloud, my logic goes, then the odds that a cloud has a good thermal underneath must go up. Plus, more clouds would pop soon if the the forecast was right.  I reminded myself to be patient because I was still running ahead of schedule.

A few clouds is a lot better than no clouds.  In fact, a few clouds is all you need if the ones that exist will work.

On my way to the first clouds I primarily noticed a lot of sink.  12 minutes after rounding TP1, I found myself down at 12,100 ft, the lowest I had been on the entire flight since the start.  Fortunately, a solid 7 kt climb under the first cloud took me back to 16,000 feet within 5 minutes.

A second climb over the Uncompahgre Plateau took me to 17,500.  Now there was a decision to make.  Should I follow the strong line of clouds along the plateau to the northwest or transition through a wide blue hole and stay closer to the course line?

The line to the NW promised much faster progress but I concluded that it might end nowhere: with a 50-60 mile gap to the north that’s simply too wide to cross.

I decided to better take the gaps in junks, head directly north, and transition to two newly building clouds above the Grand Mesa, north of Delta. That worked great: I was rewarded with my first 11 kt average climb of the day, taking me back to 17,600 ft.  Then another blue gap across the Colorado towards the Book Cliffs.

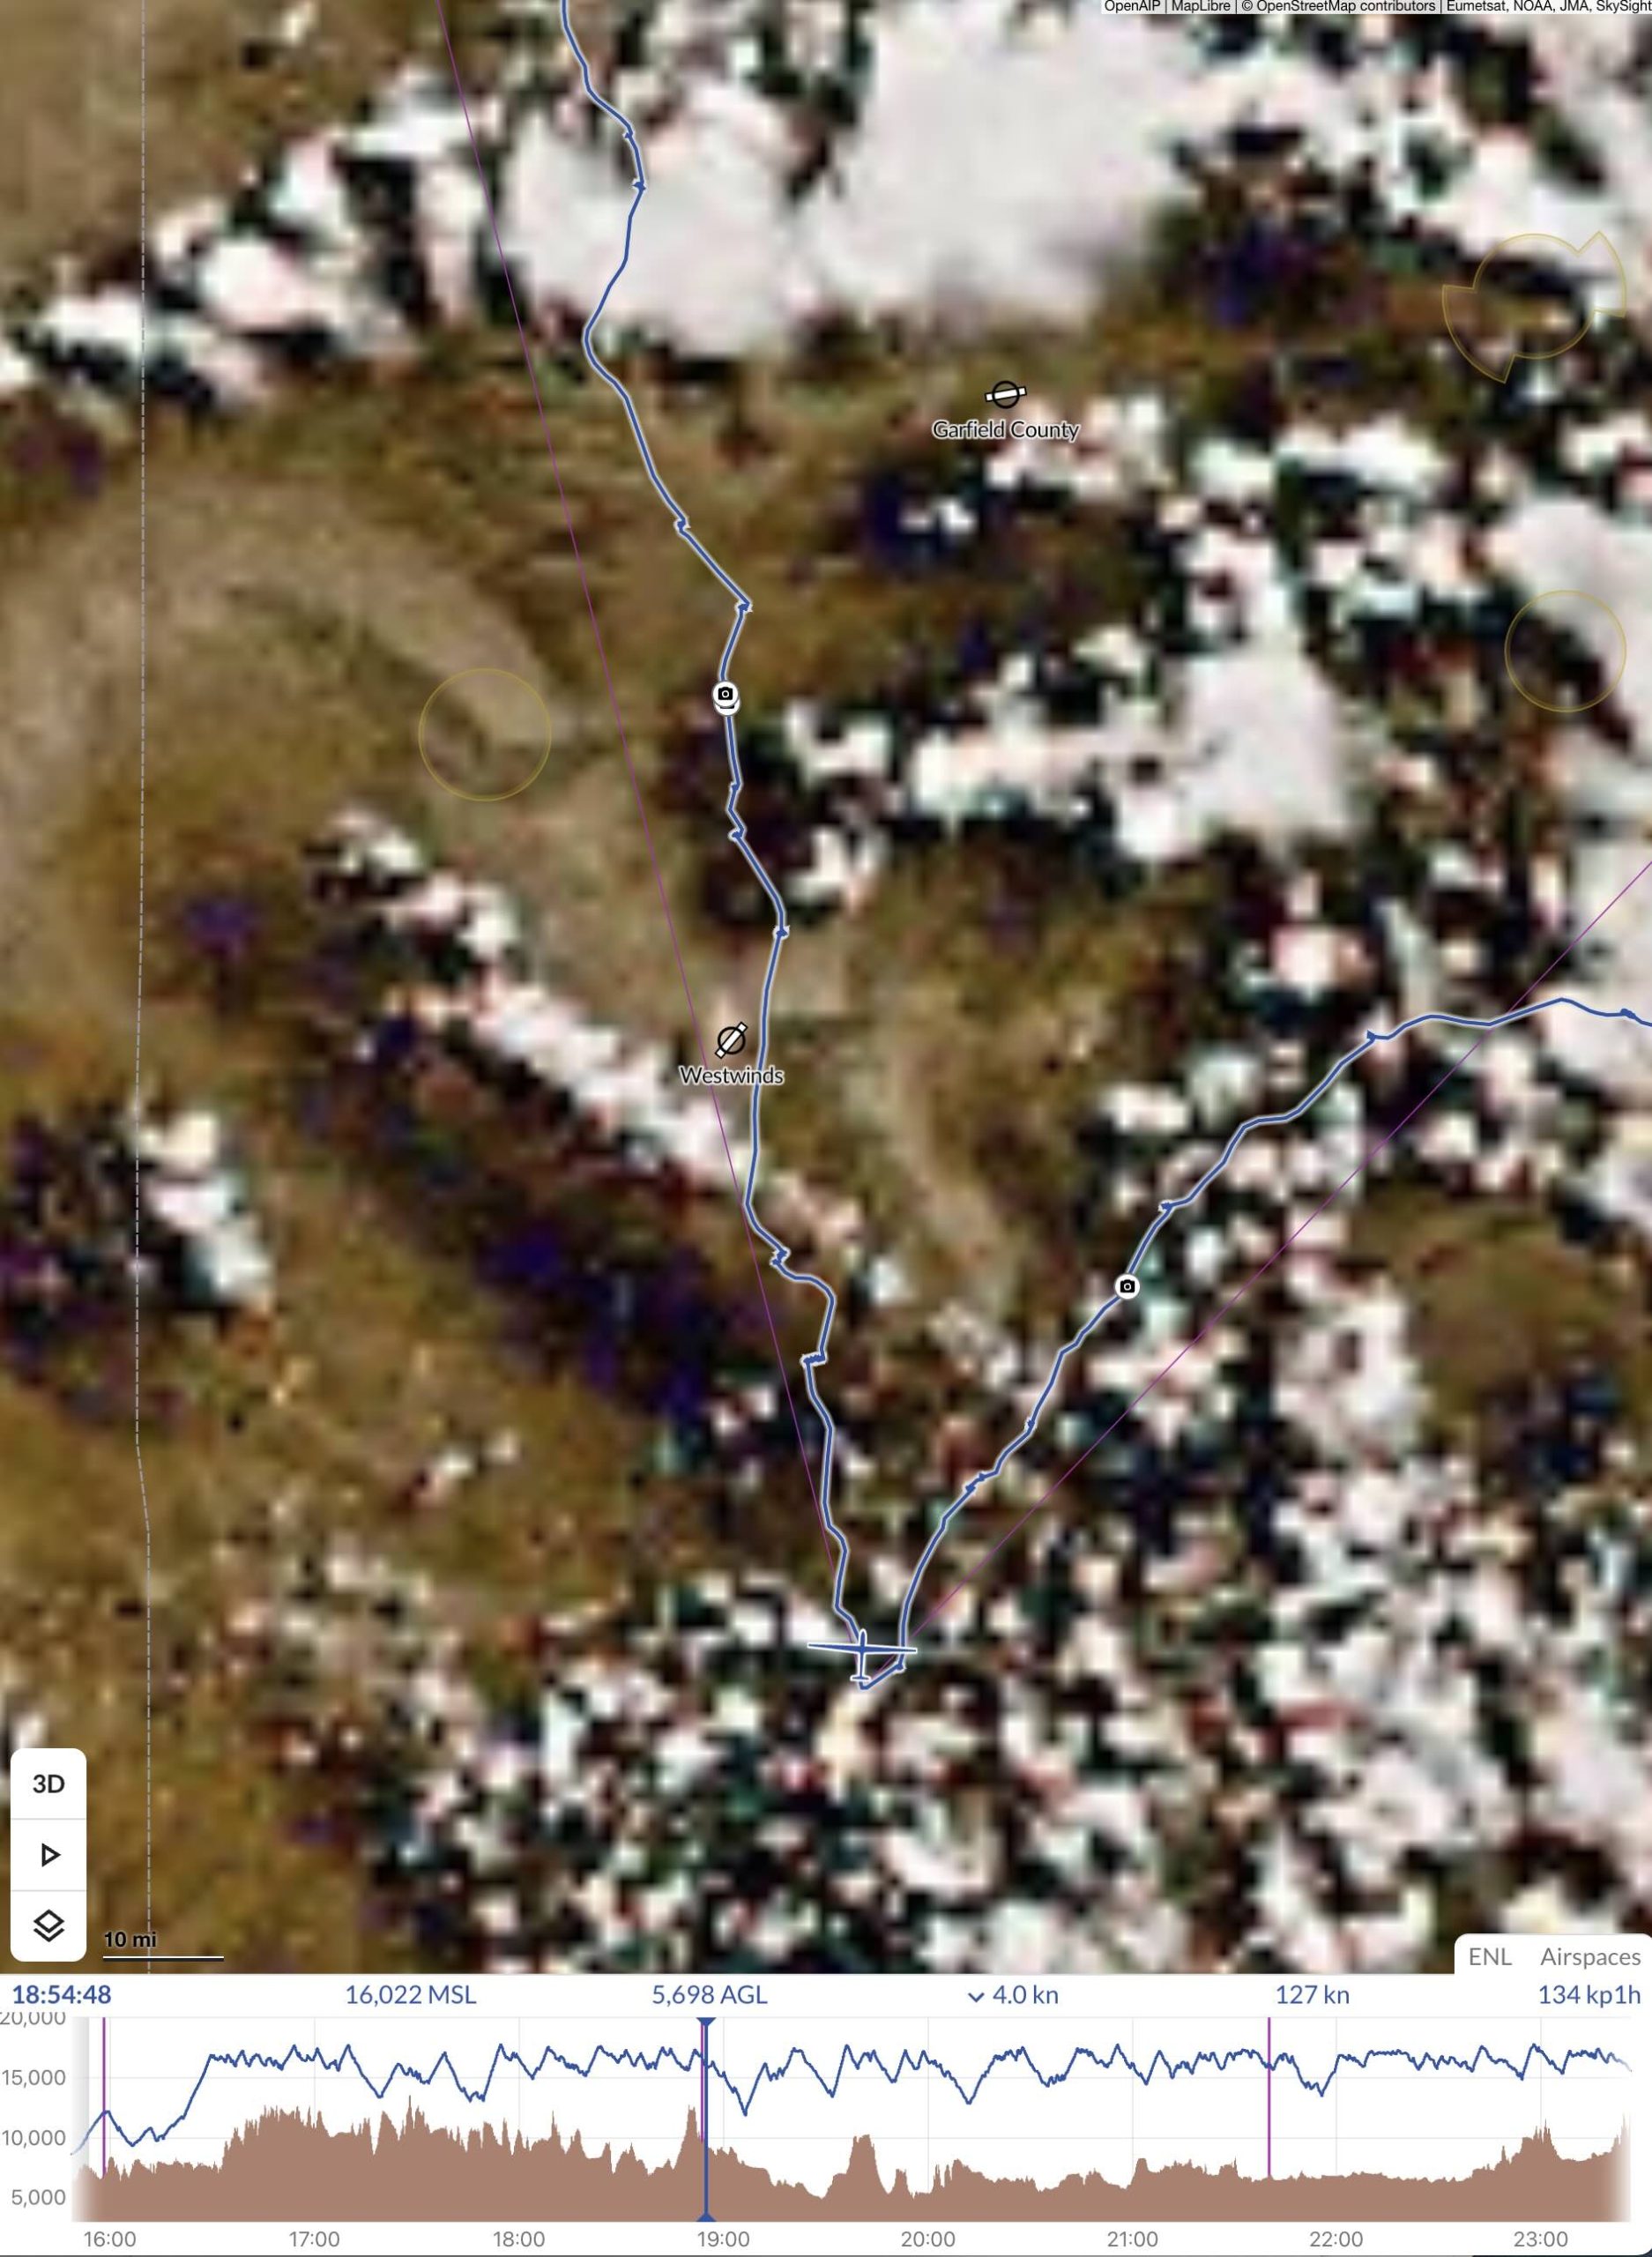
By now I could also see to my delight that the wall of virga over the Book Cliffs had started to crumble and that a promising sea of nice cumulus clouds lay behind. With that, my prior apprehension about this obstacle faded away.

The “wall of virga” over the Book Cliffs. At 1:09 PM (just after roundng TP1) it had looked almost impenetrable. As I got close 40 minutes later it had developed cracks that a line could be woven through.

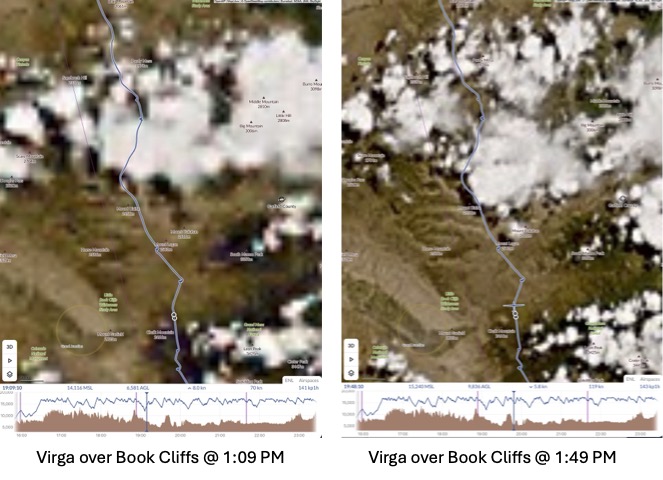
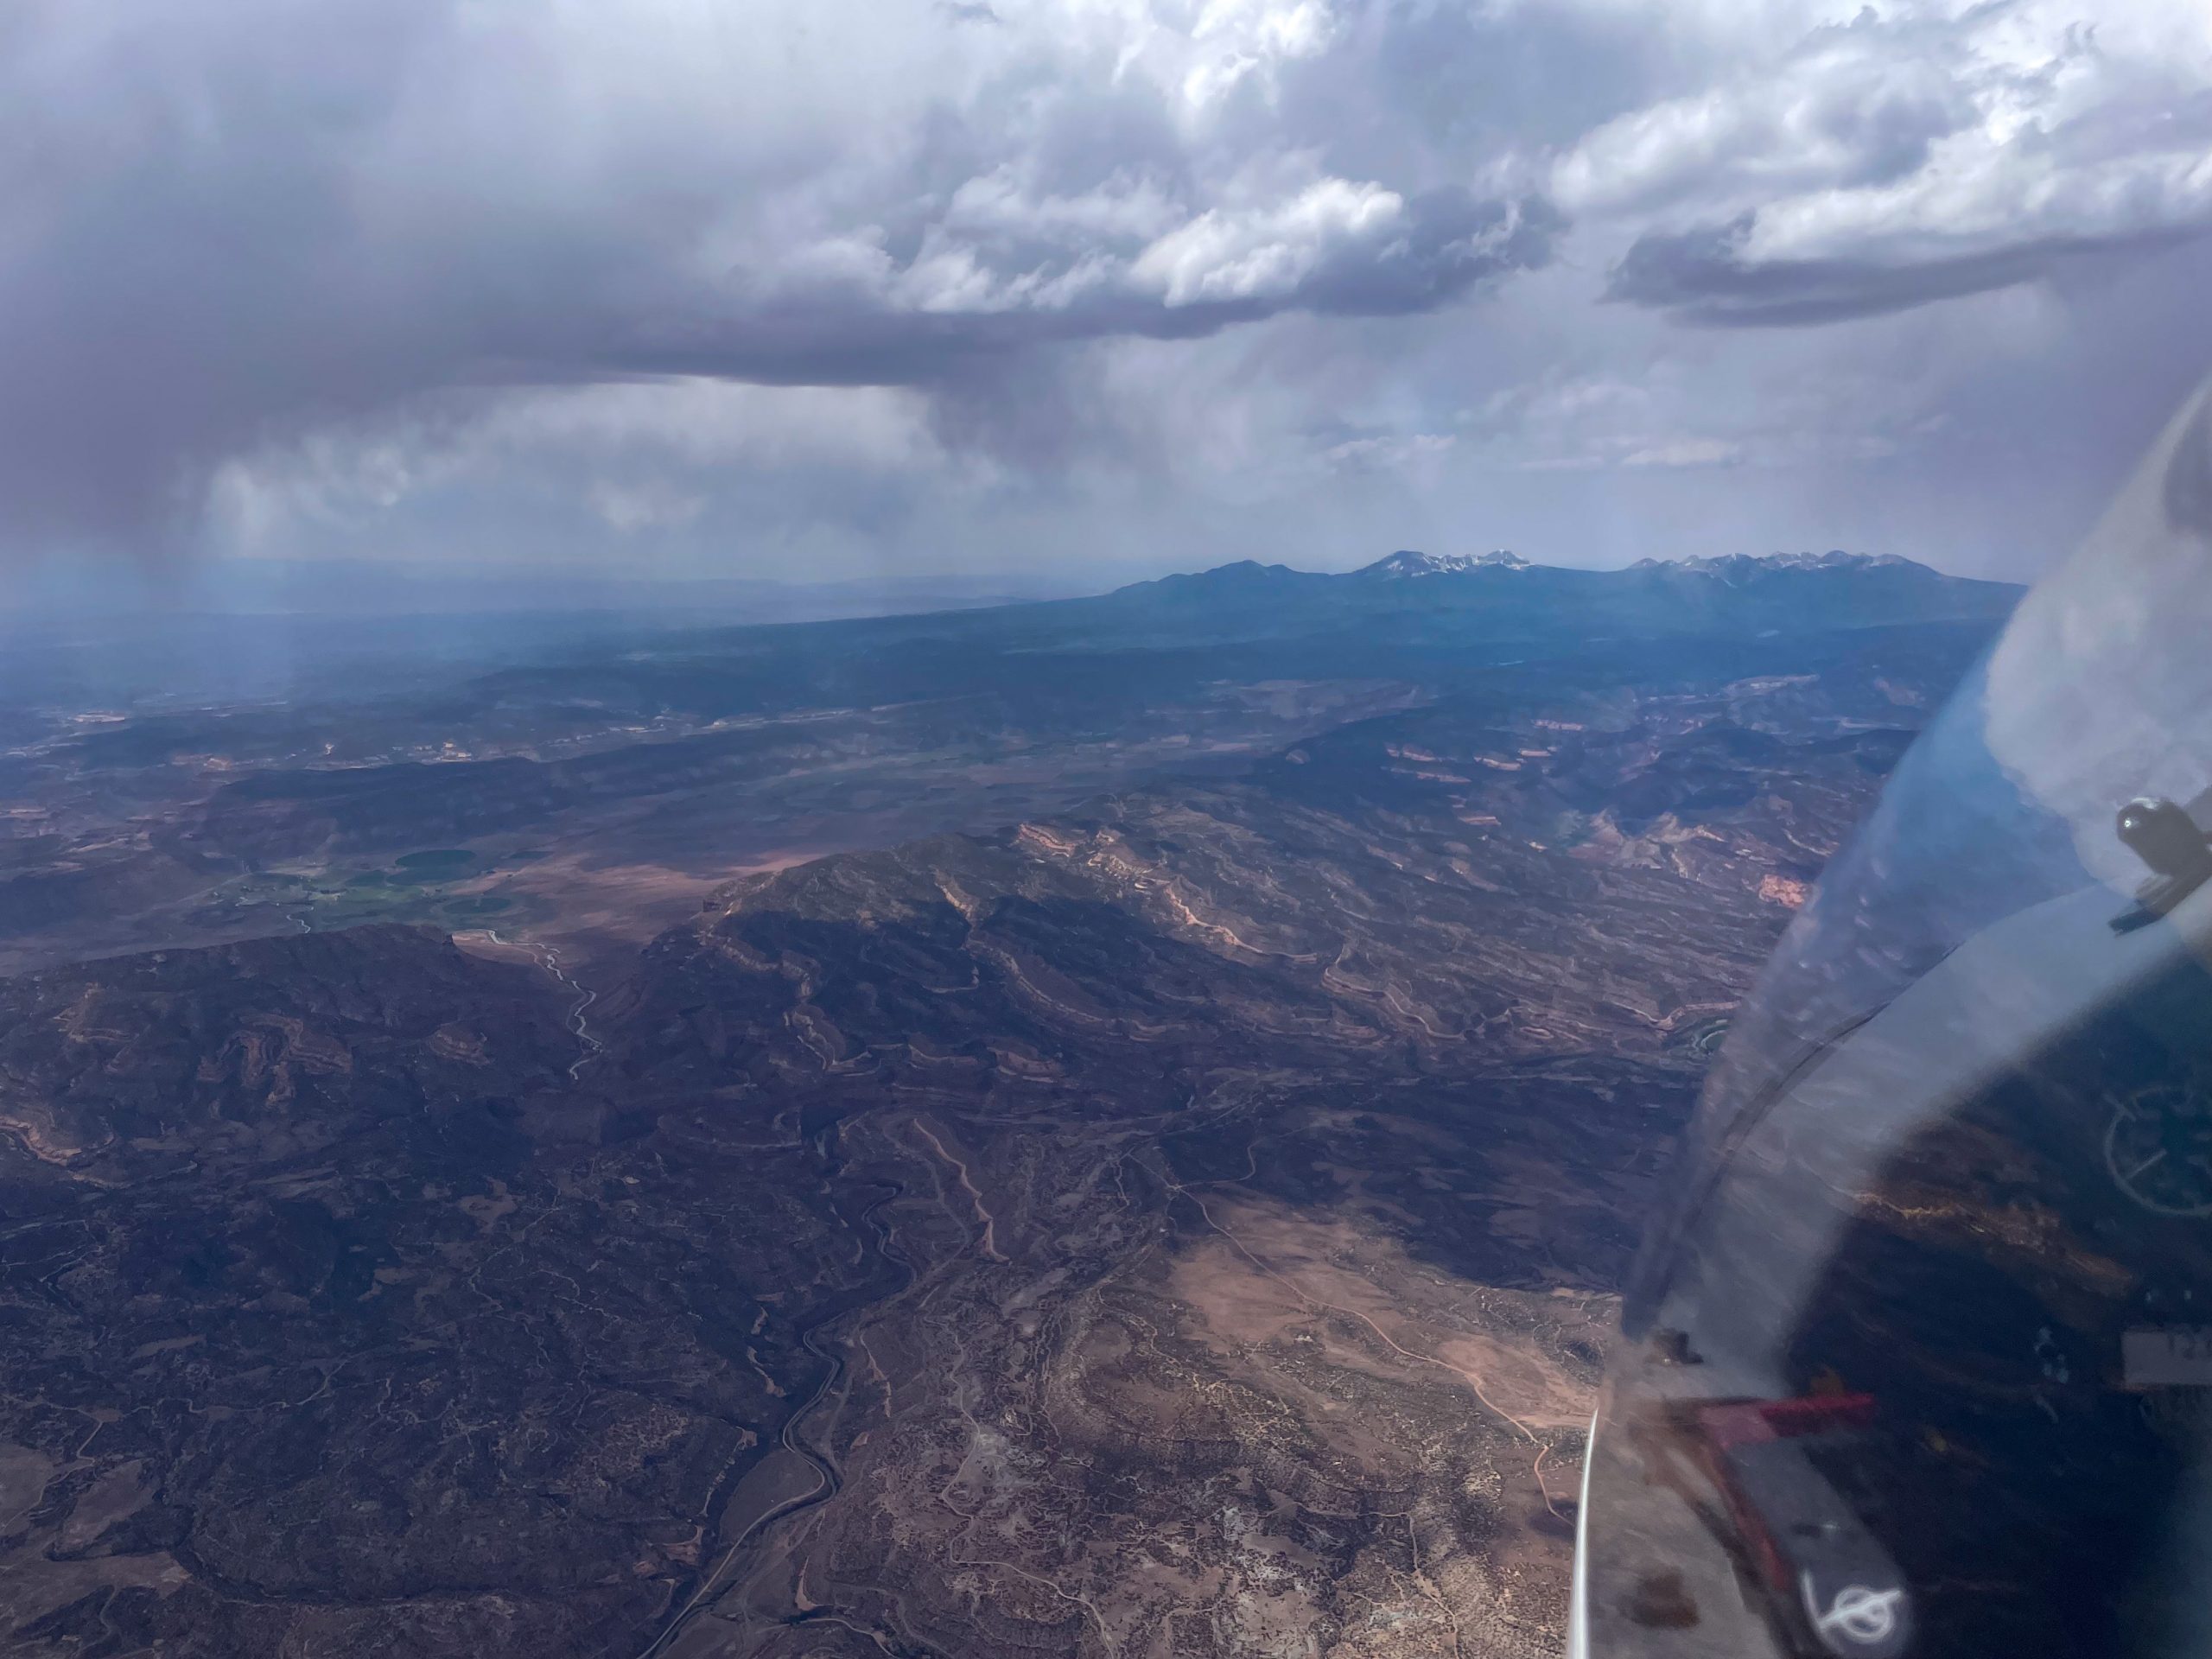
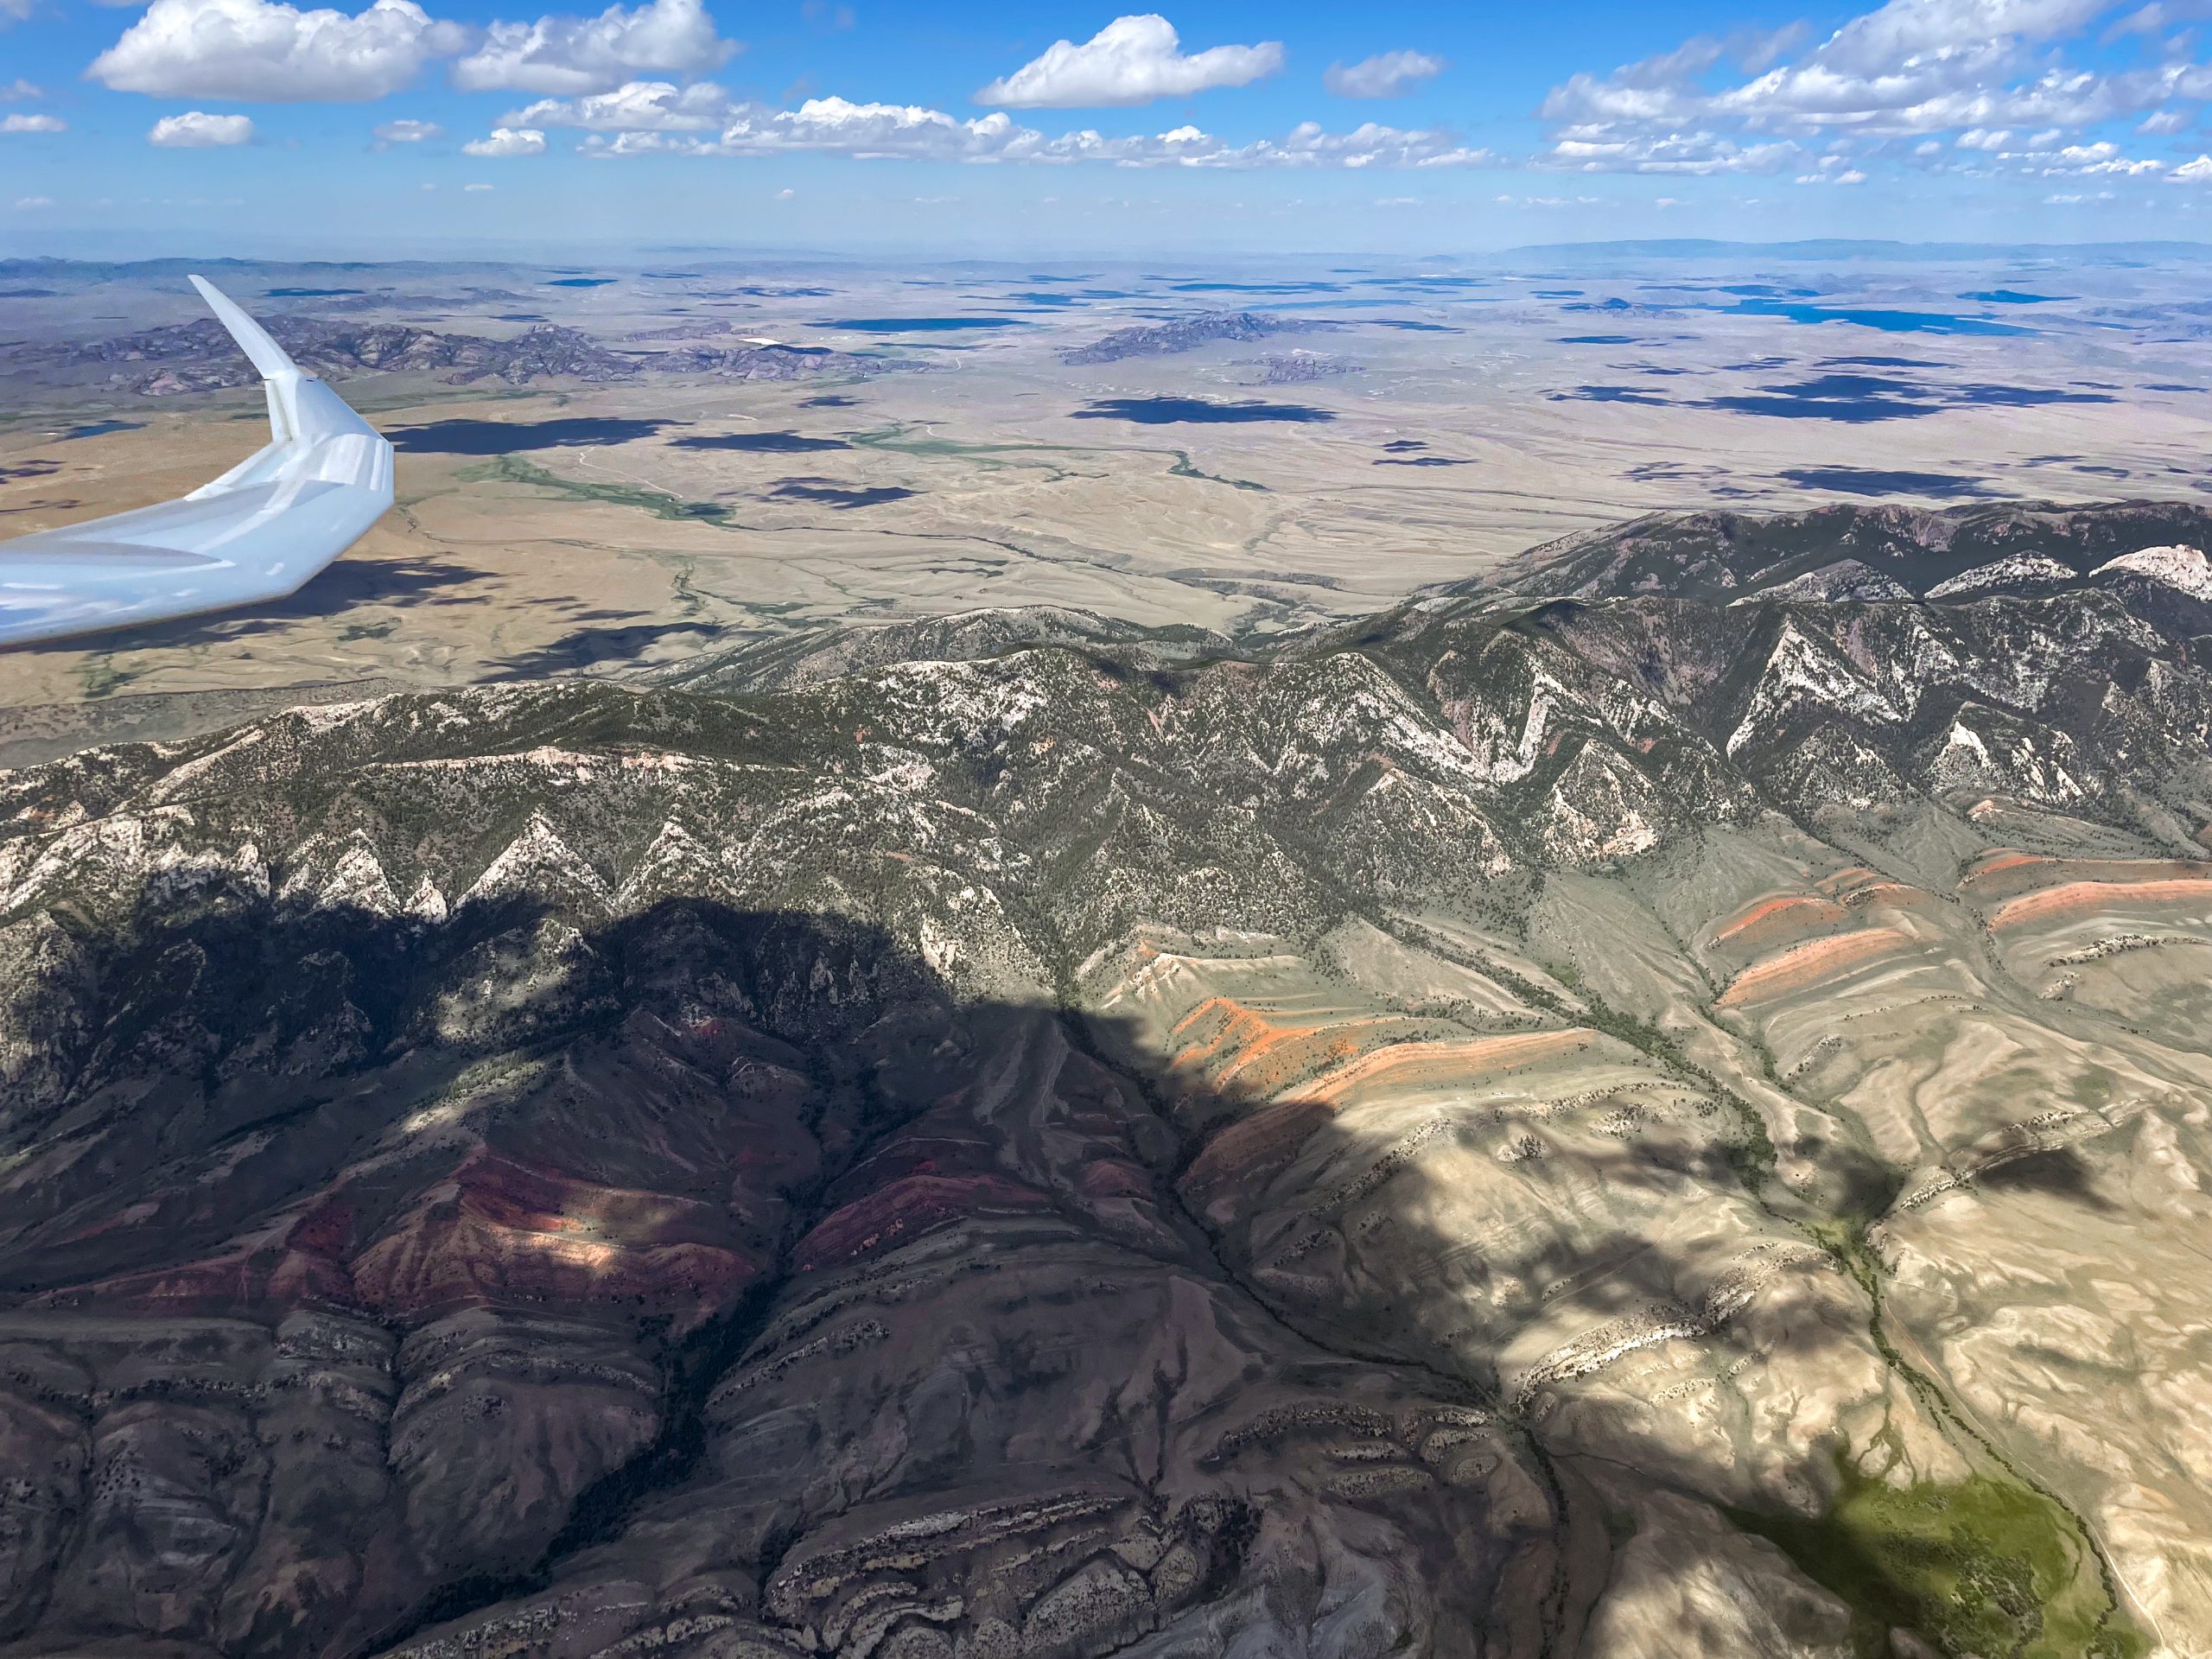
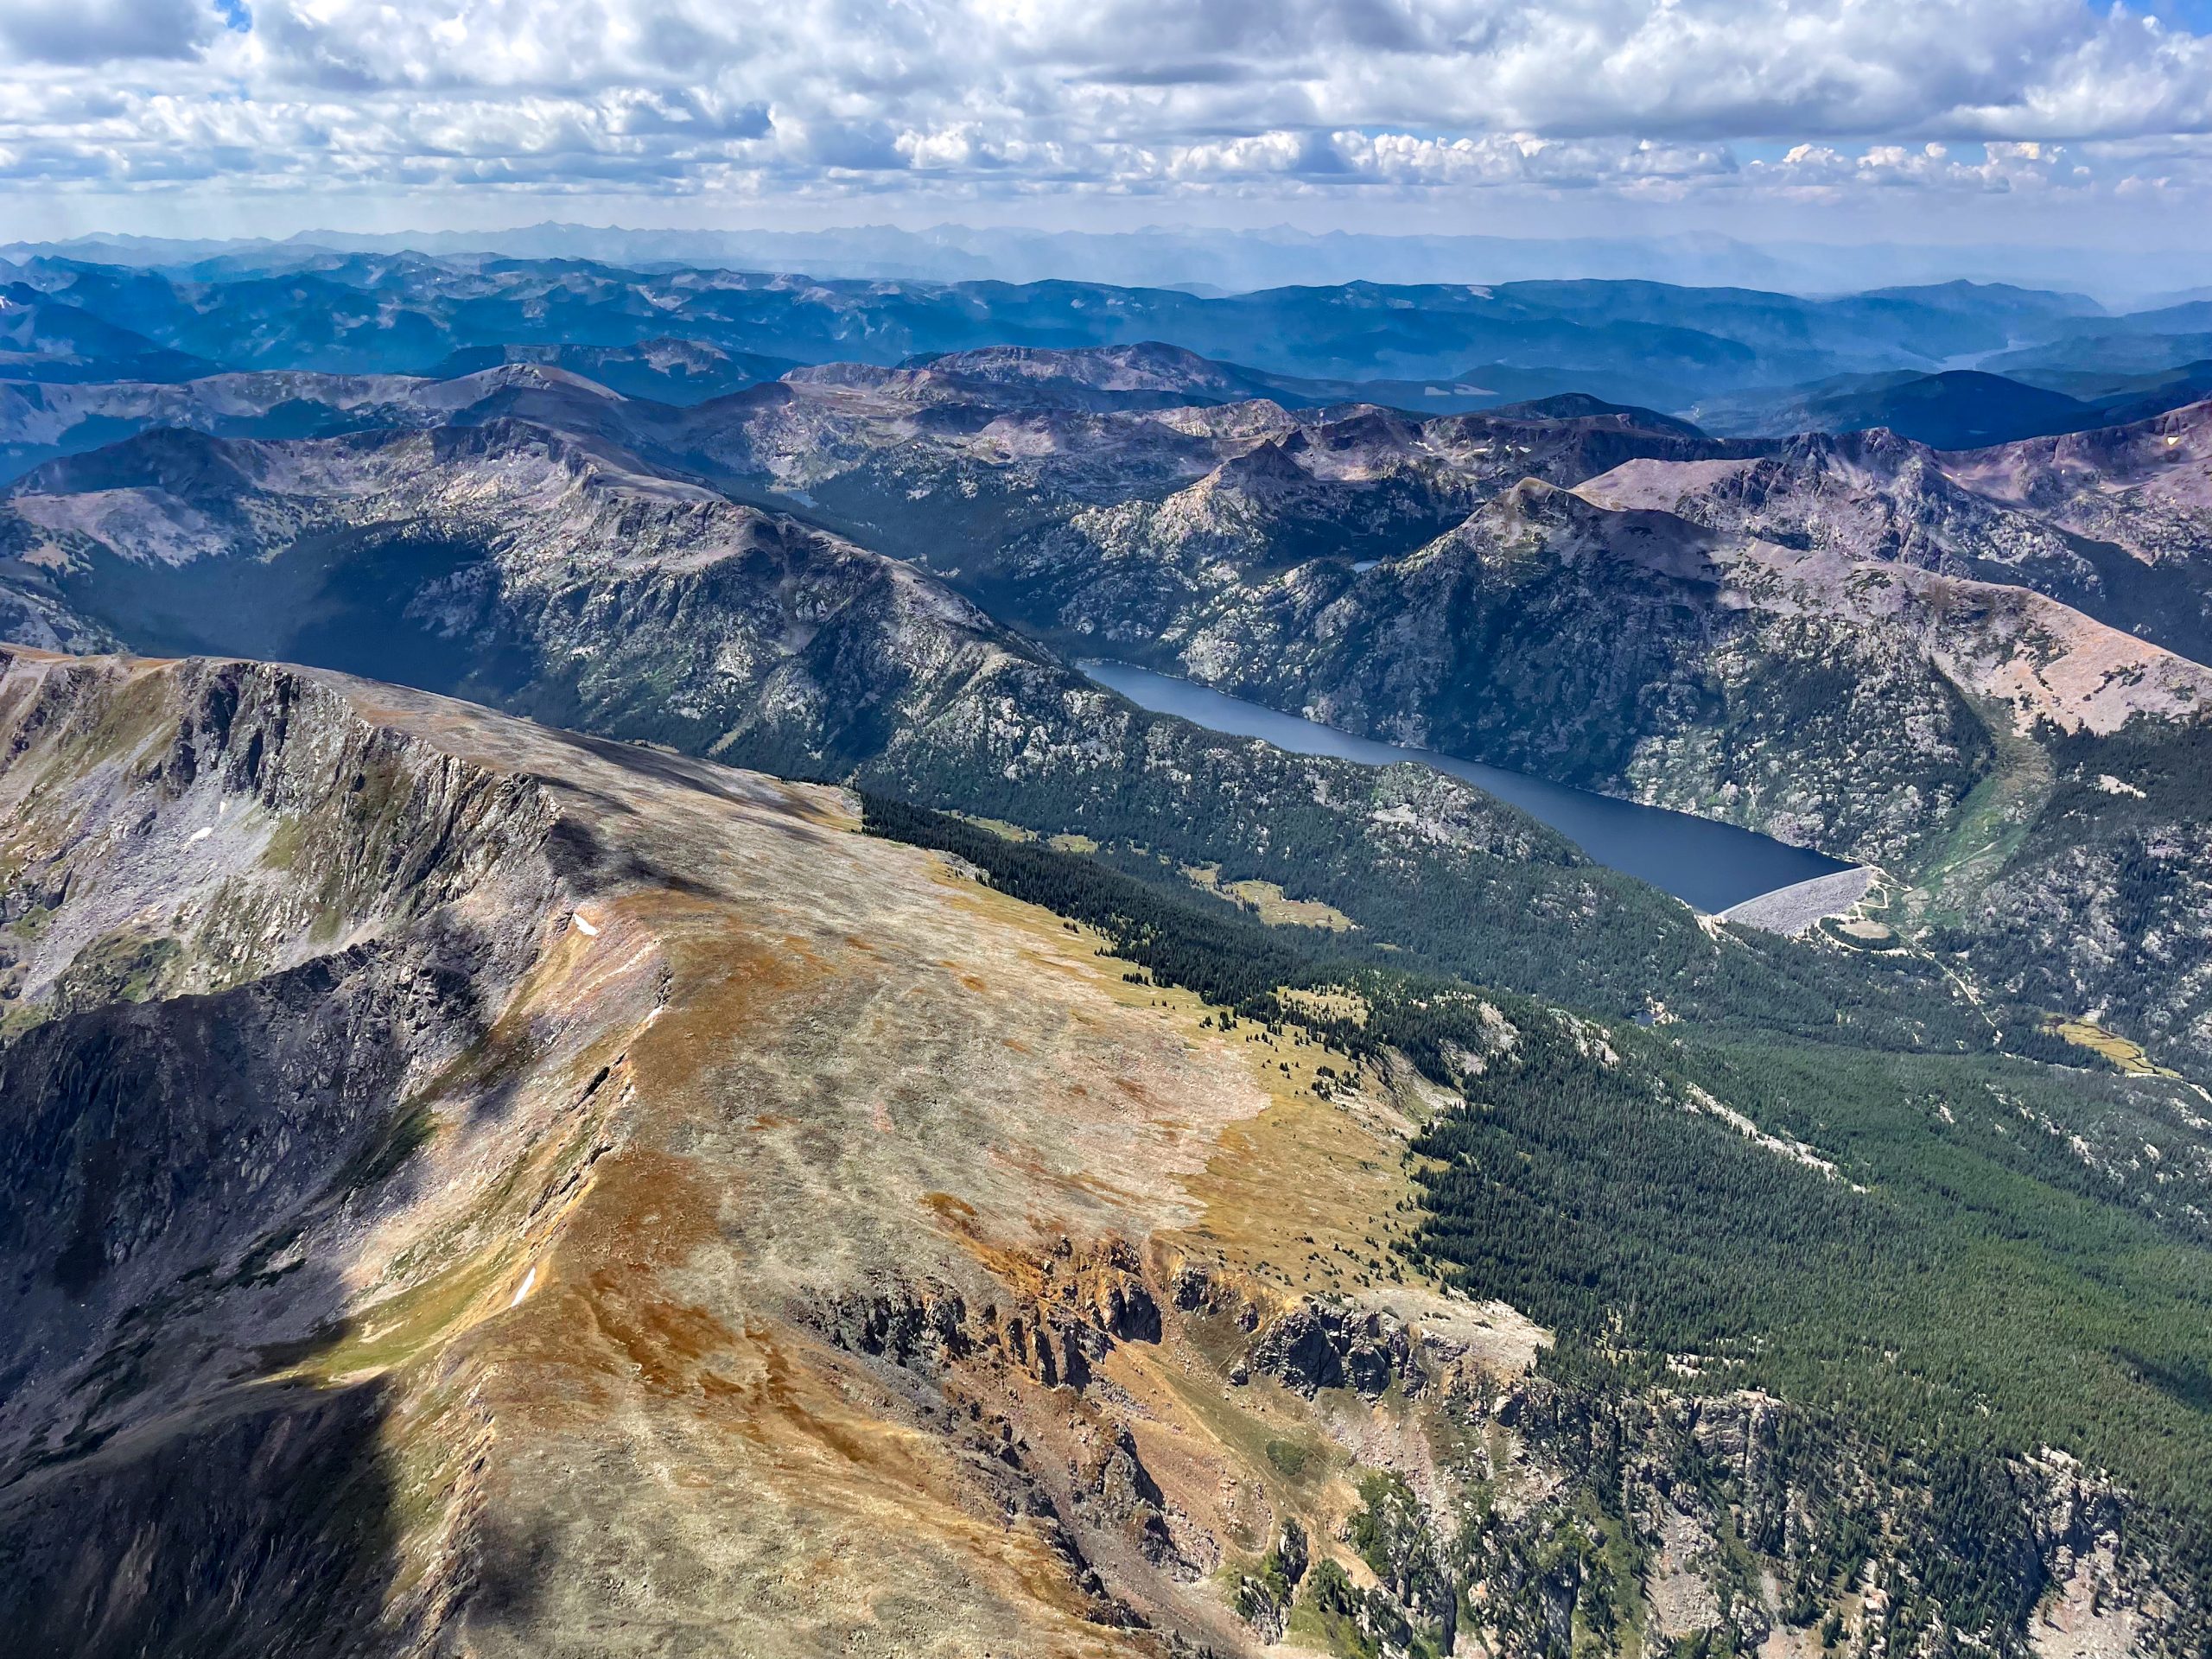
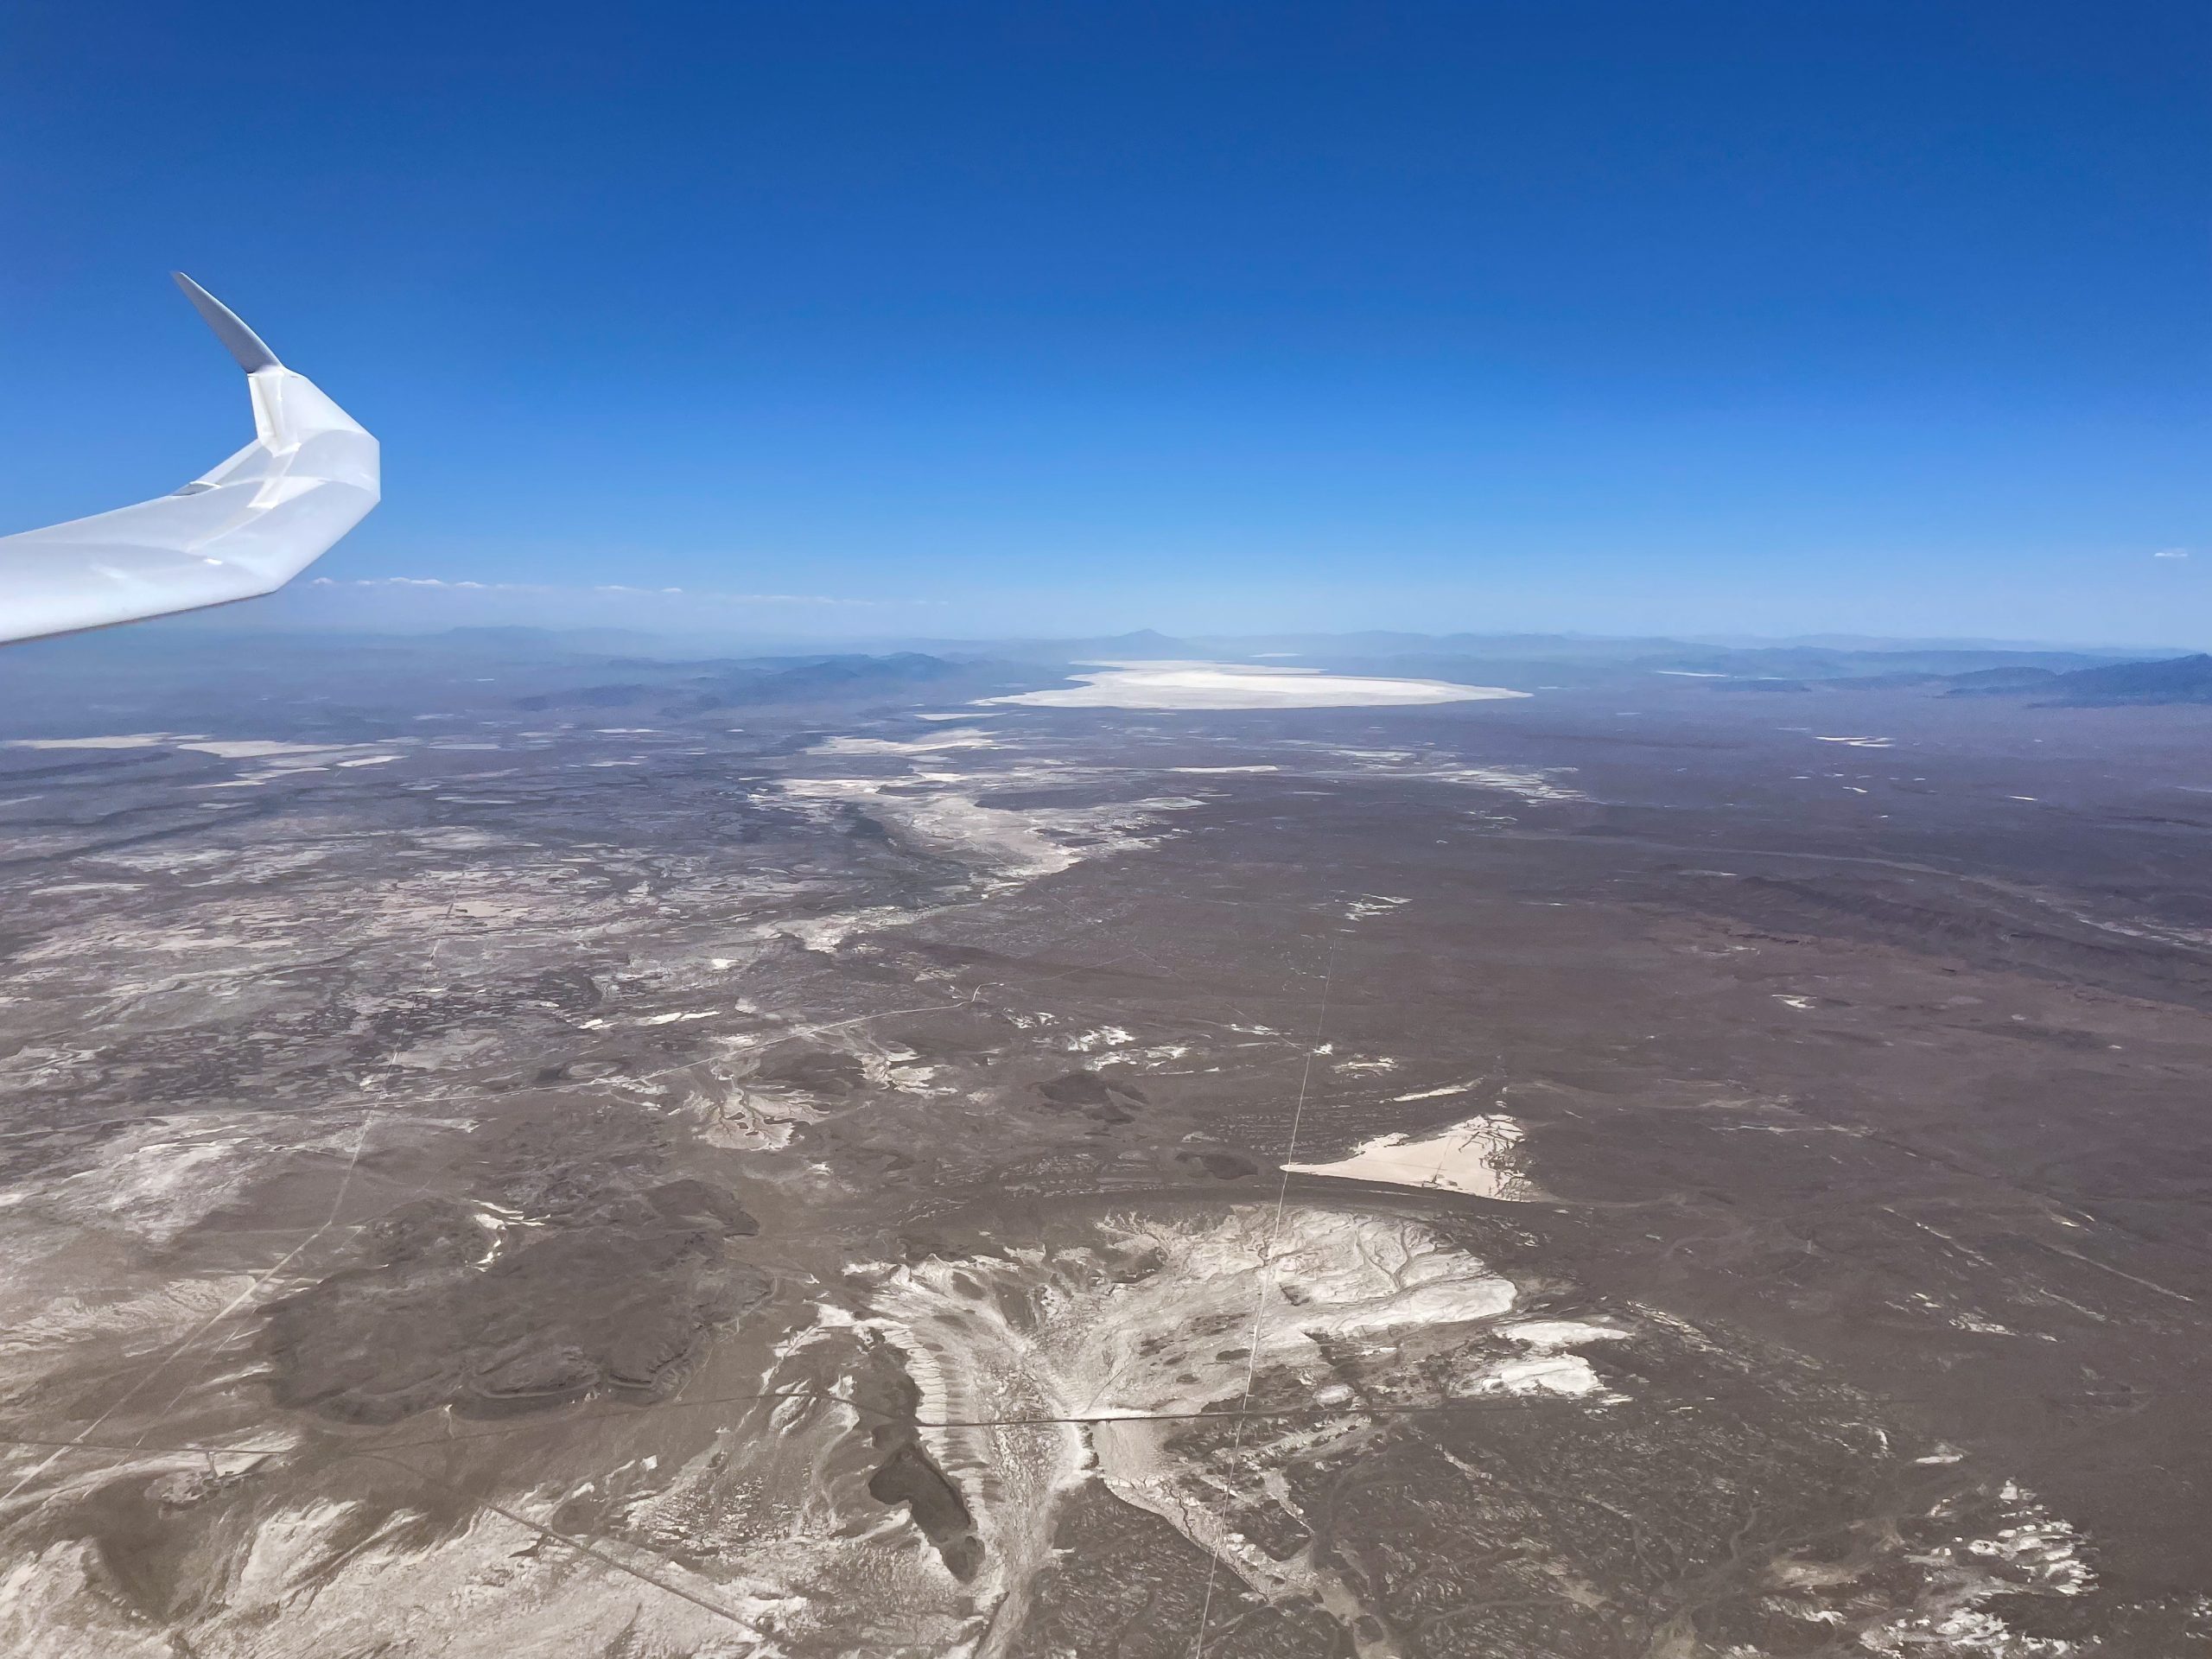
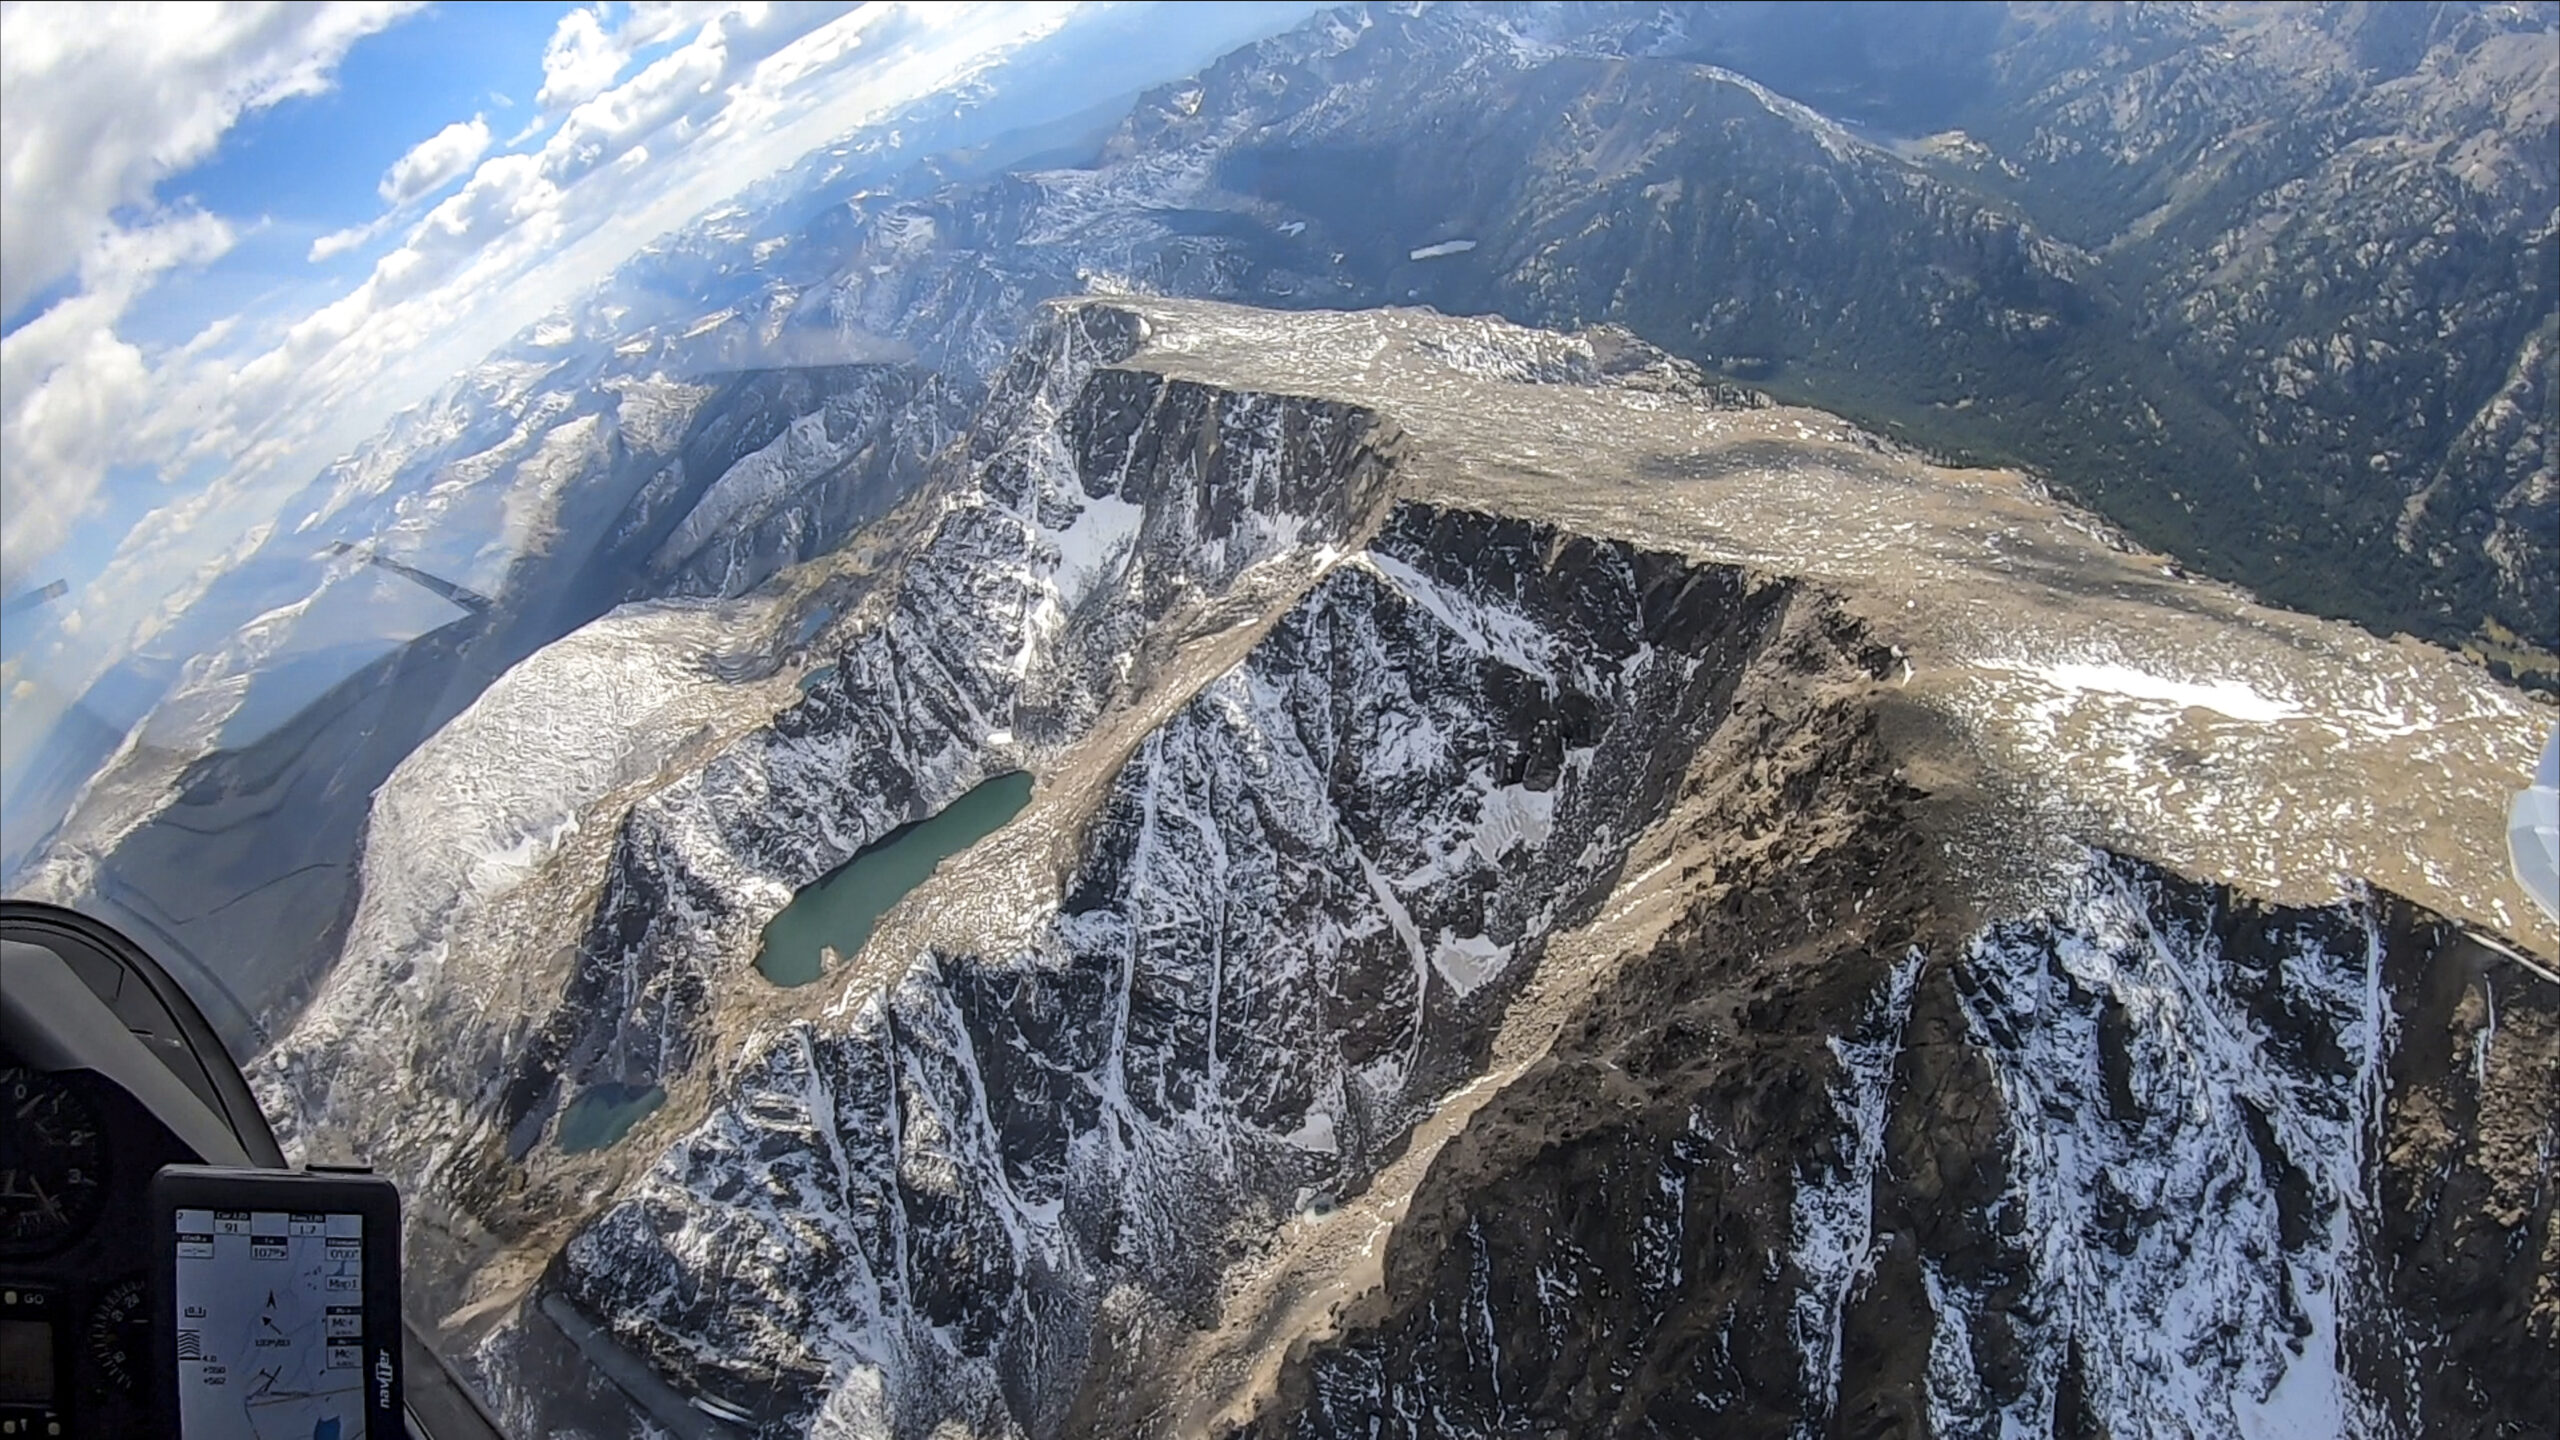
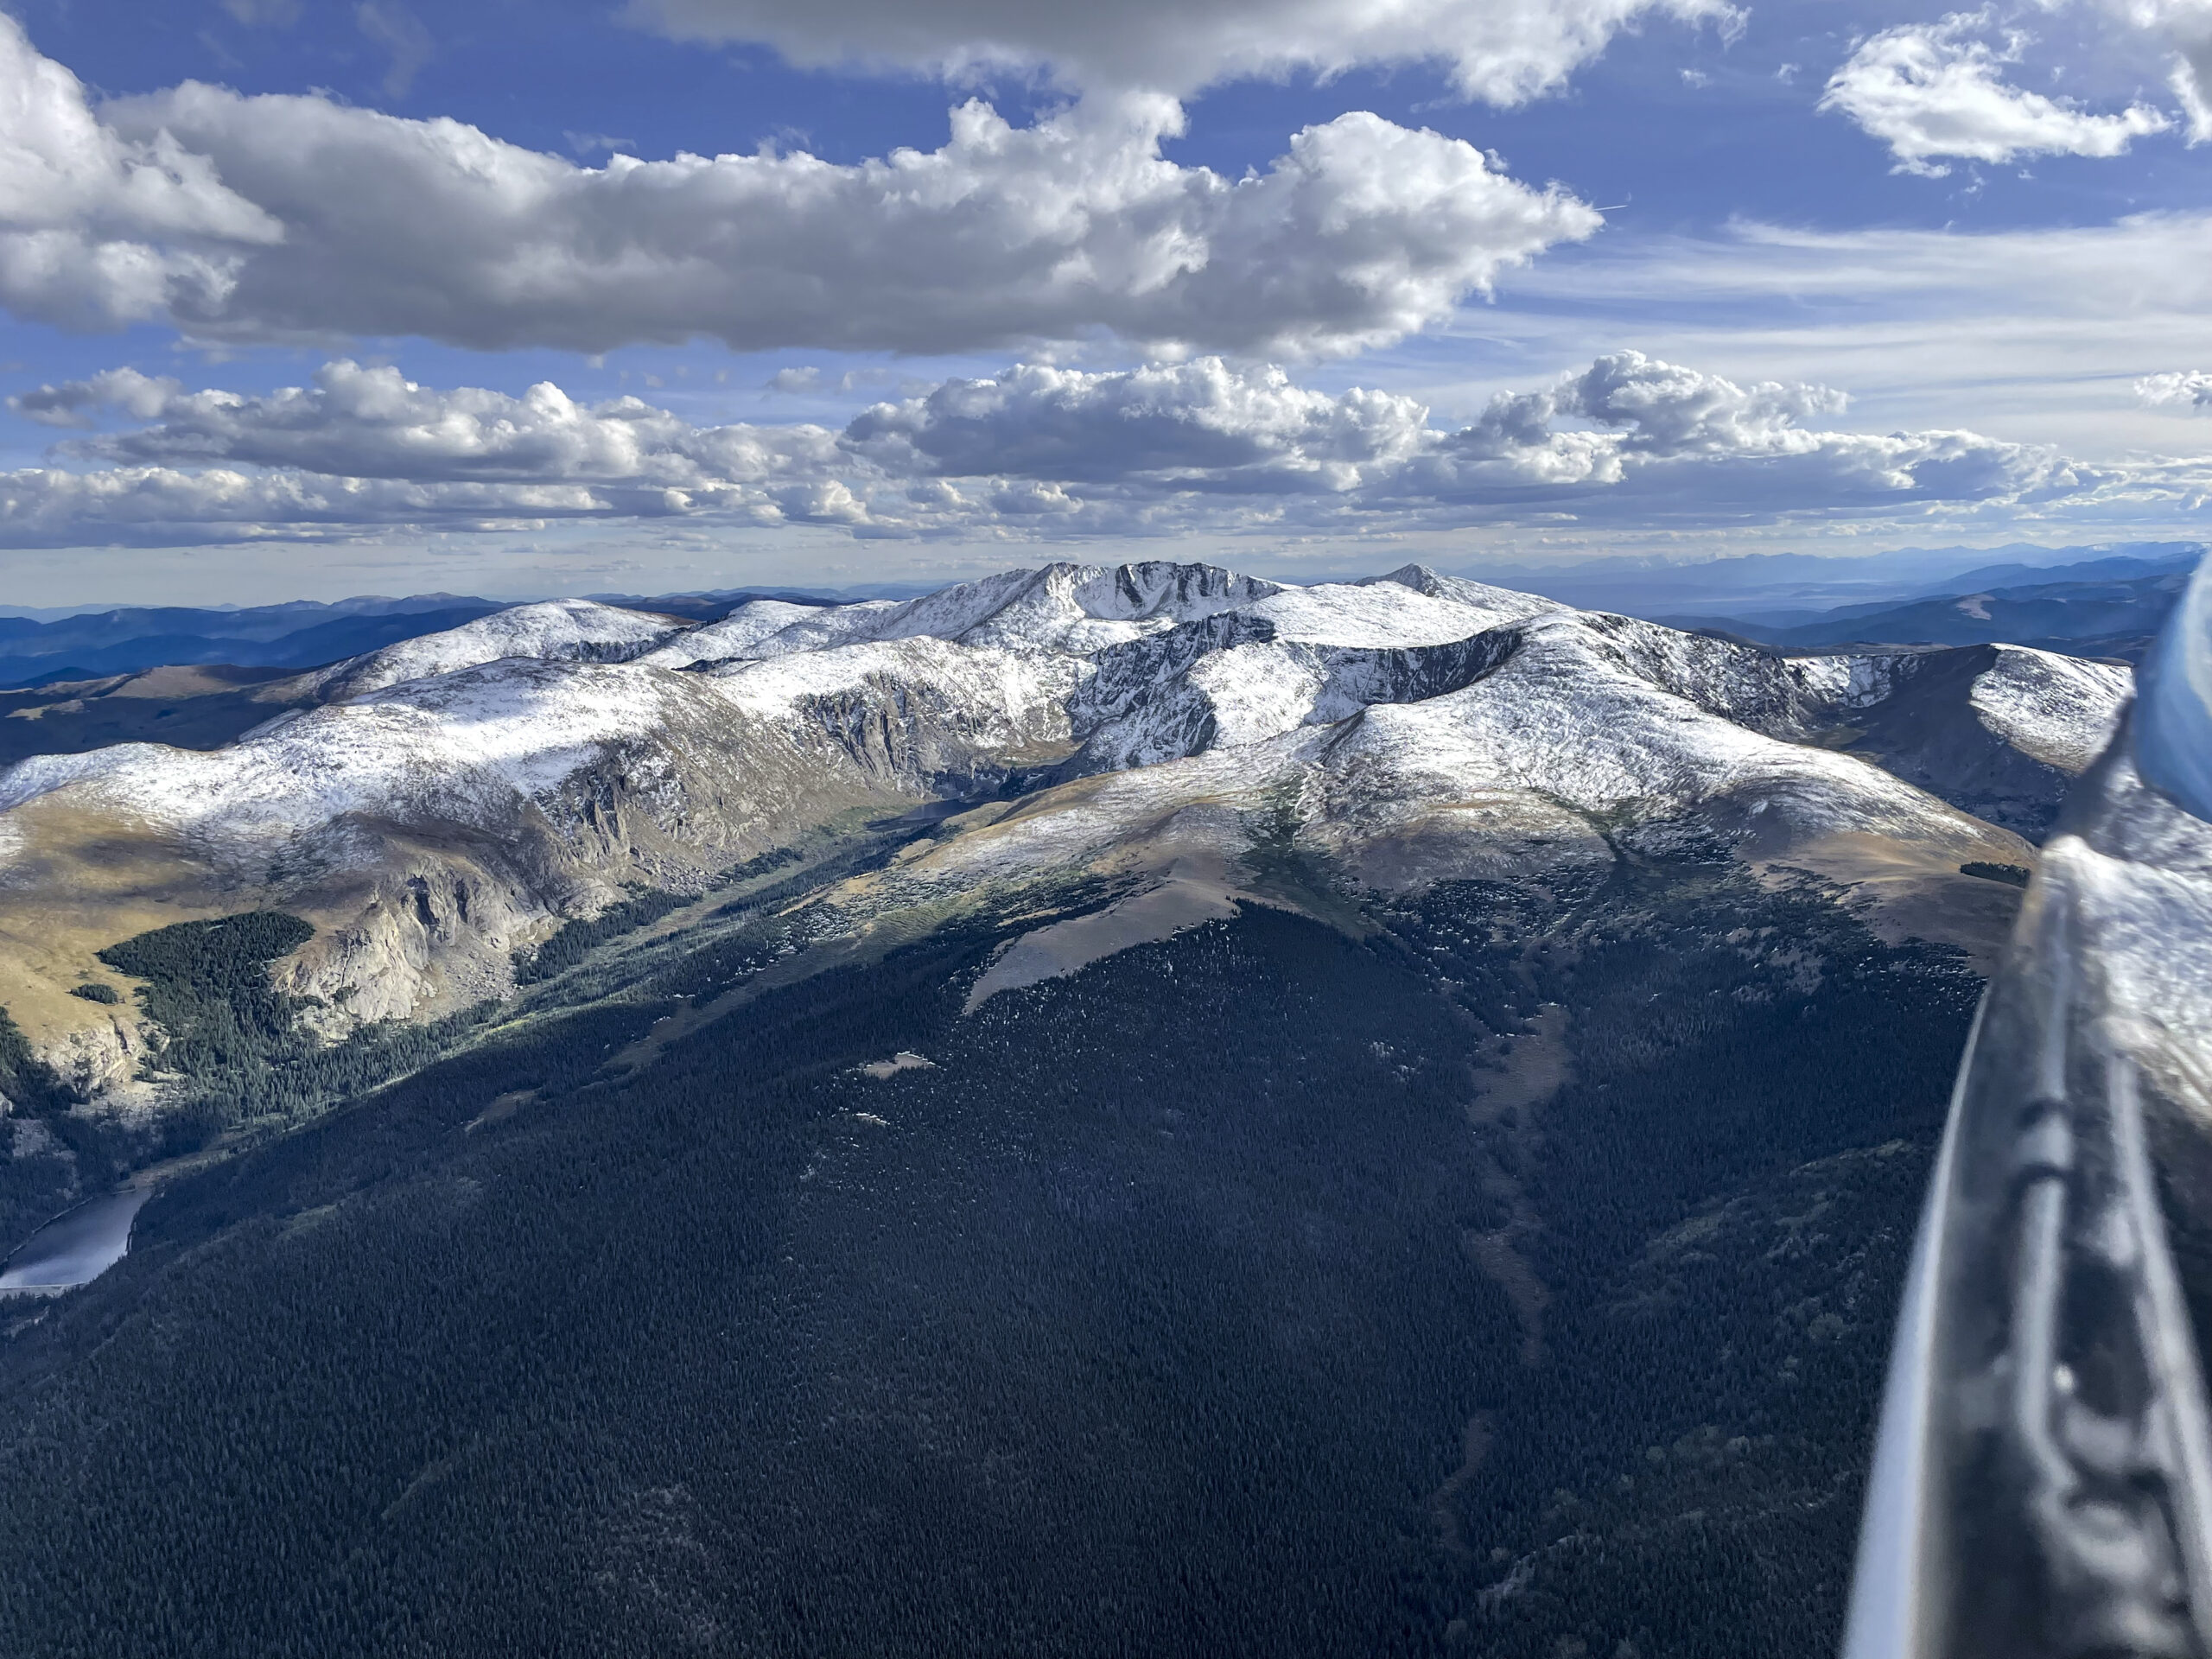
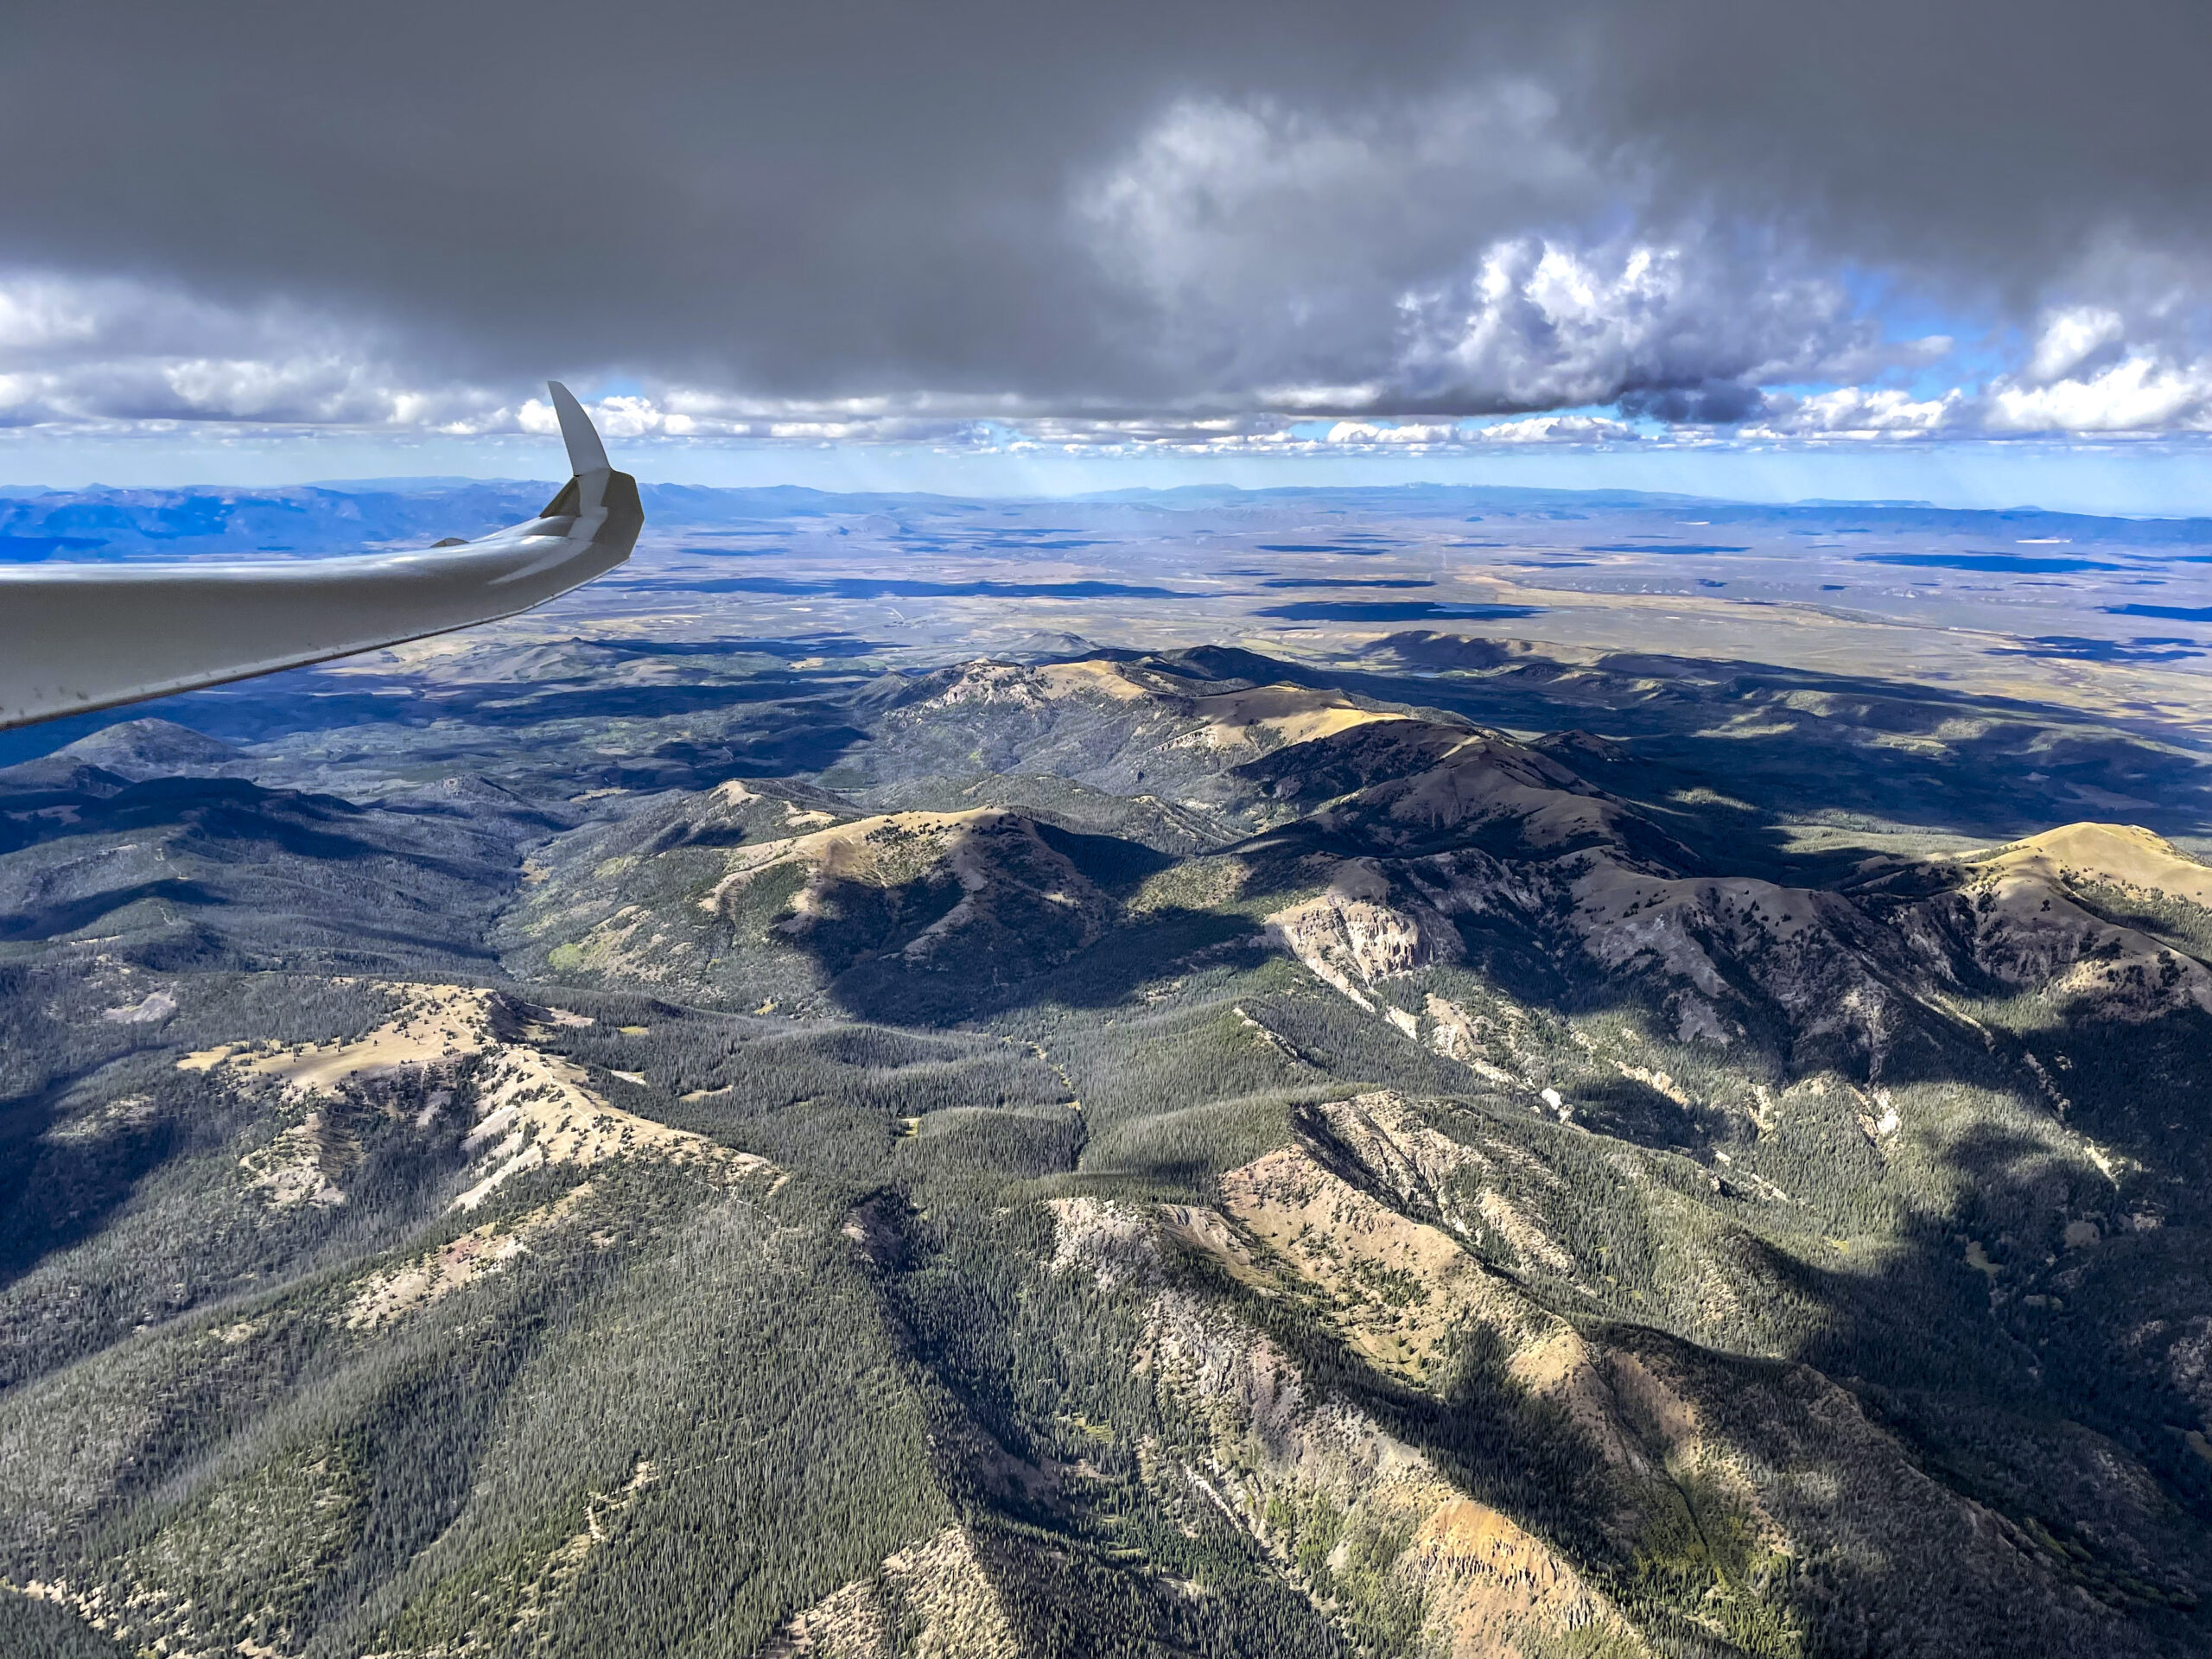
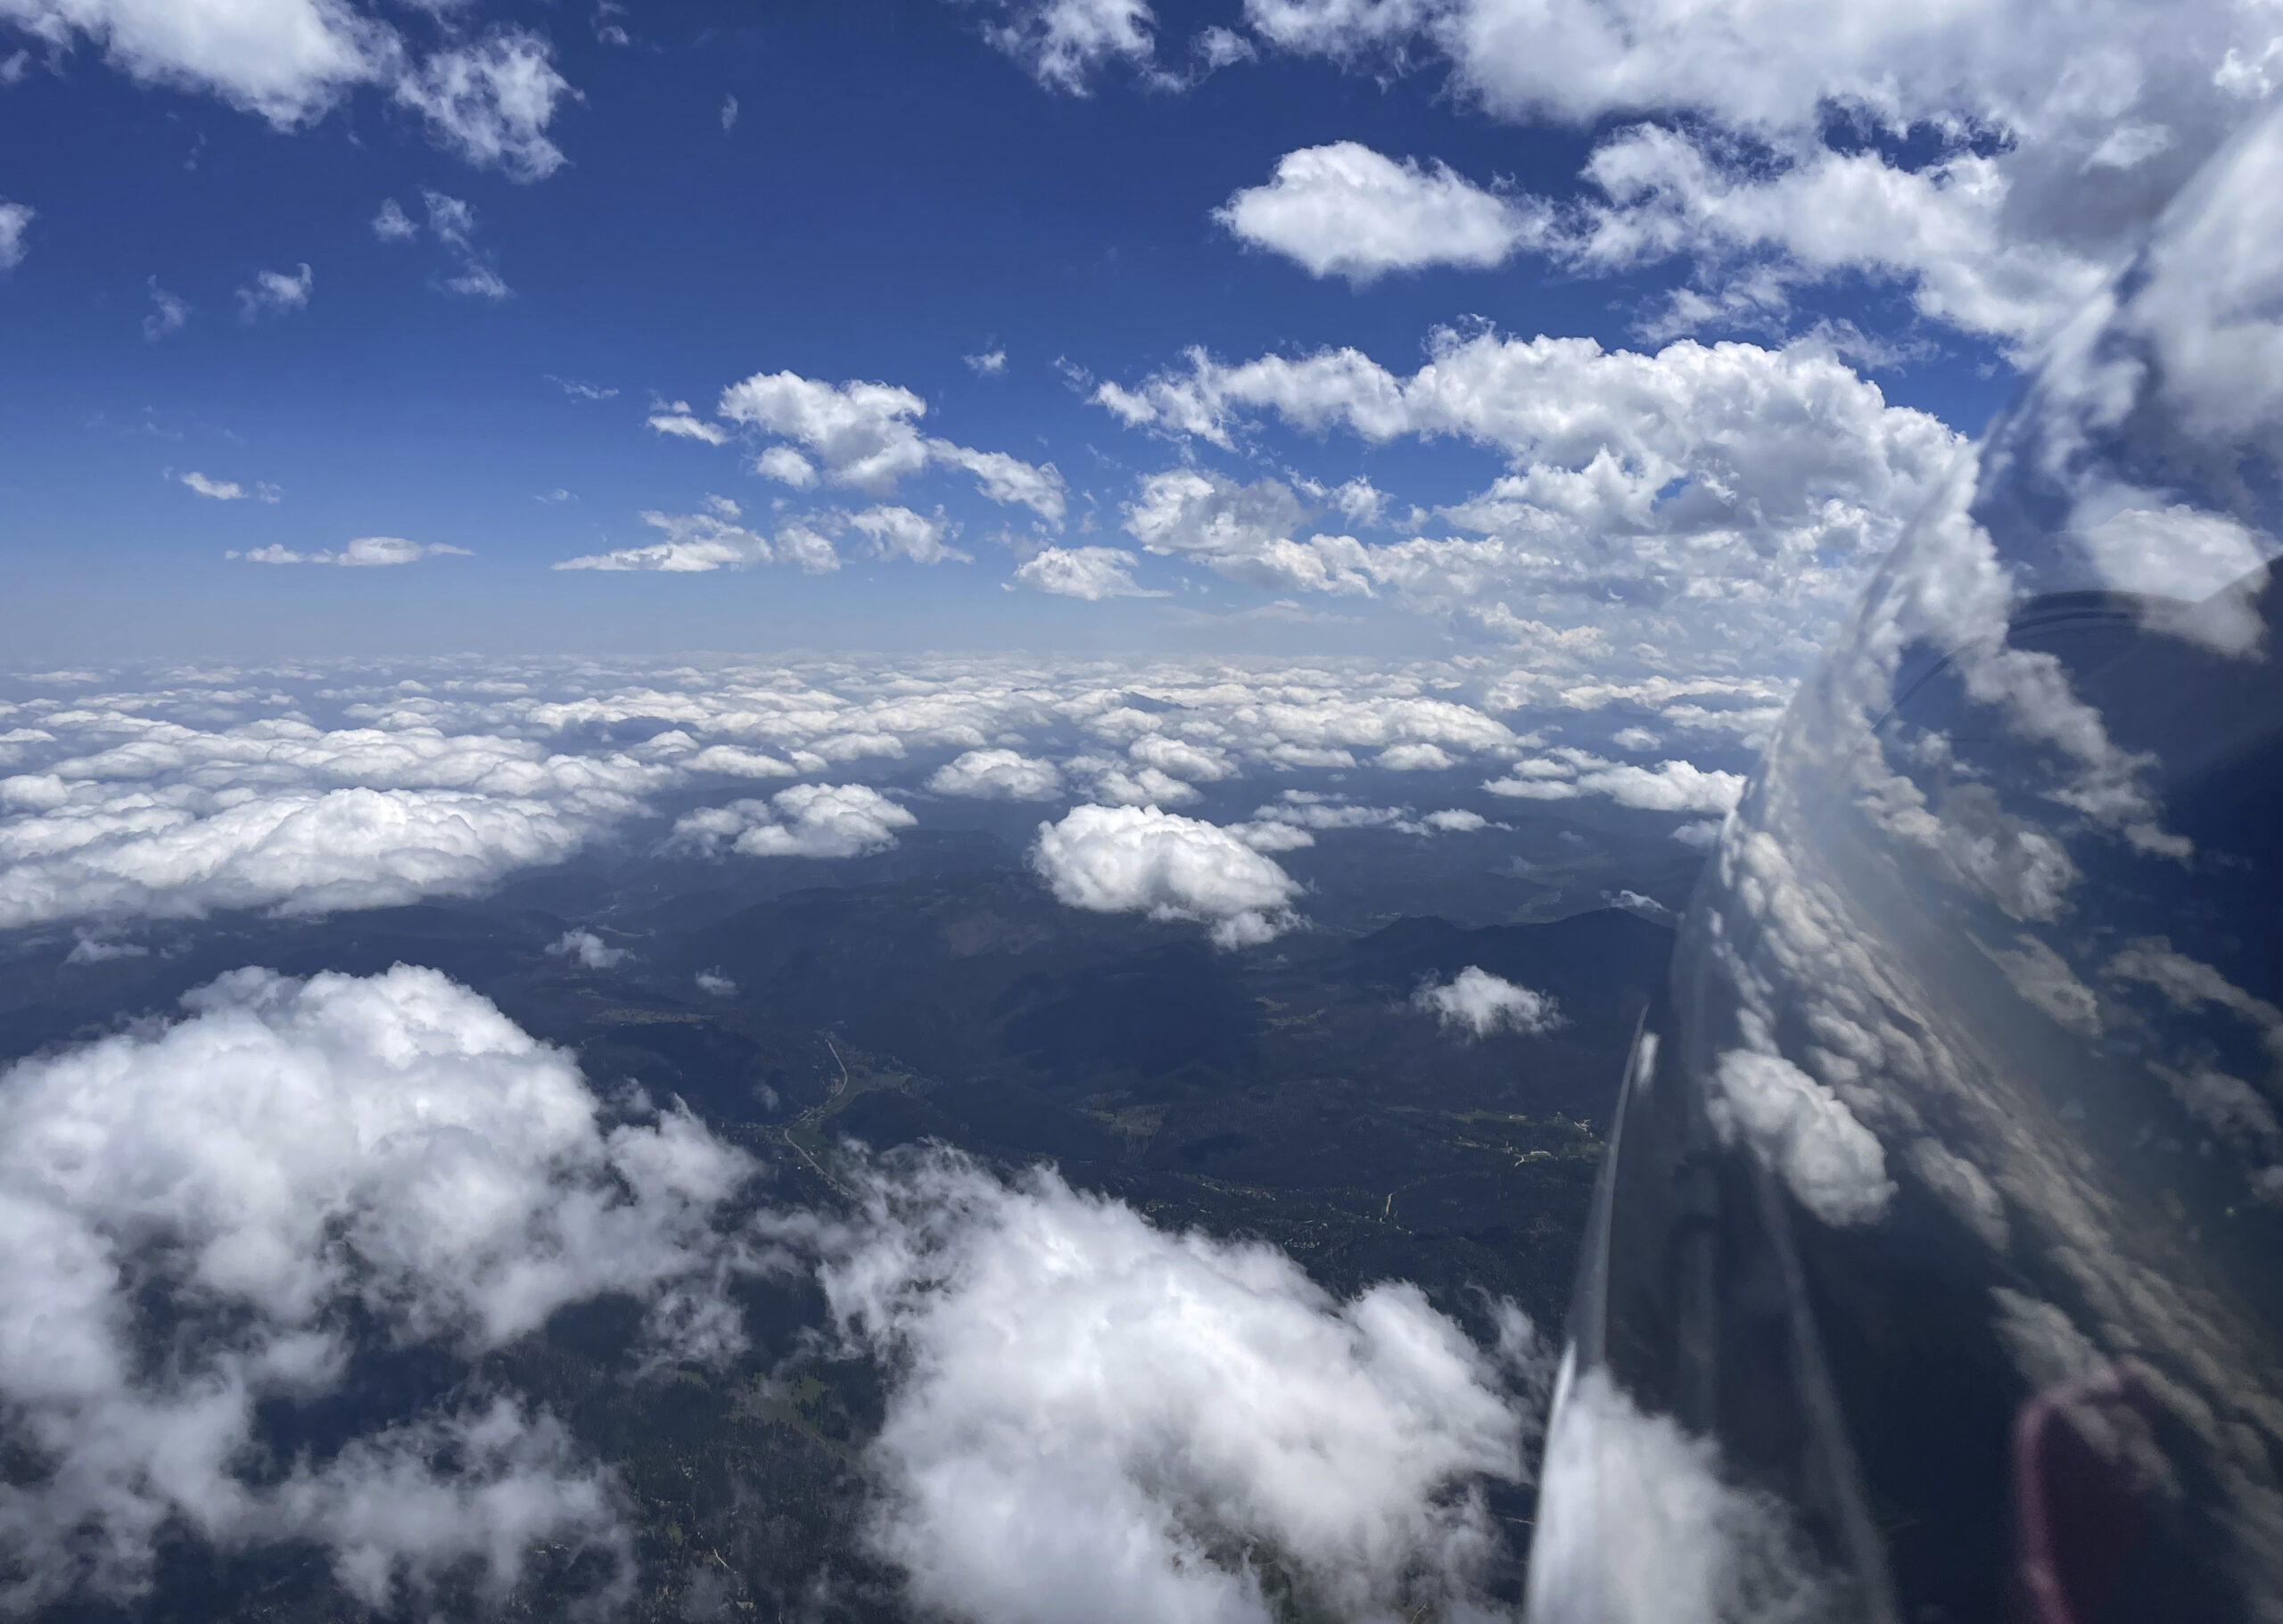
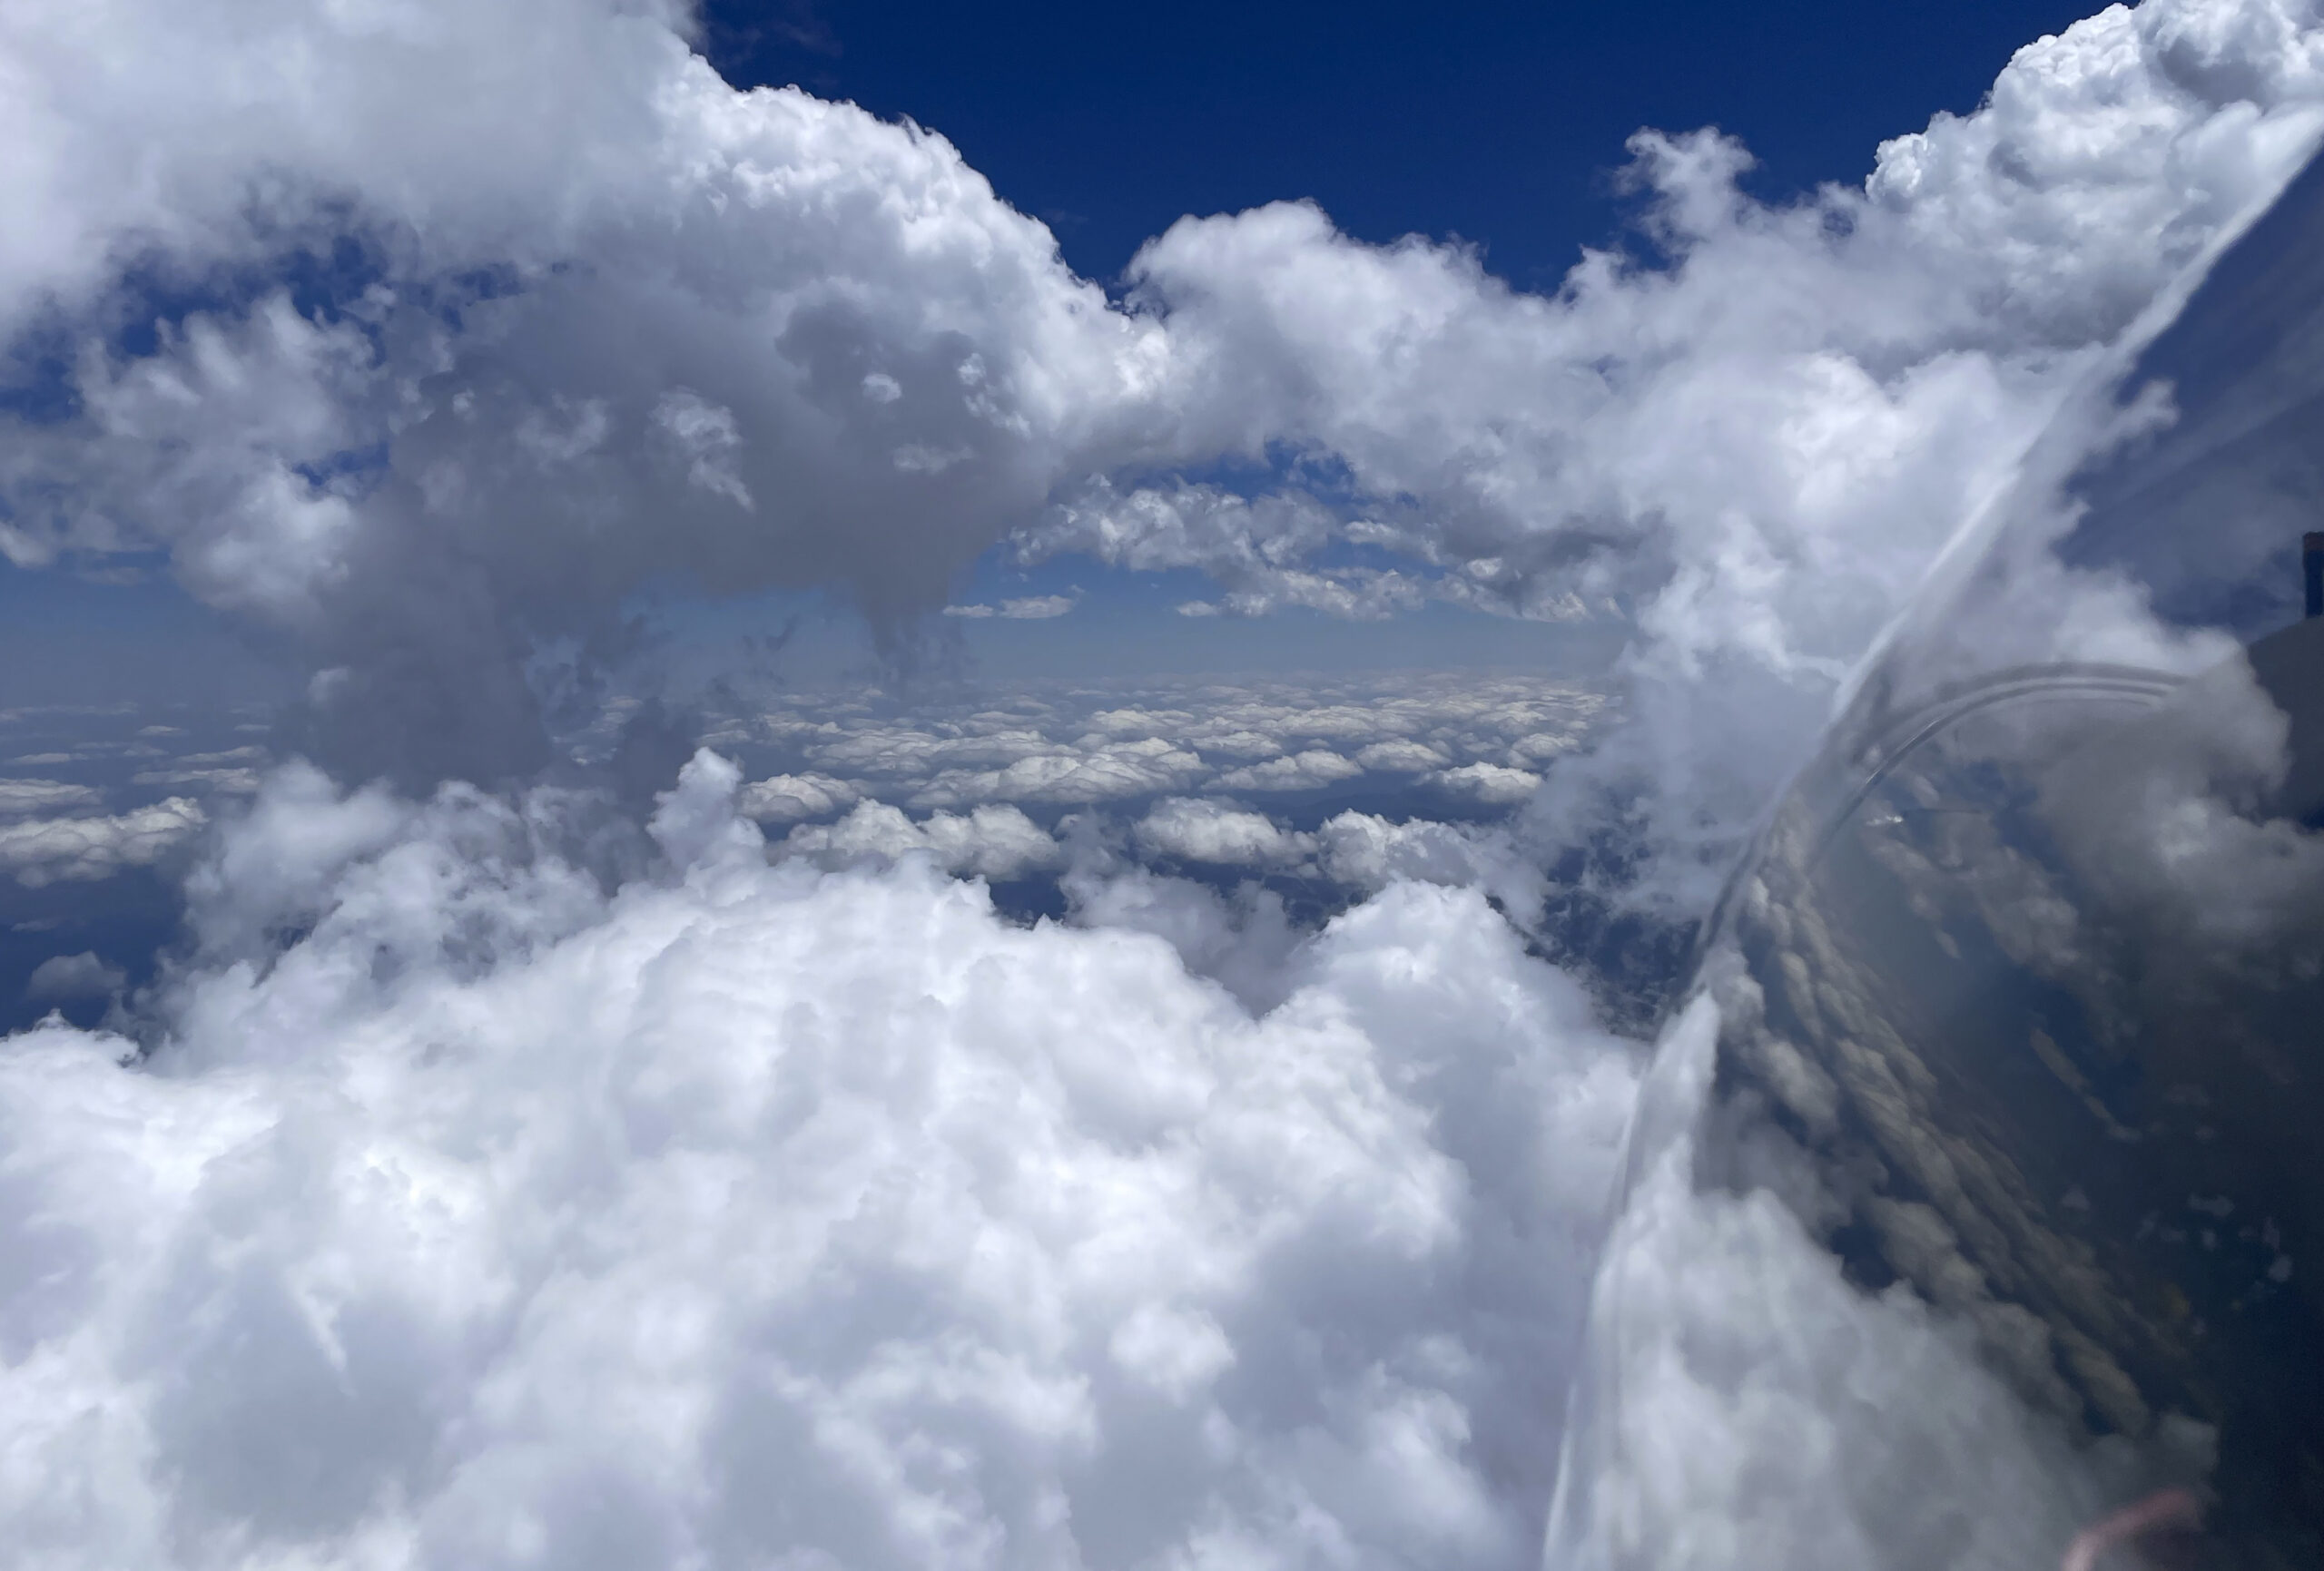
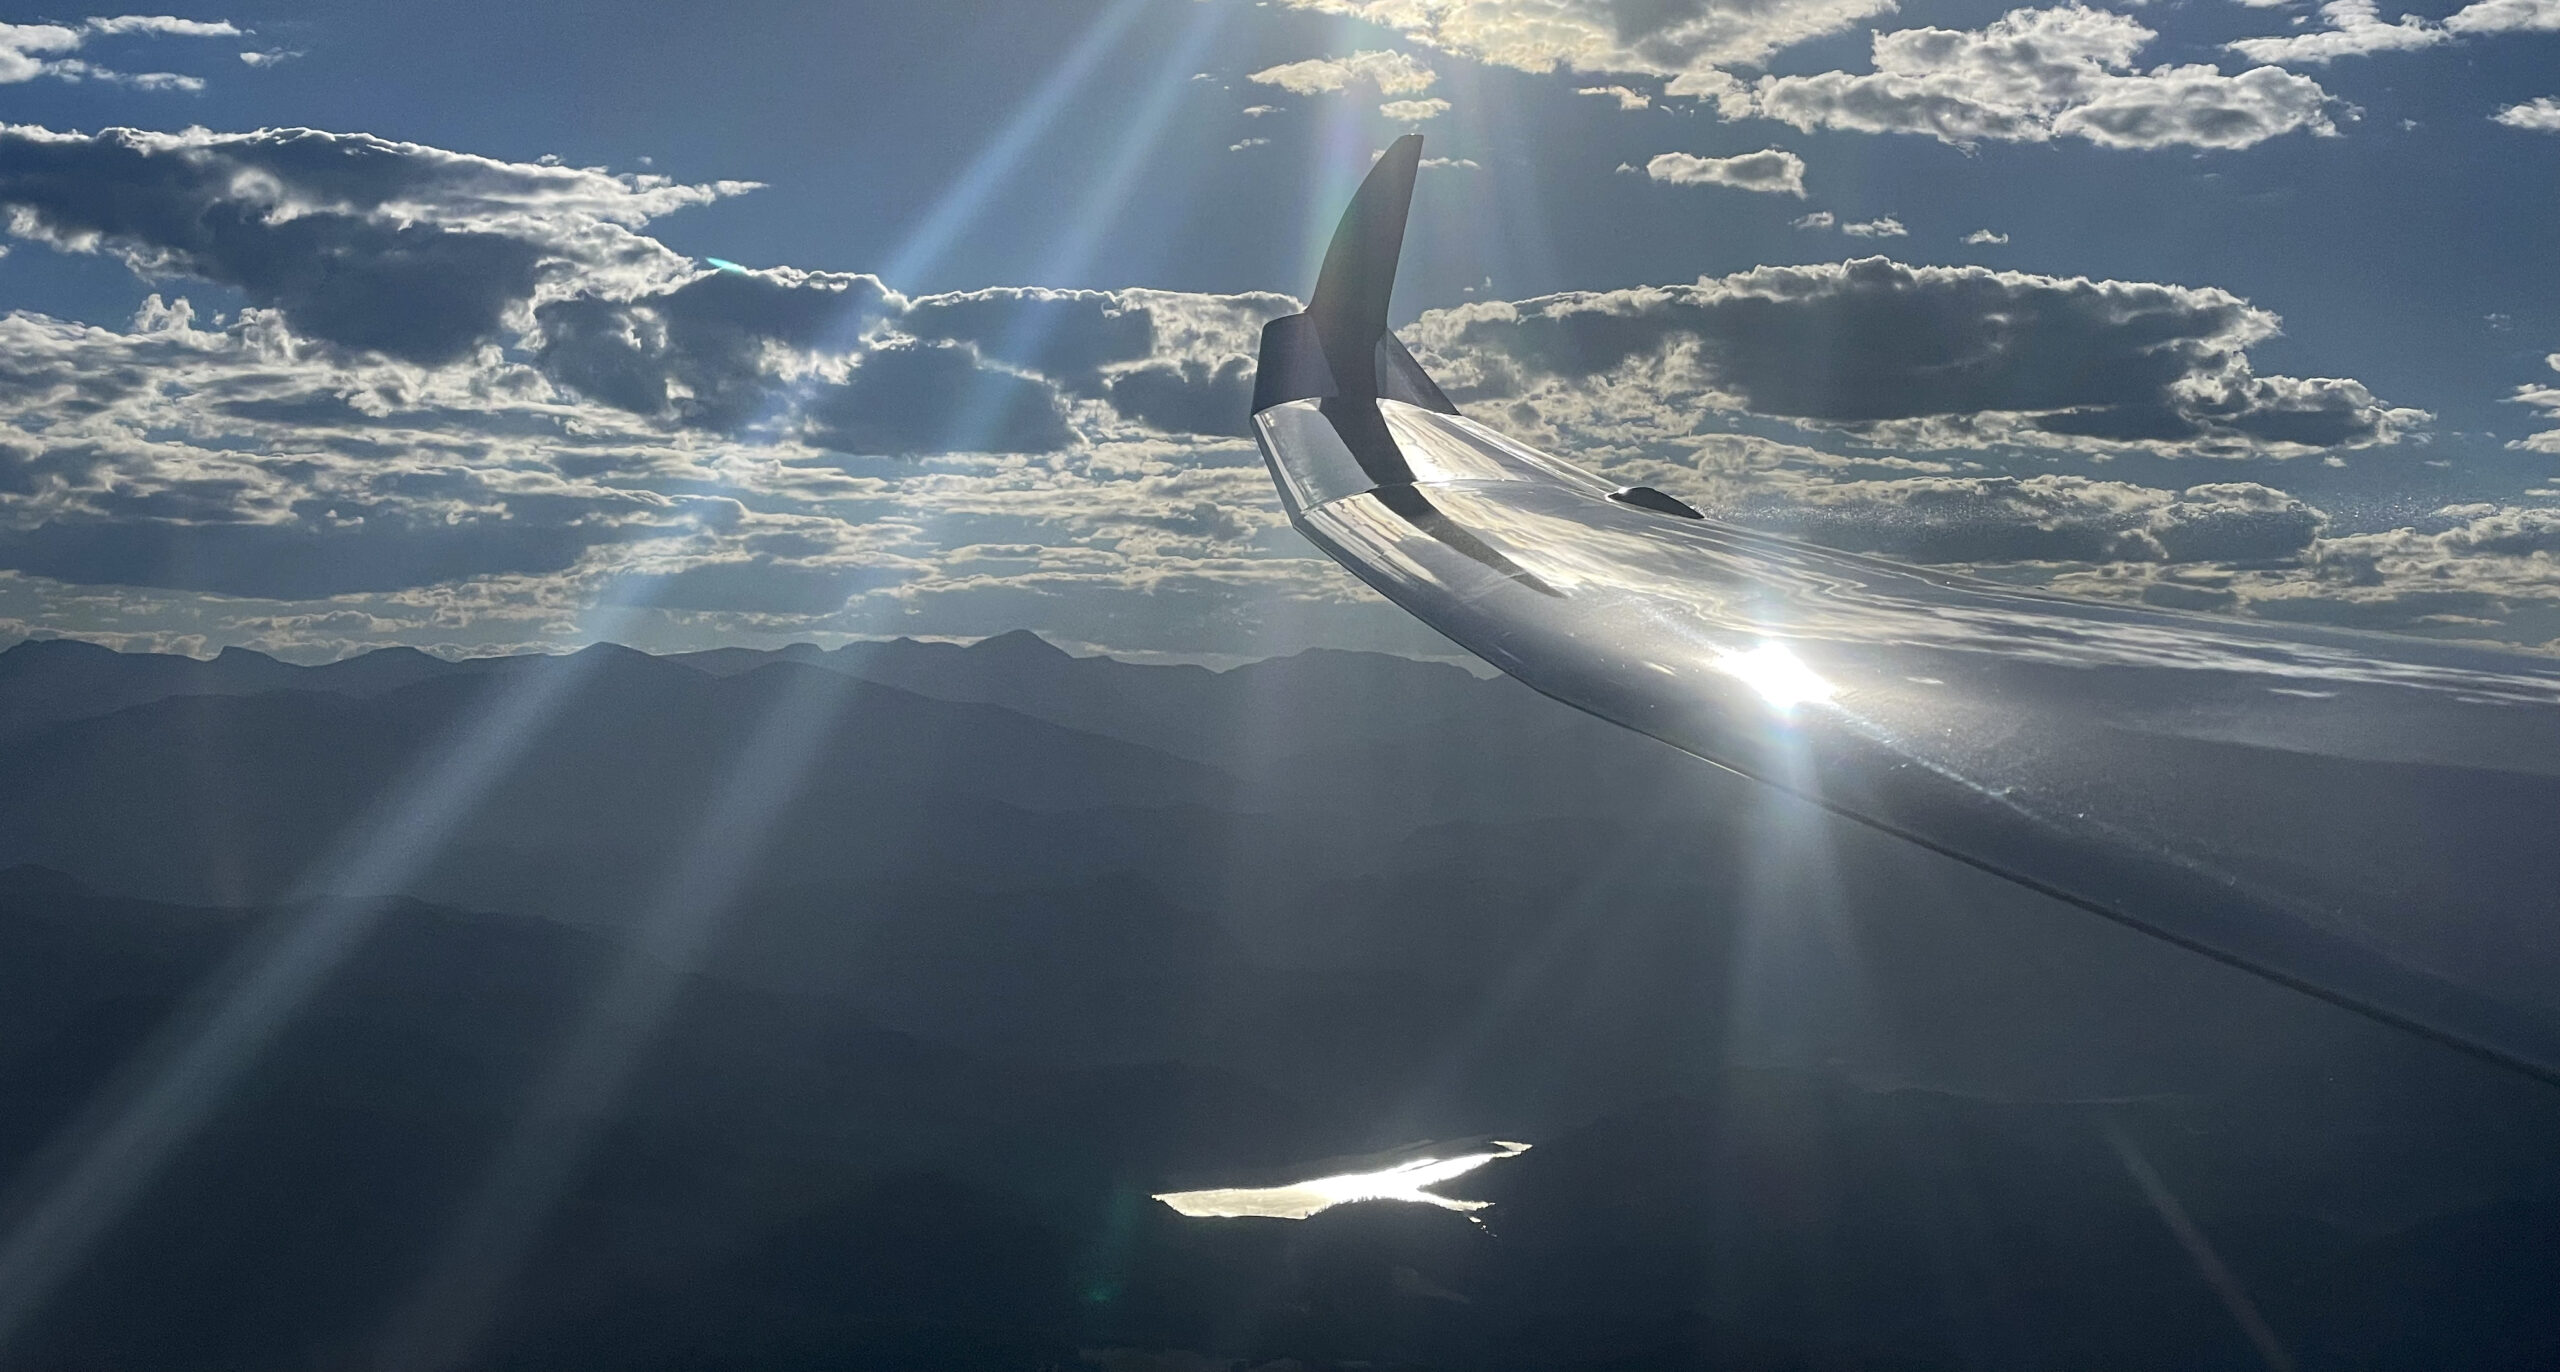
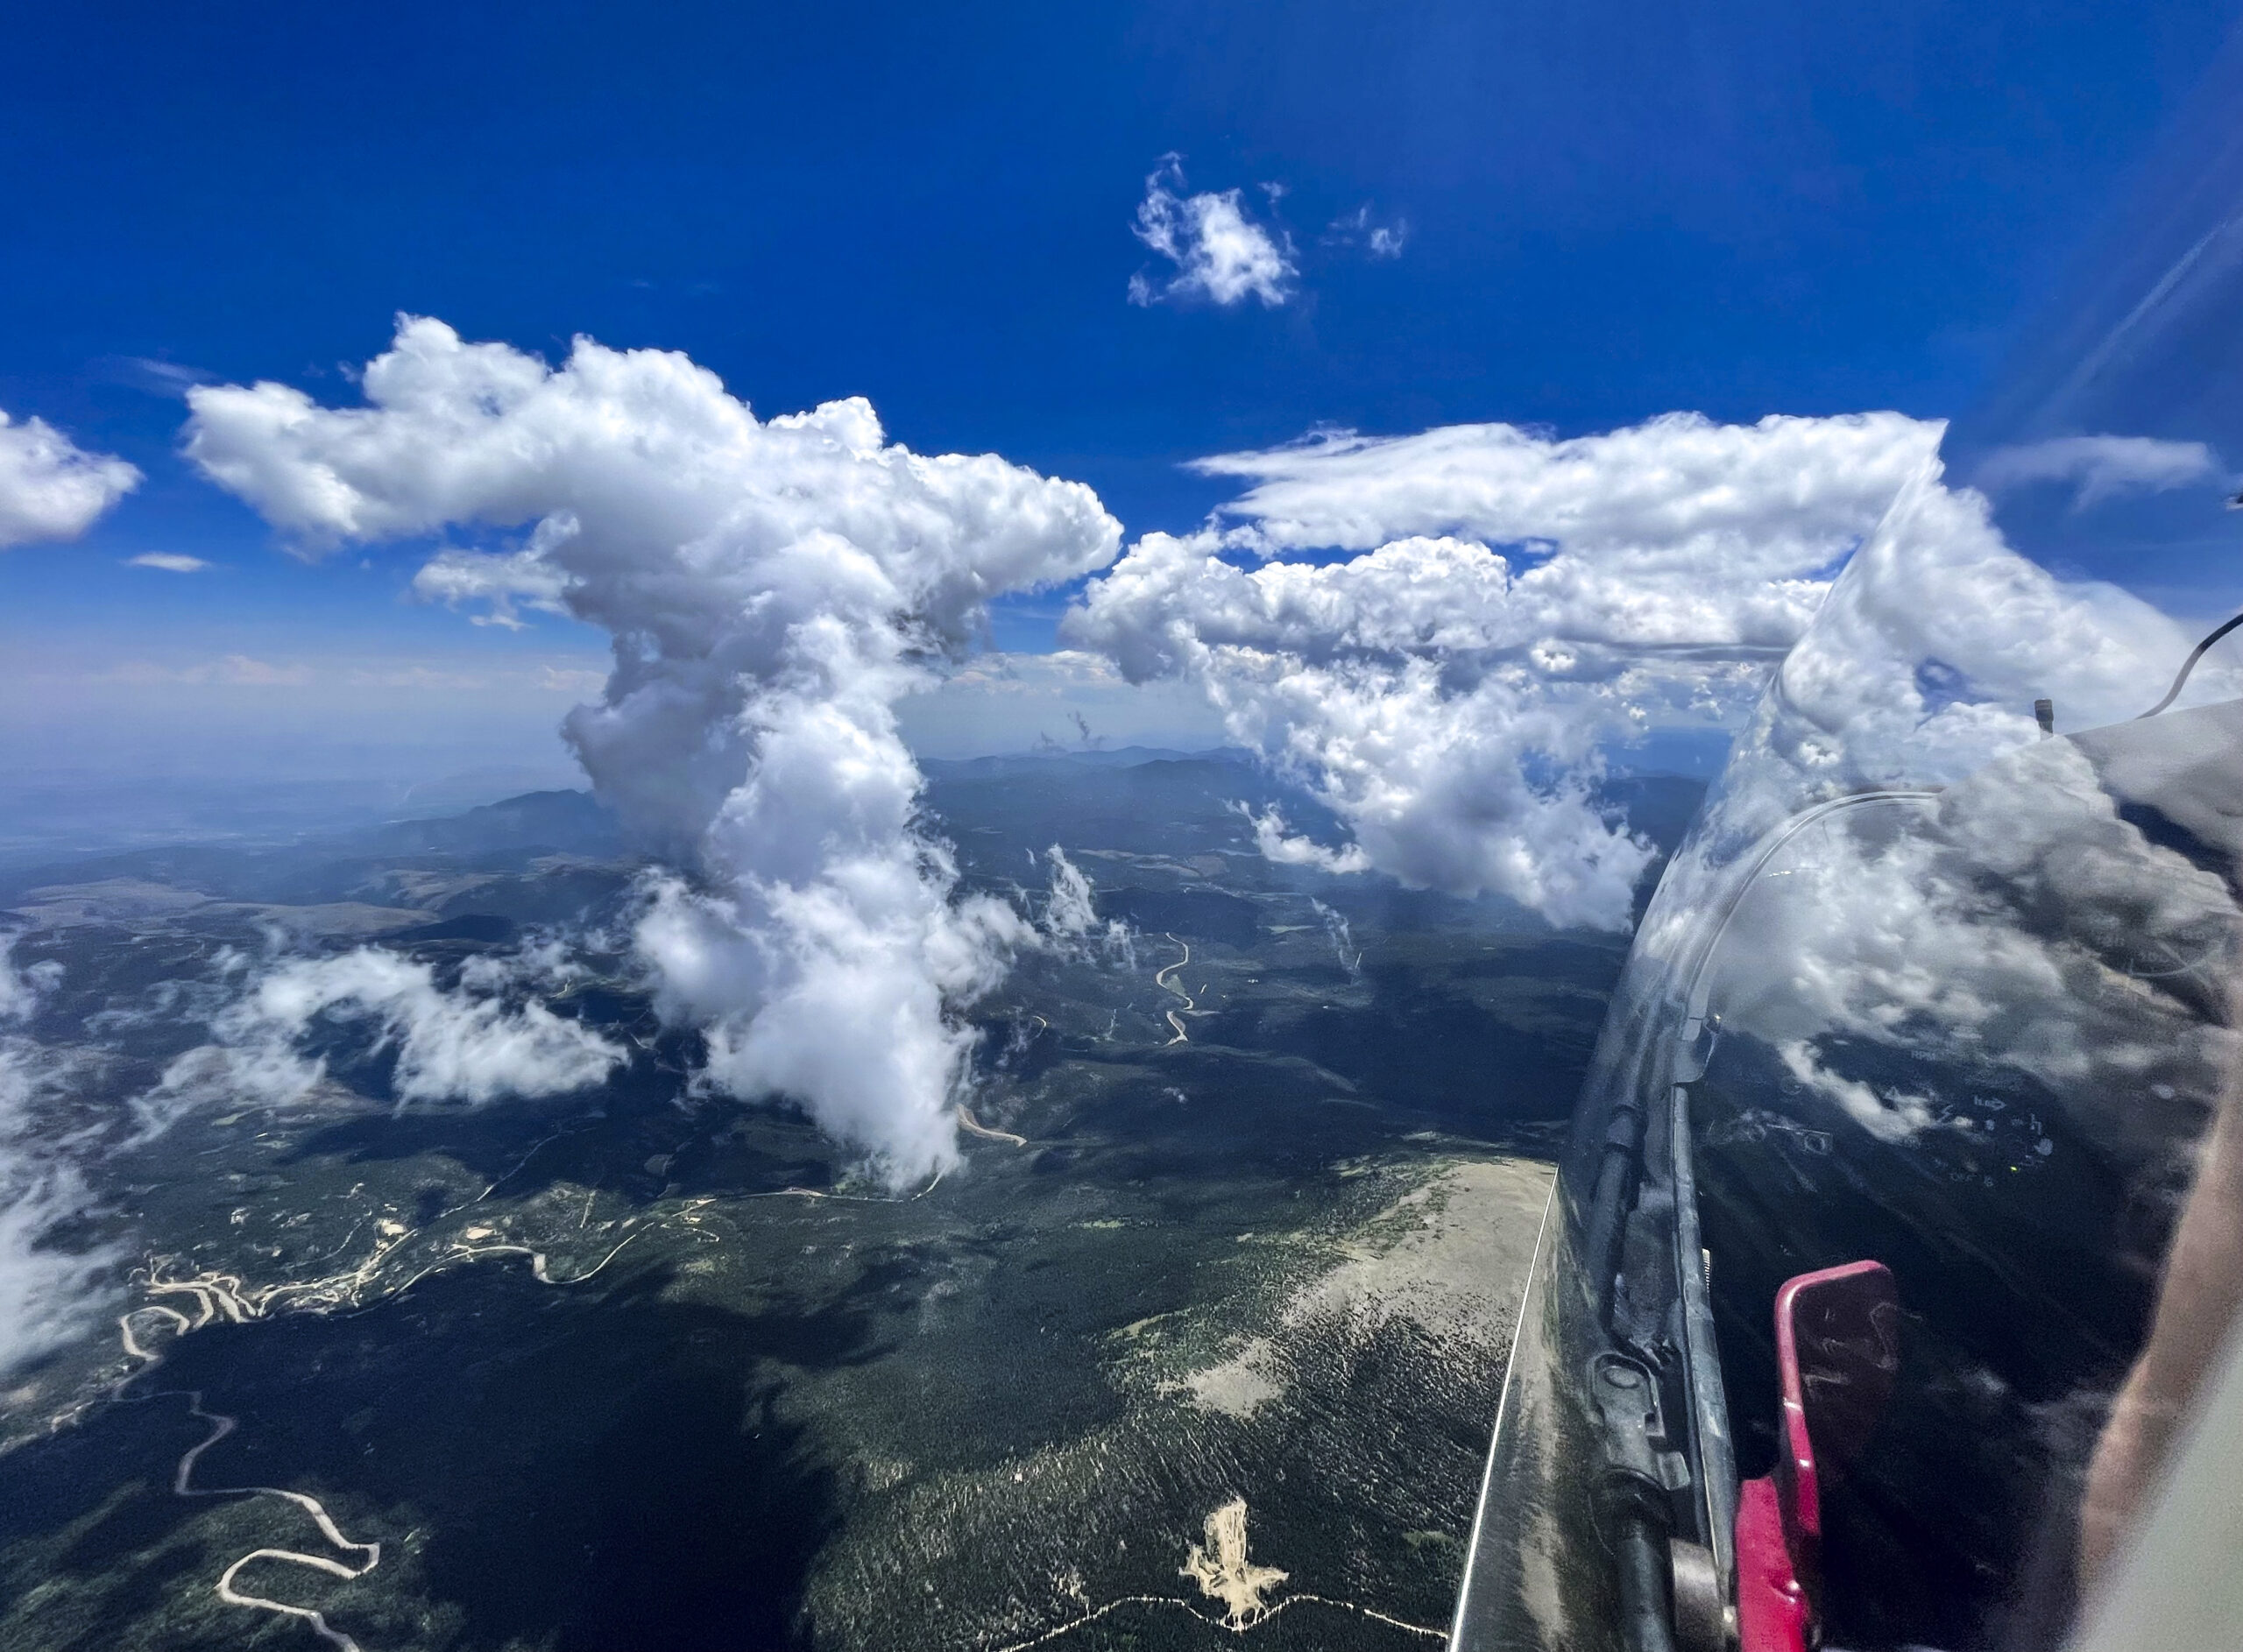
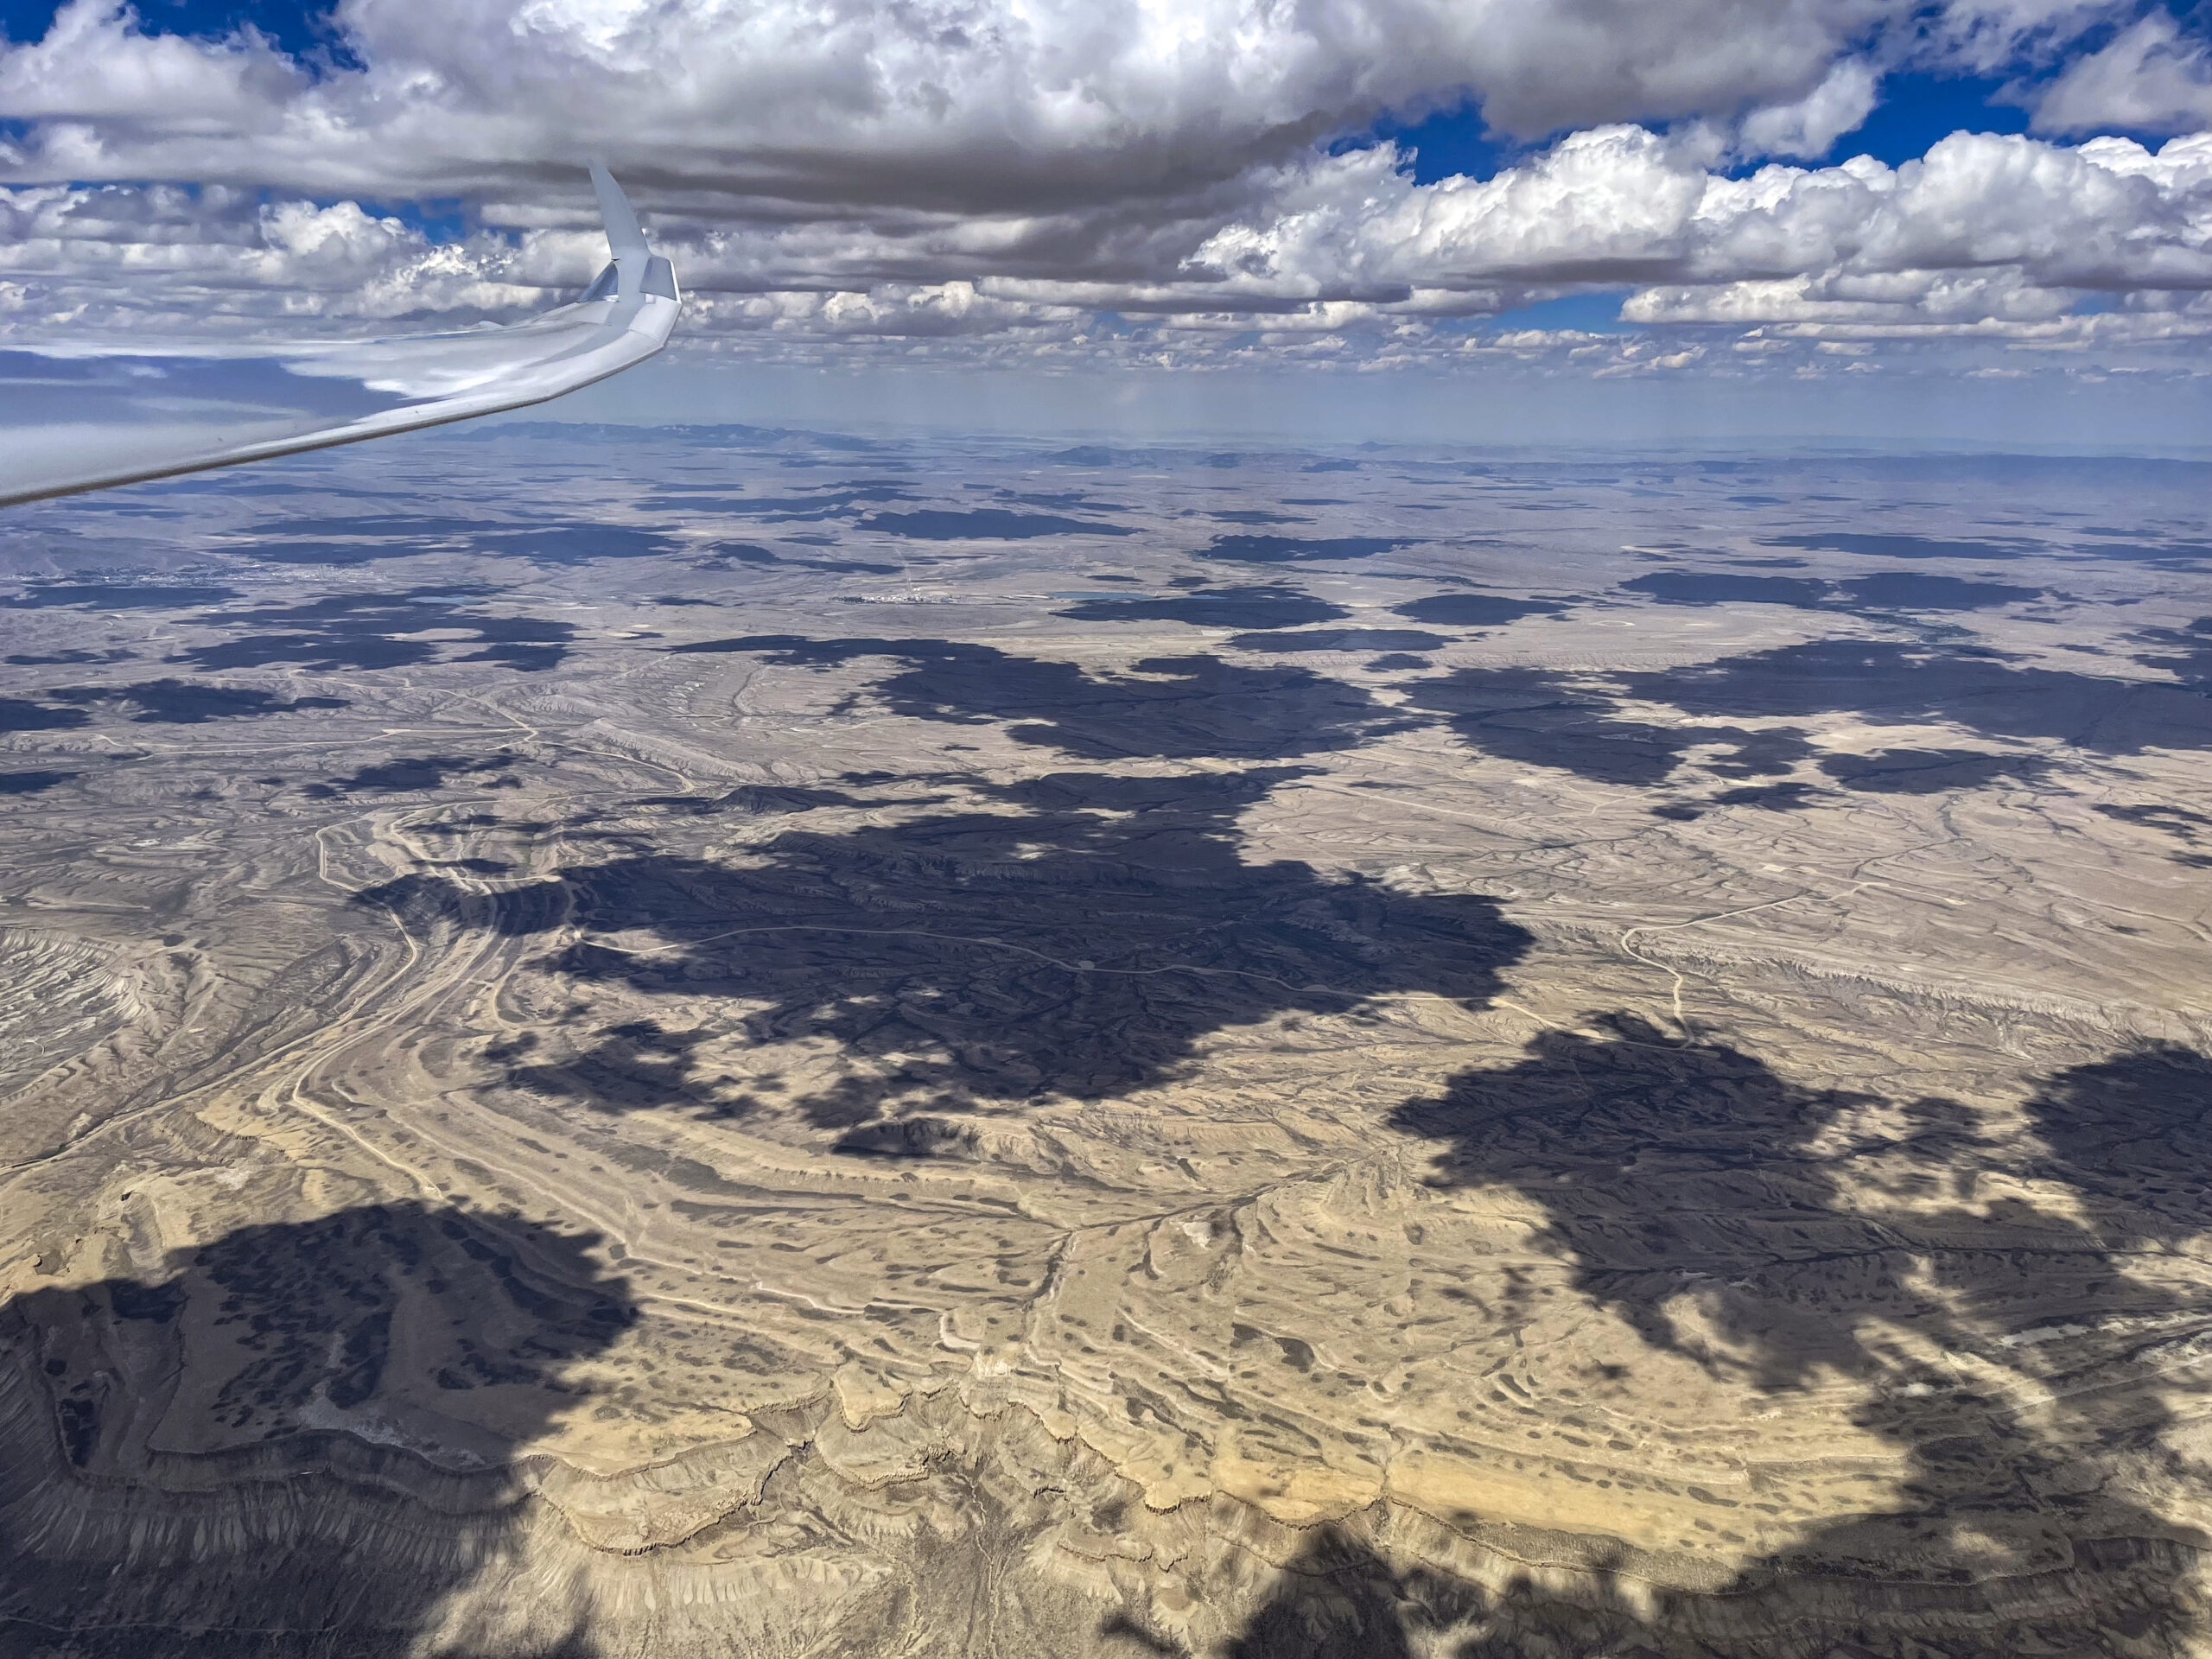
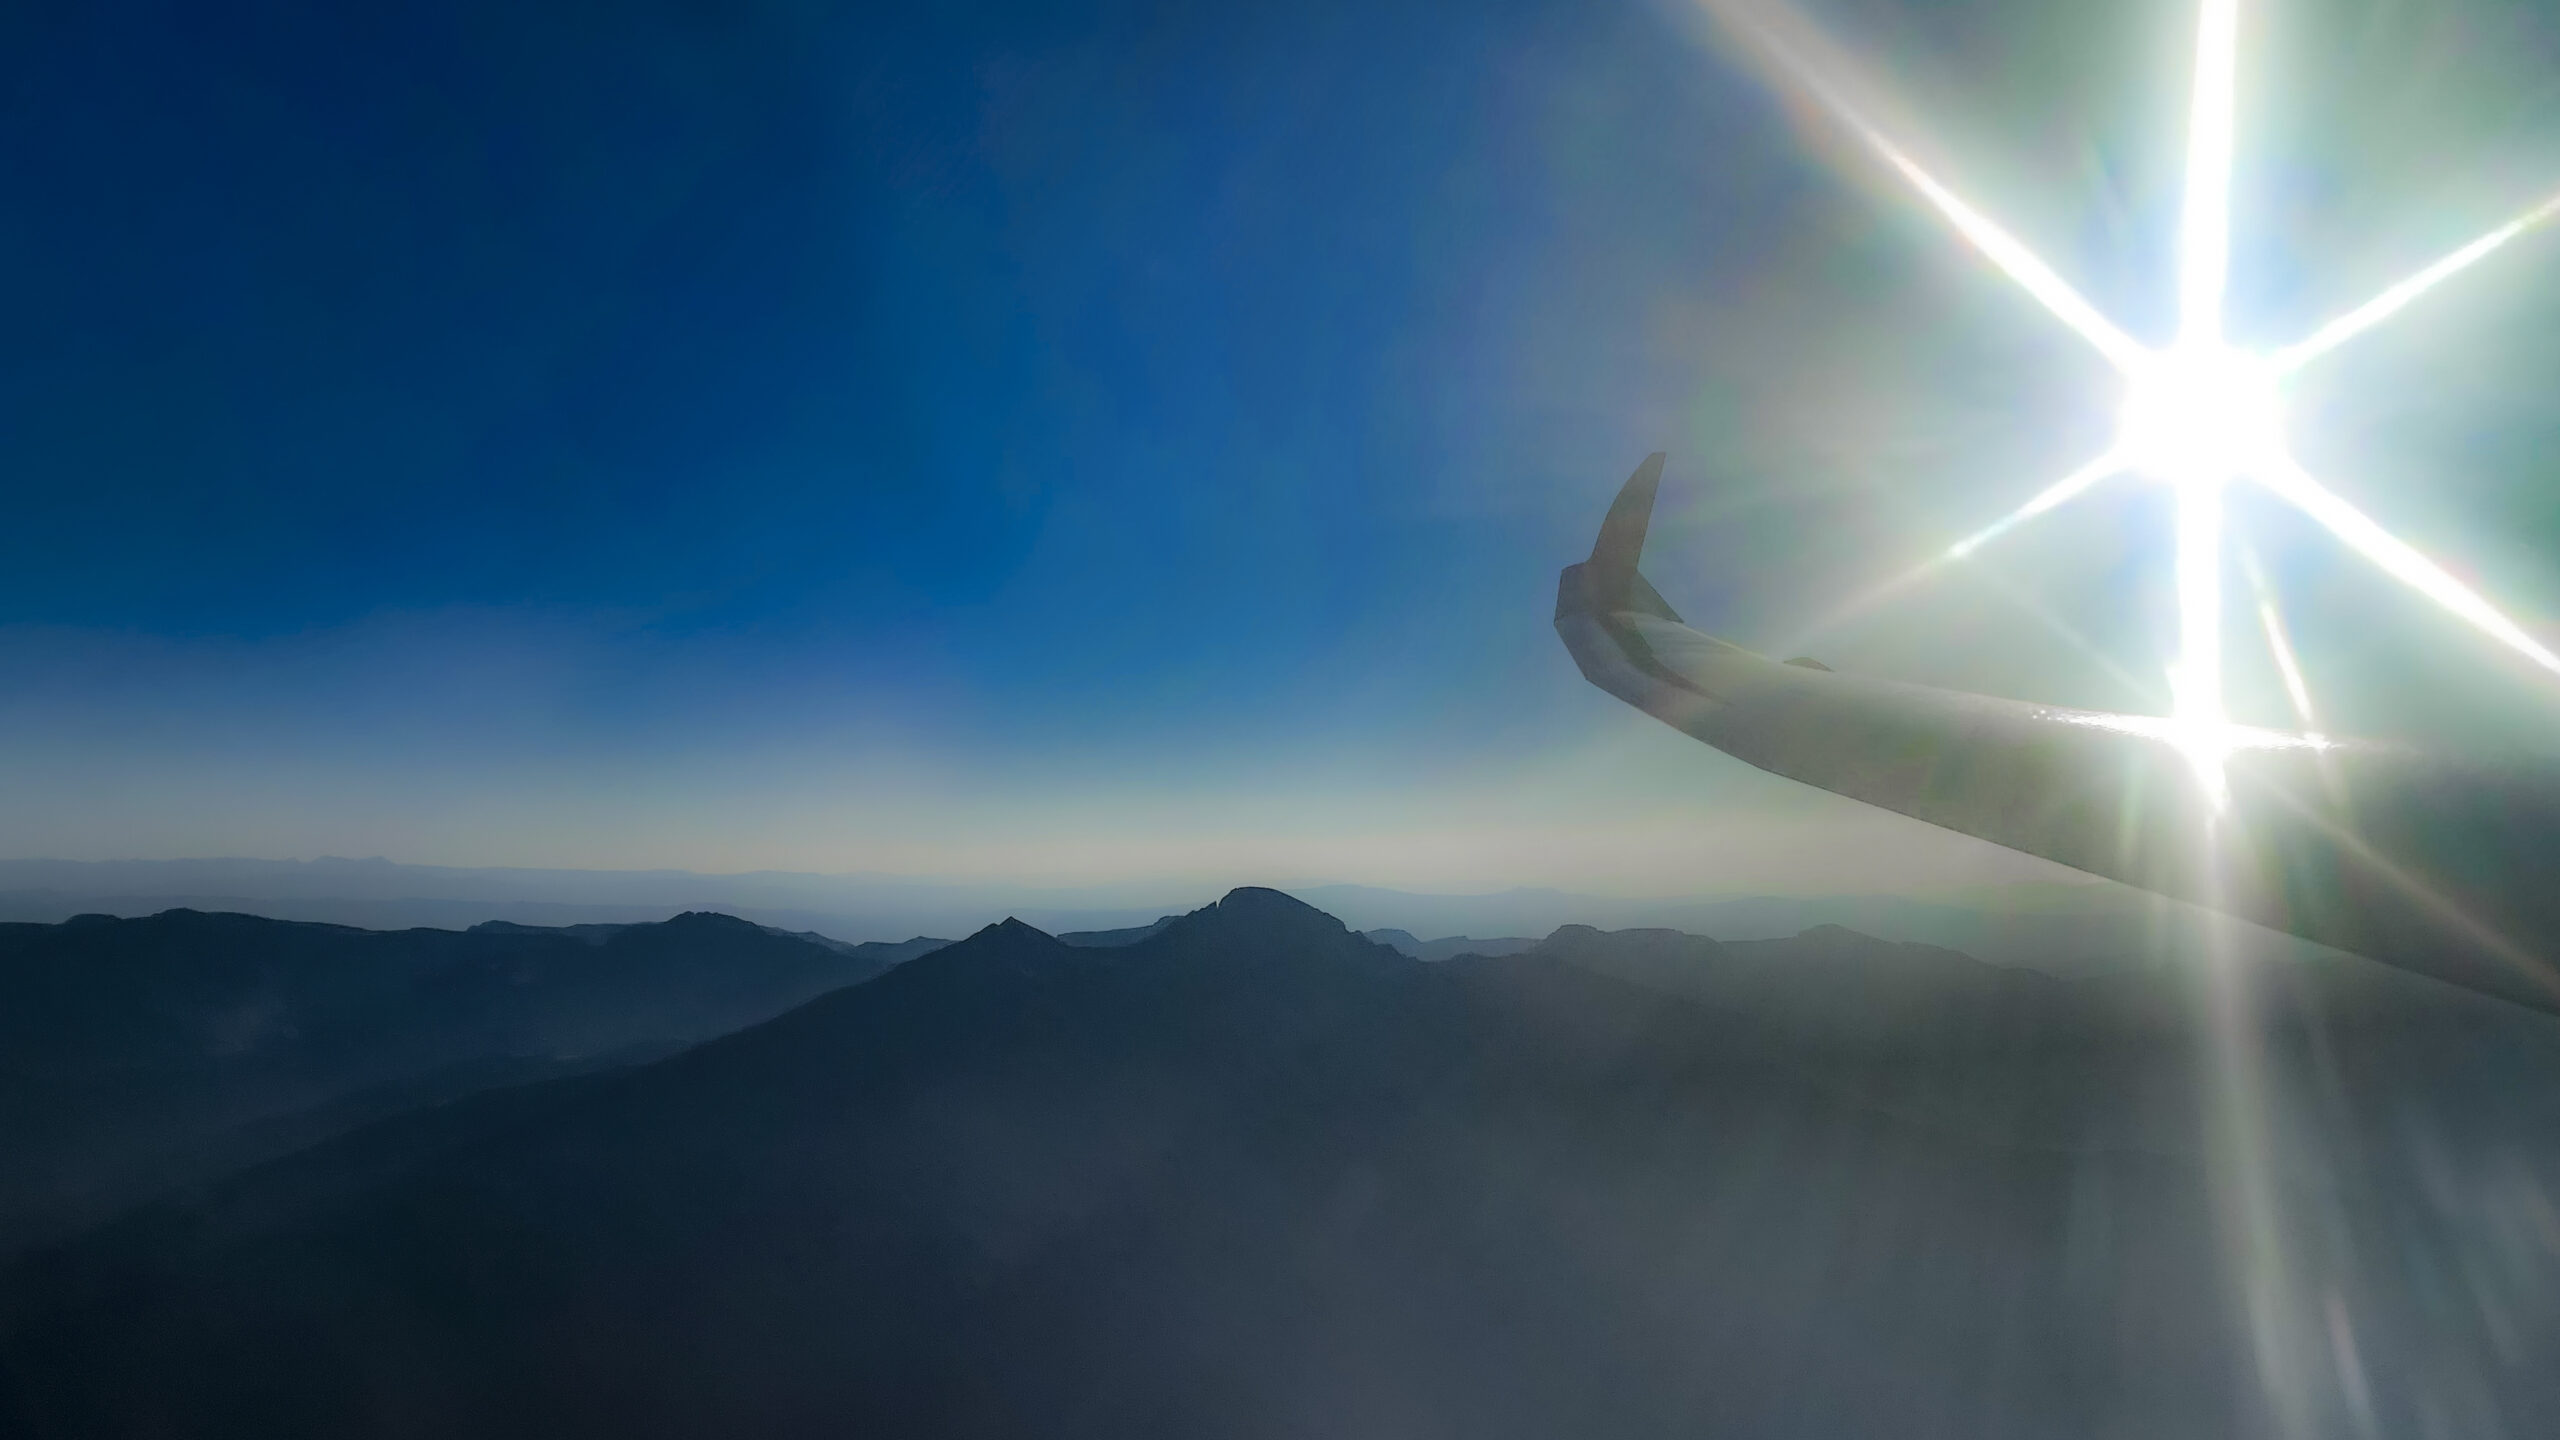
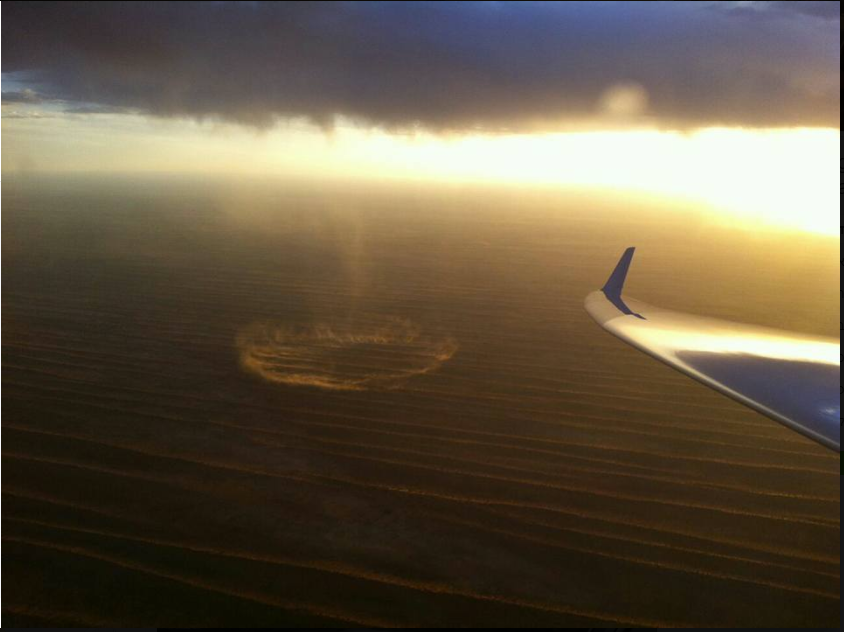
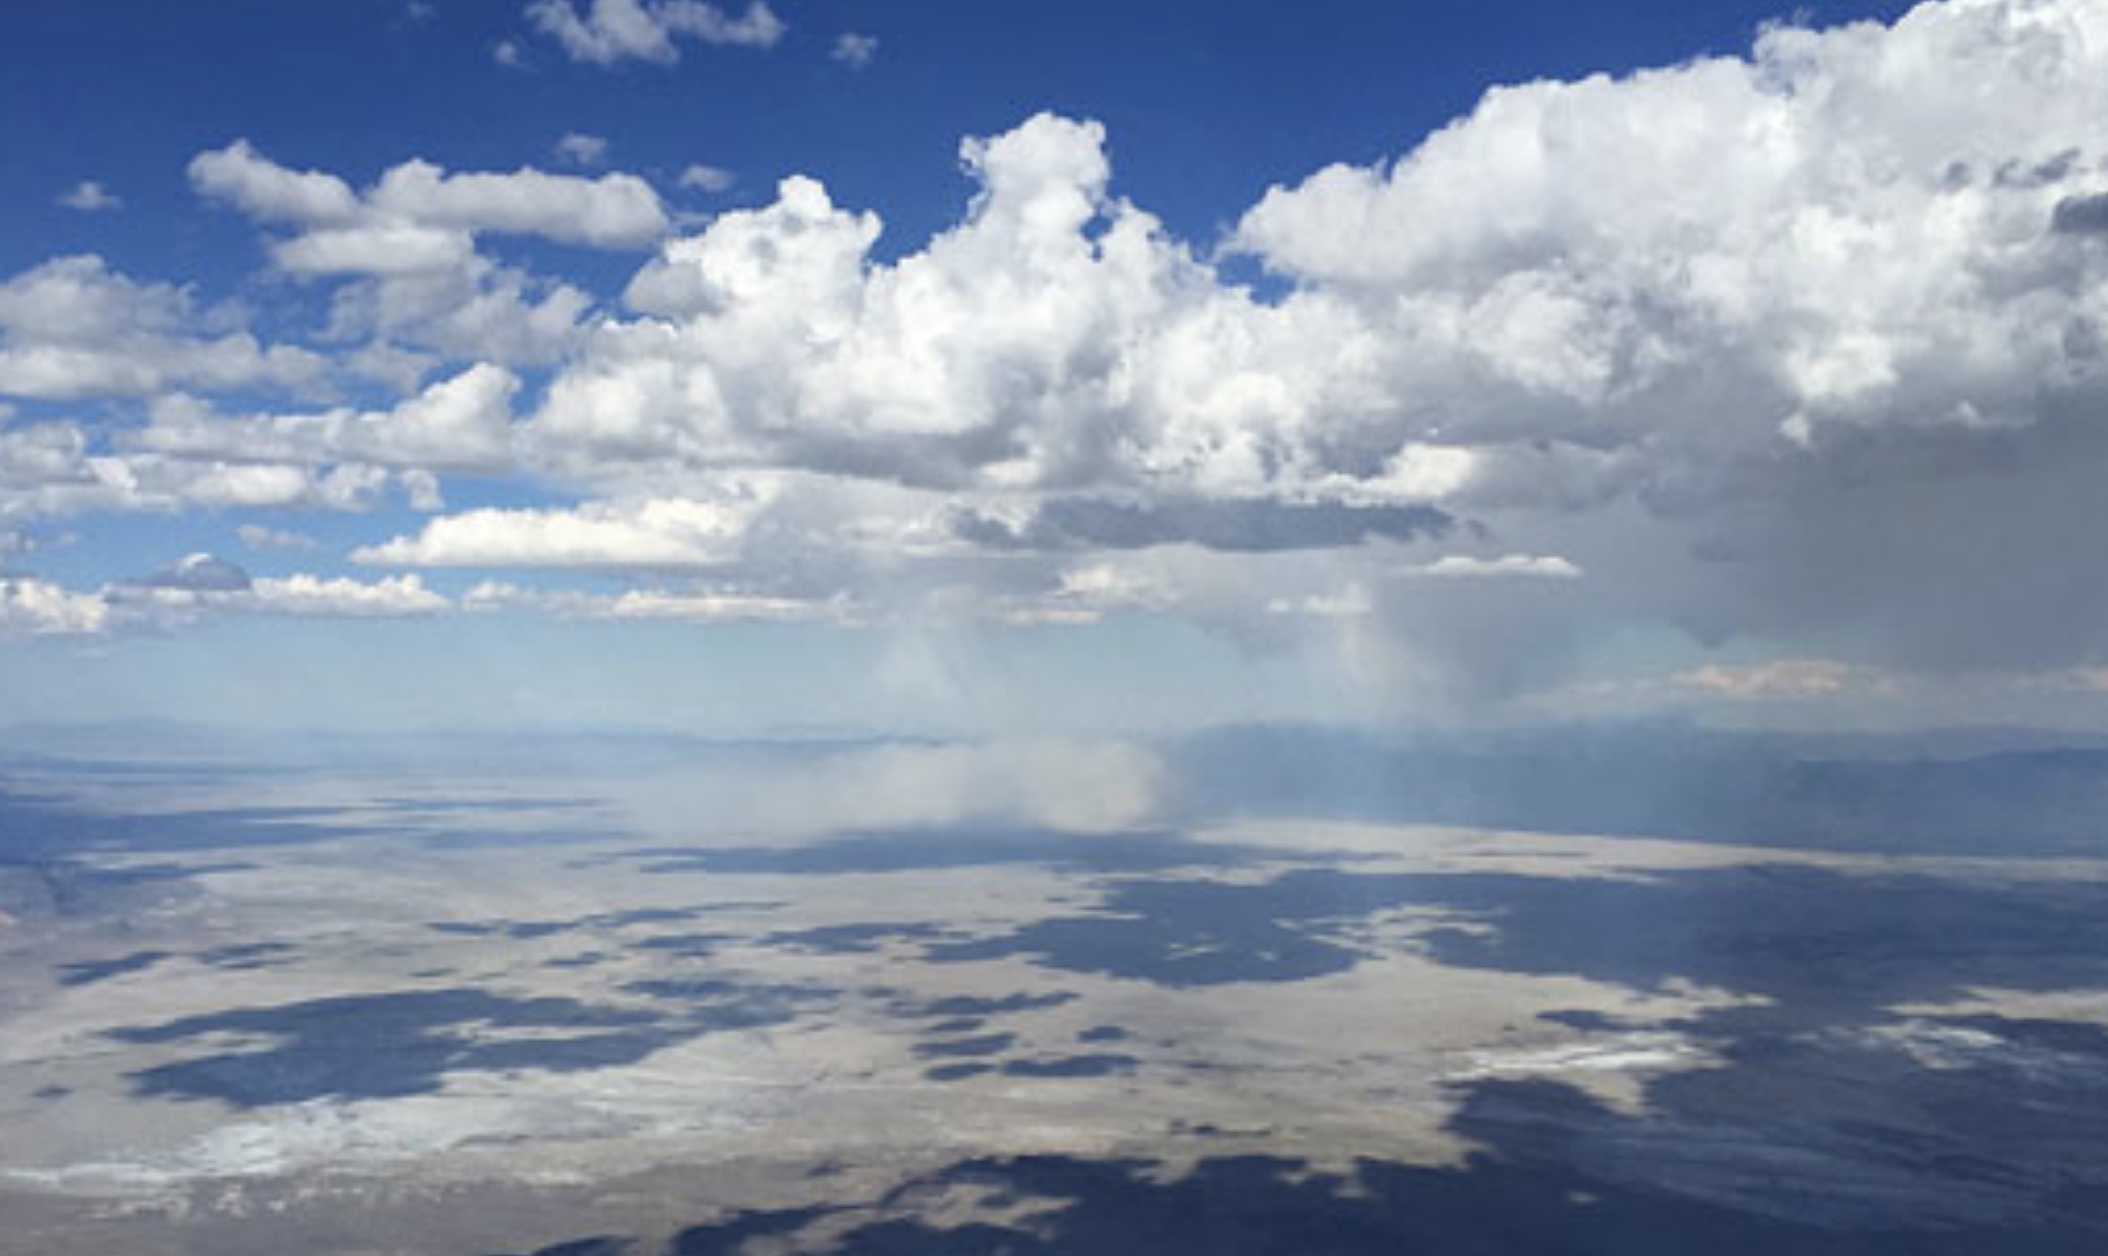
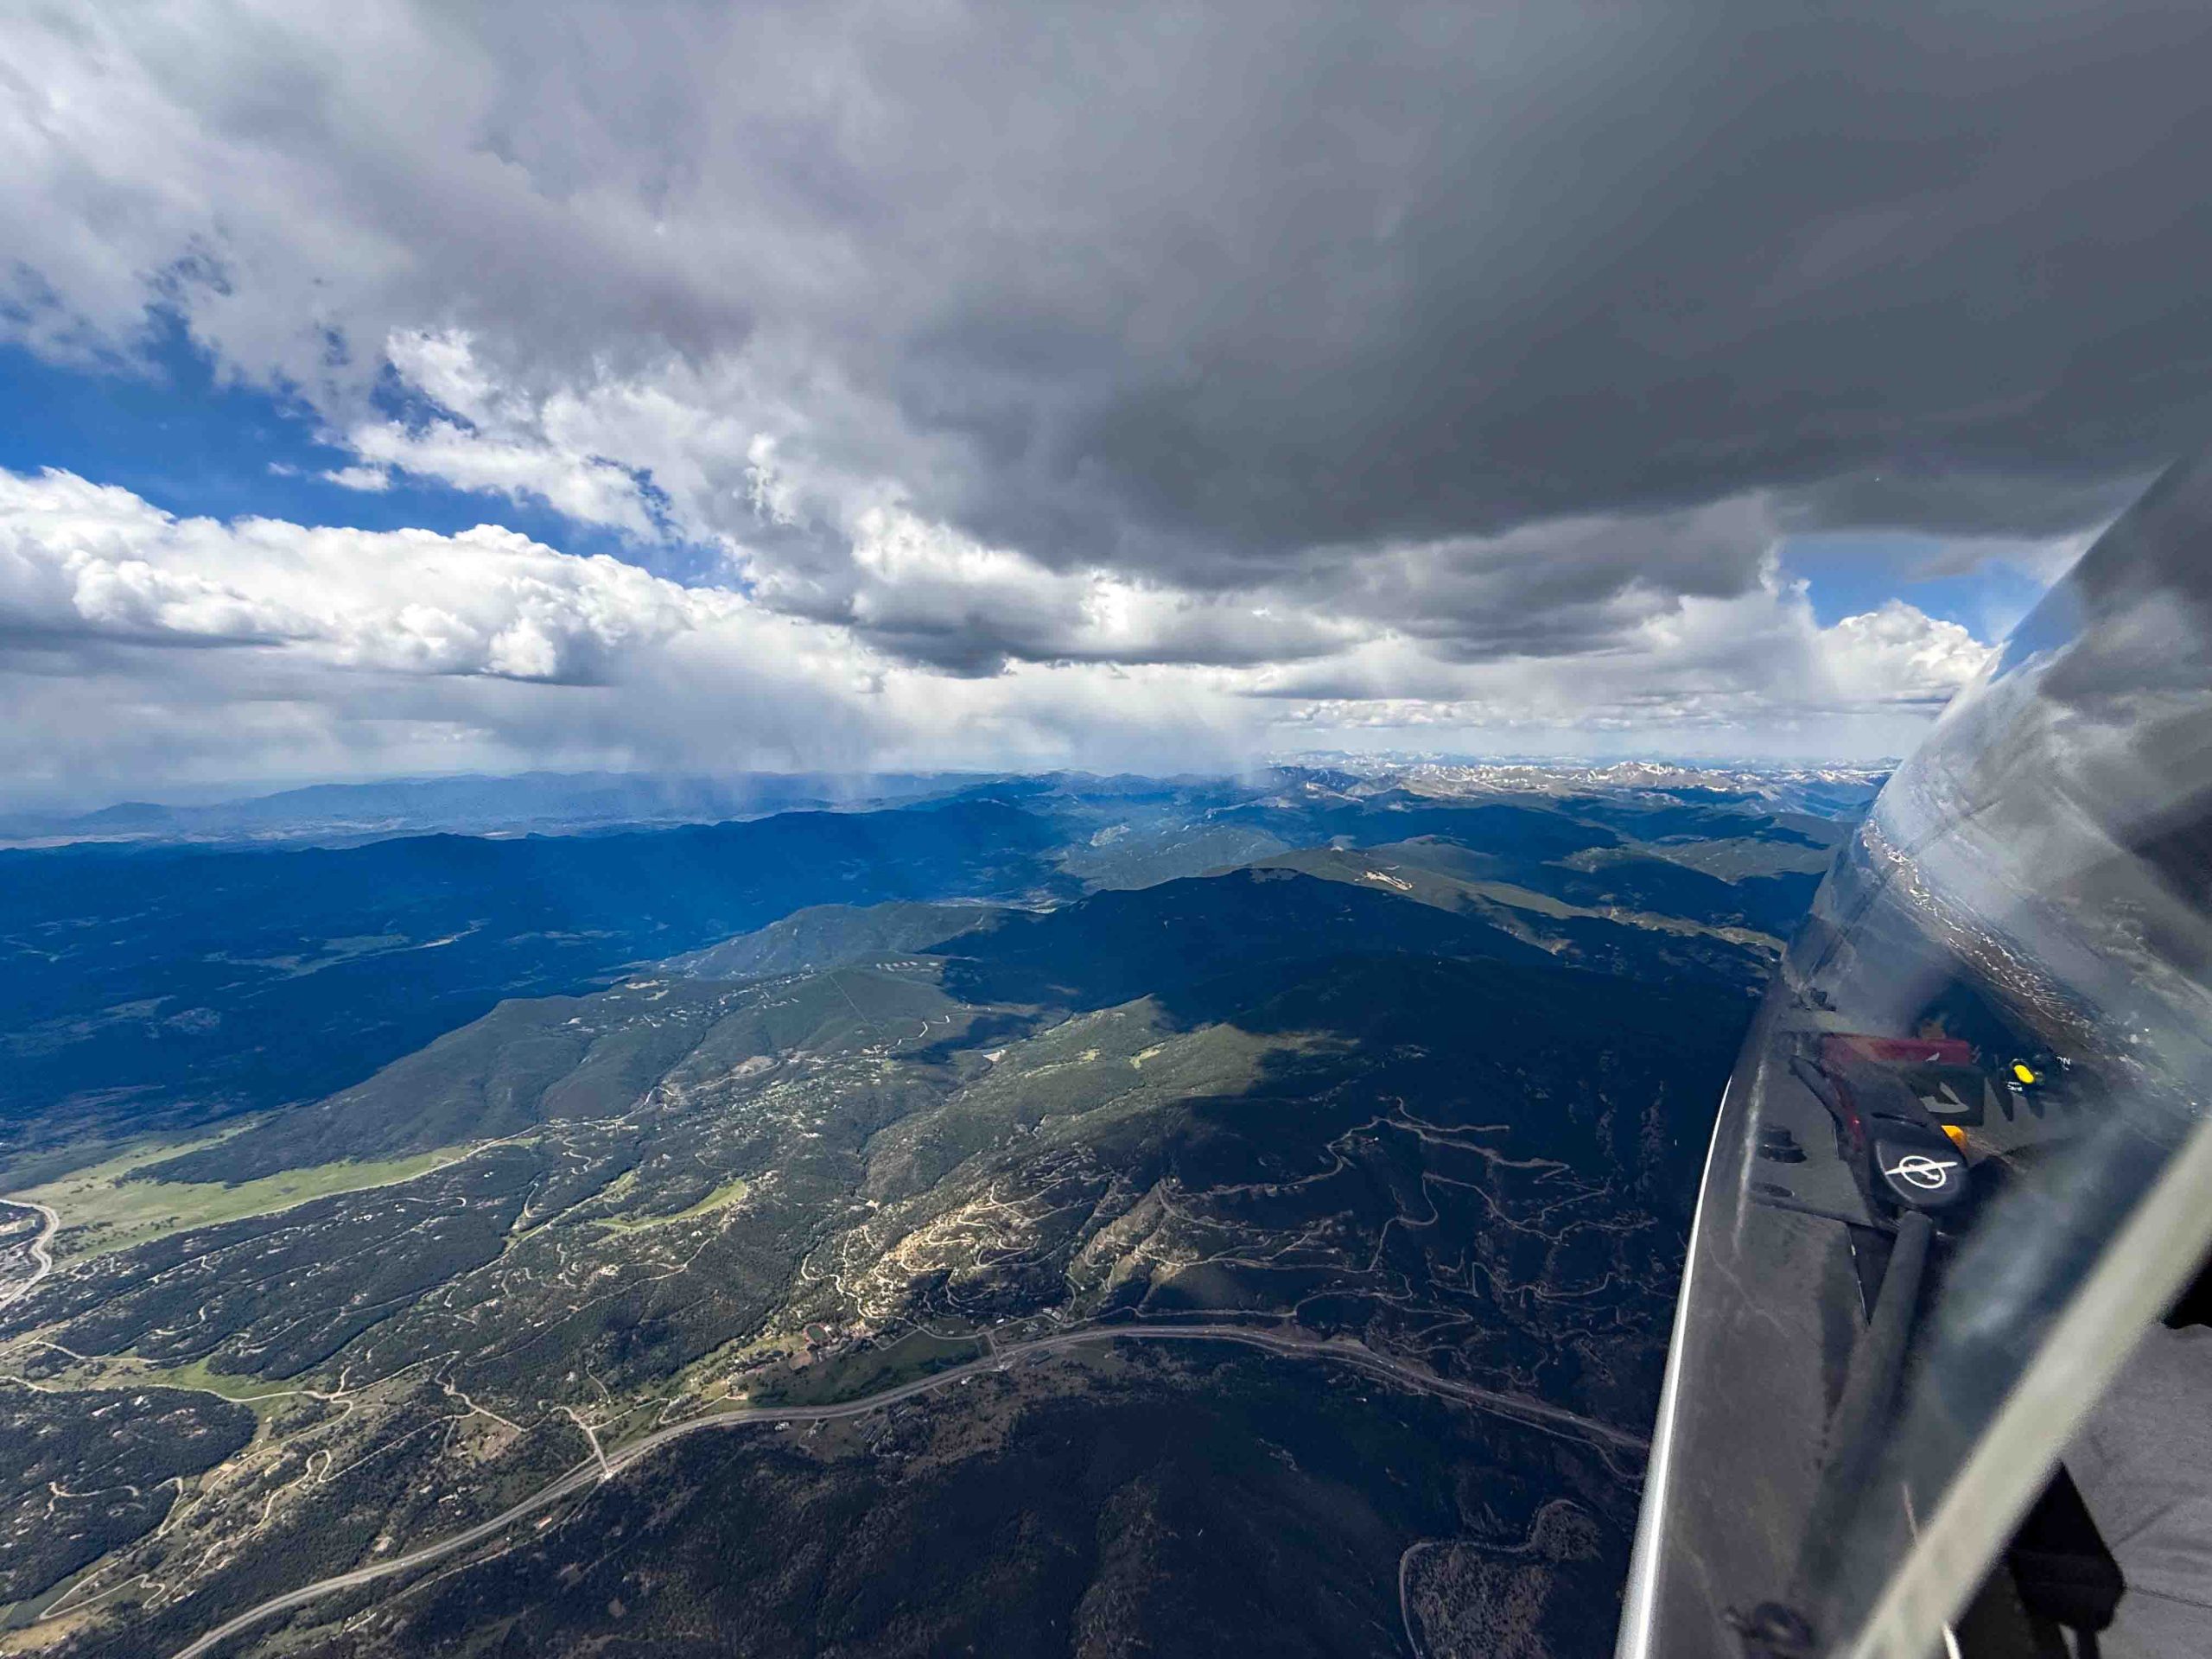
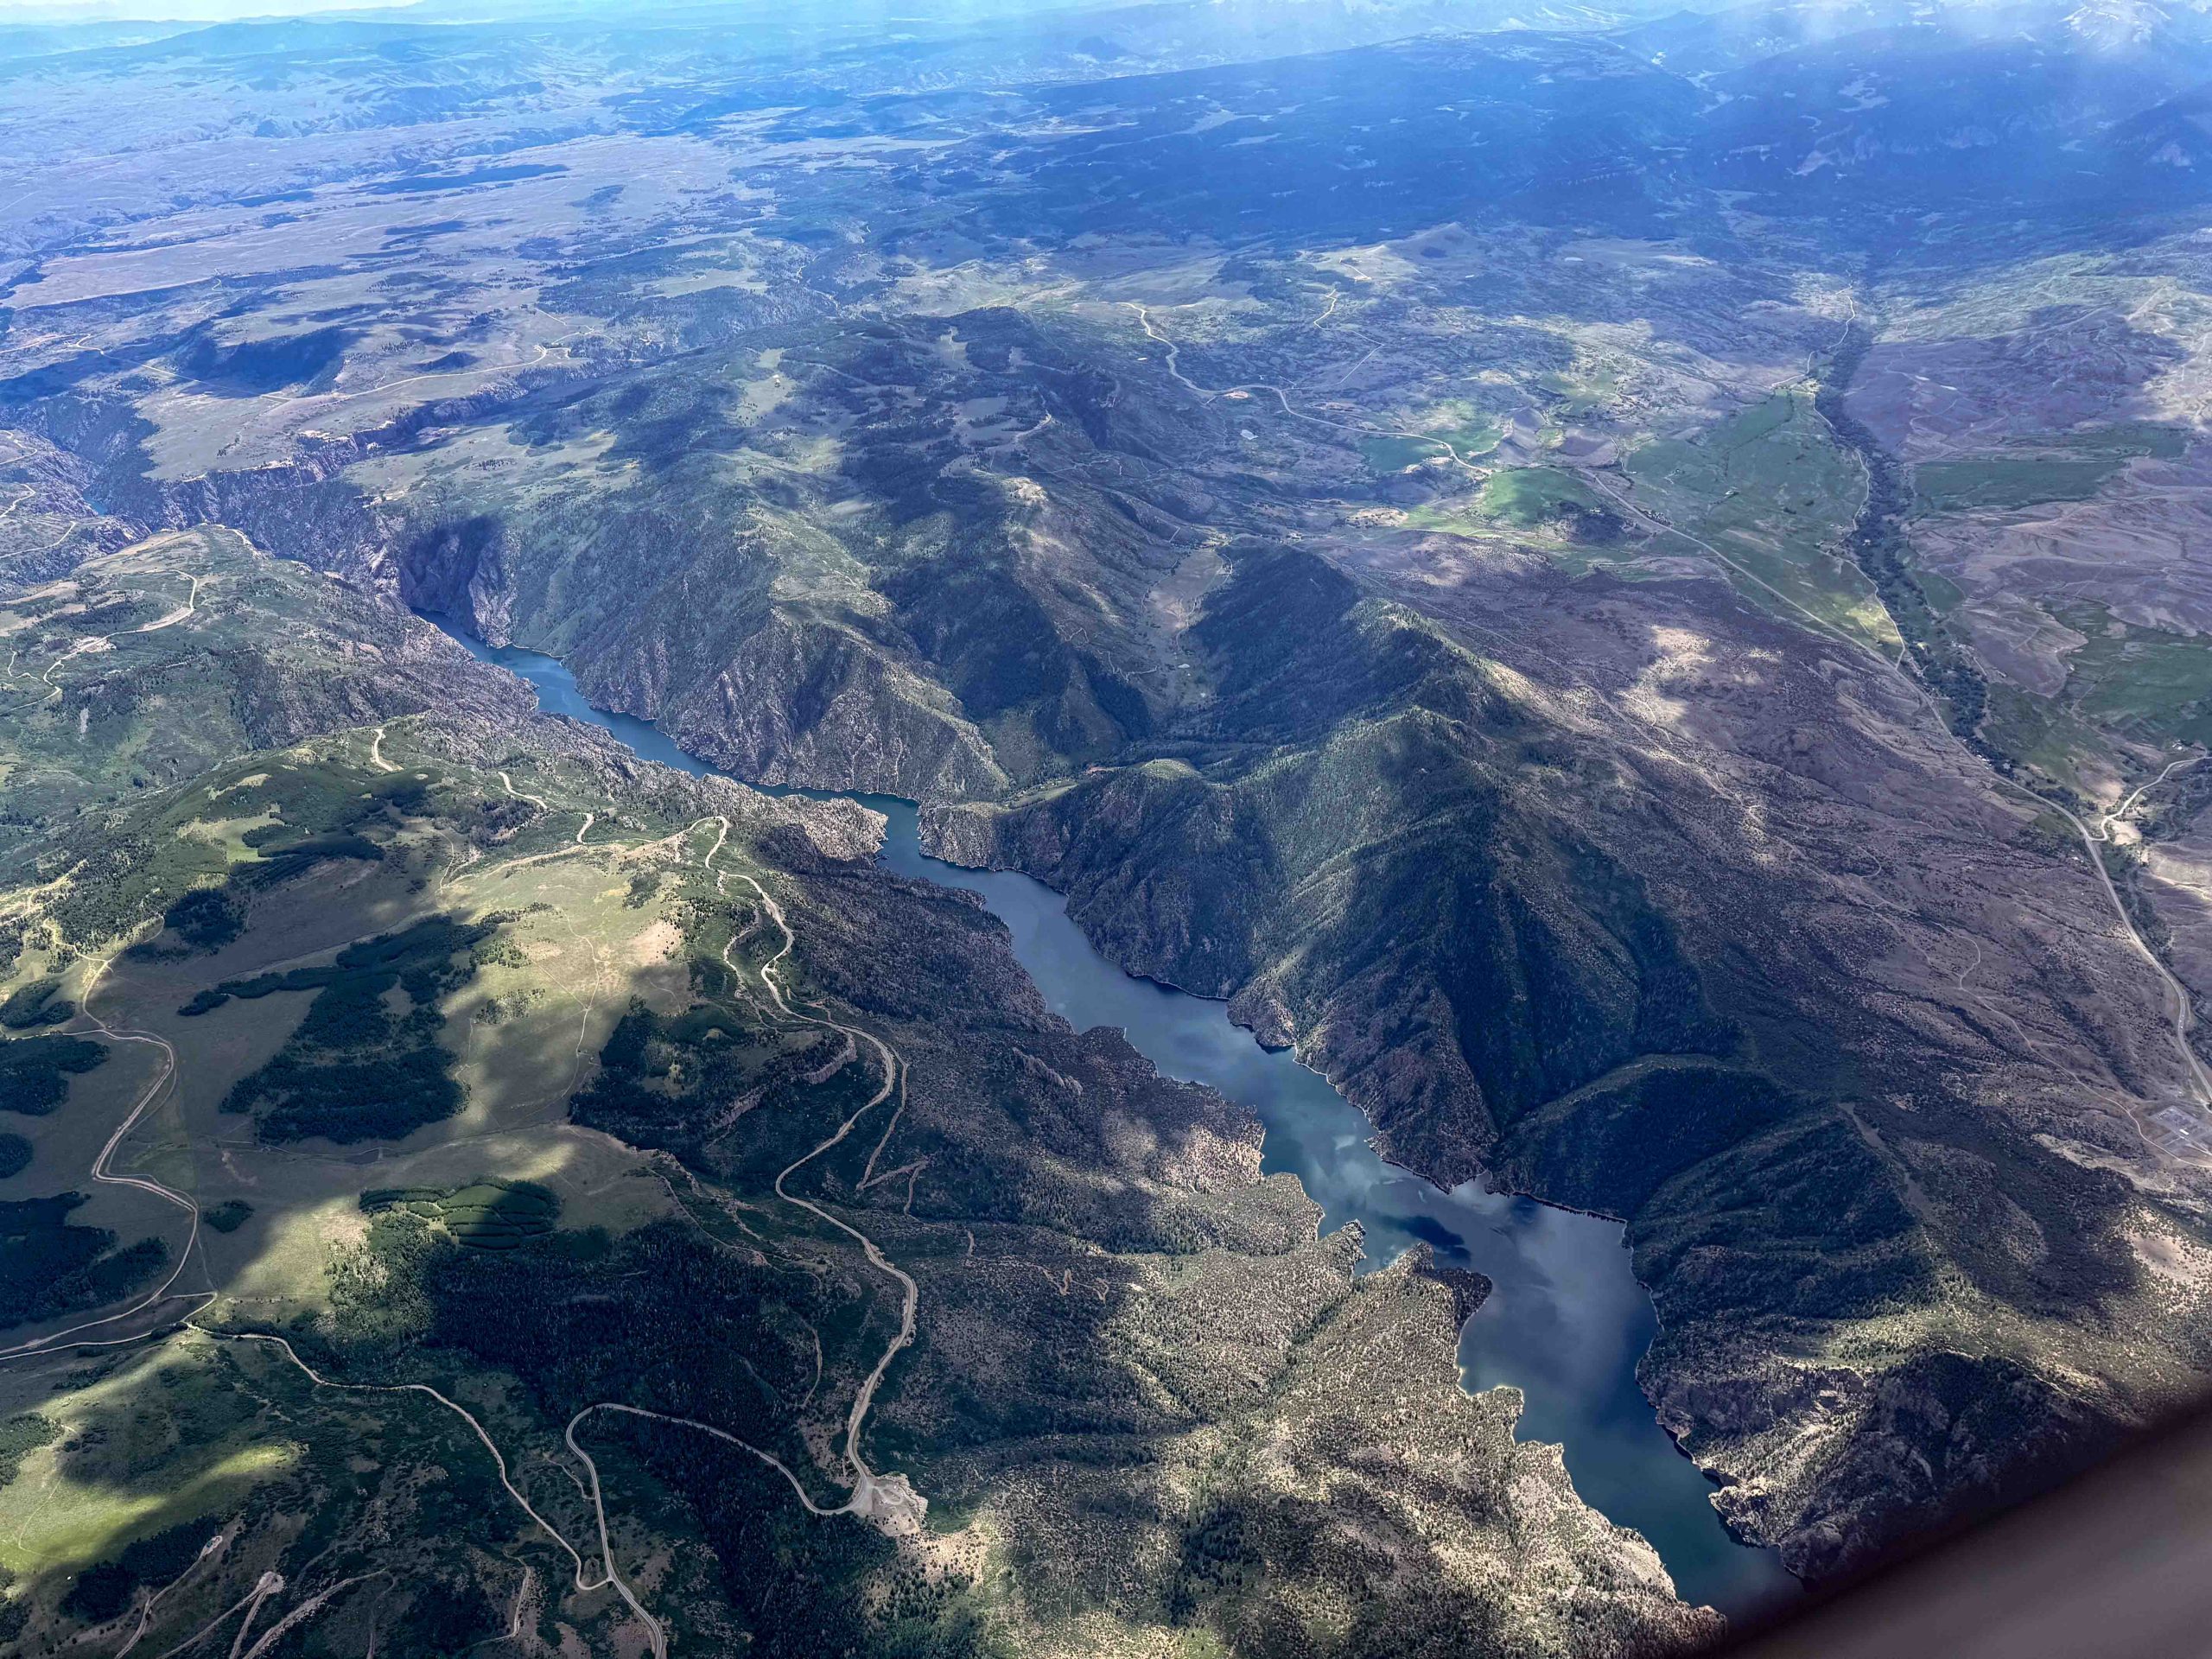
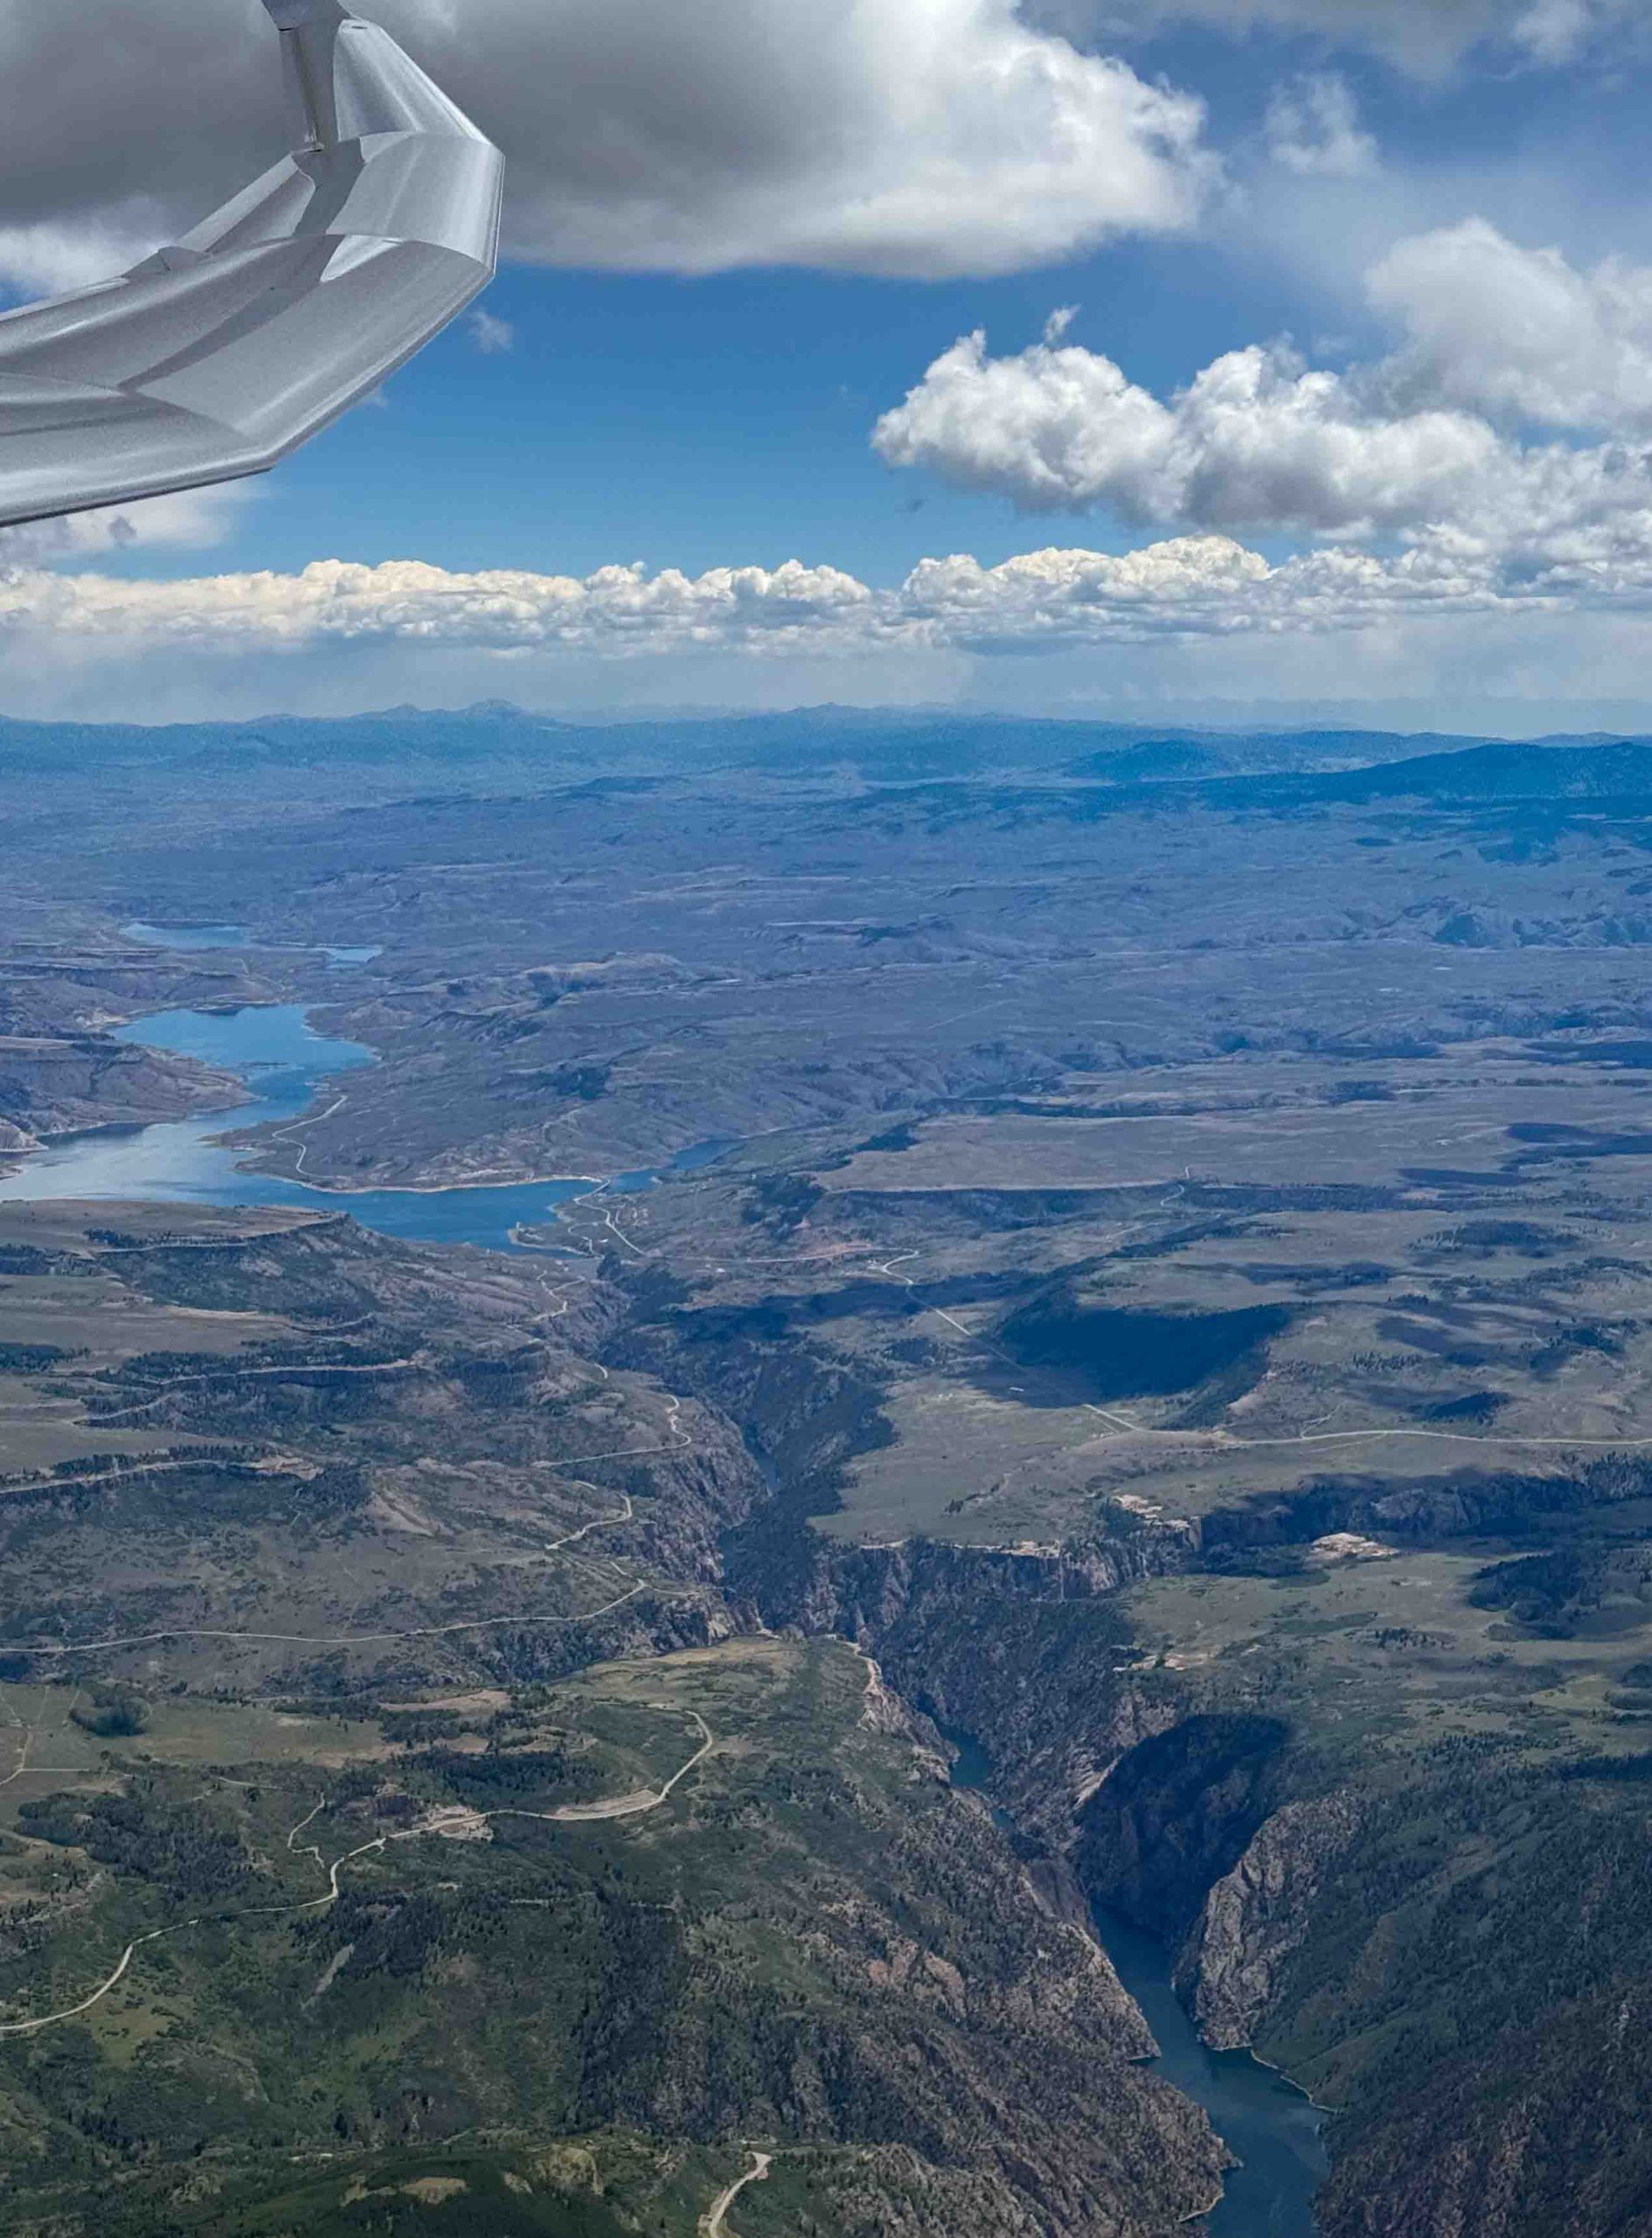
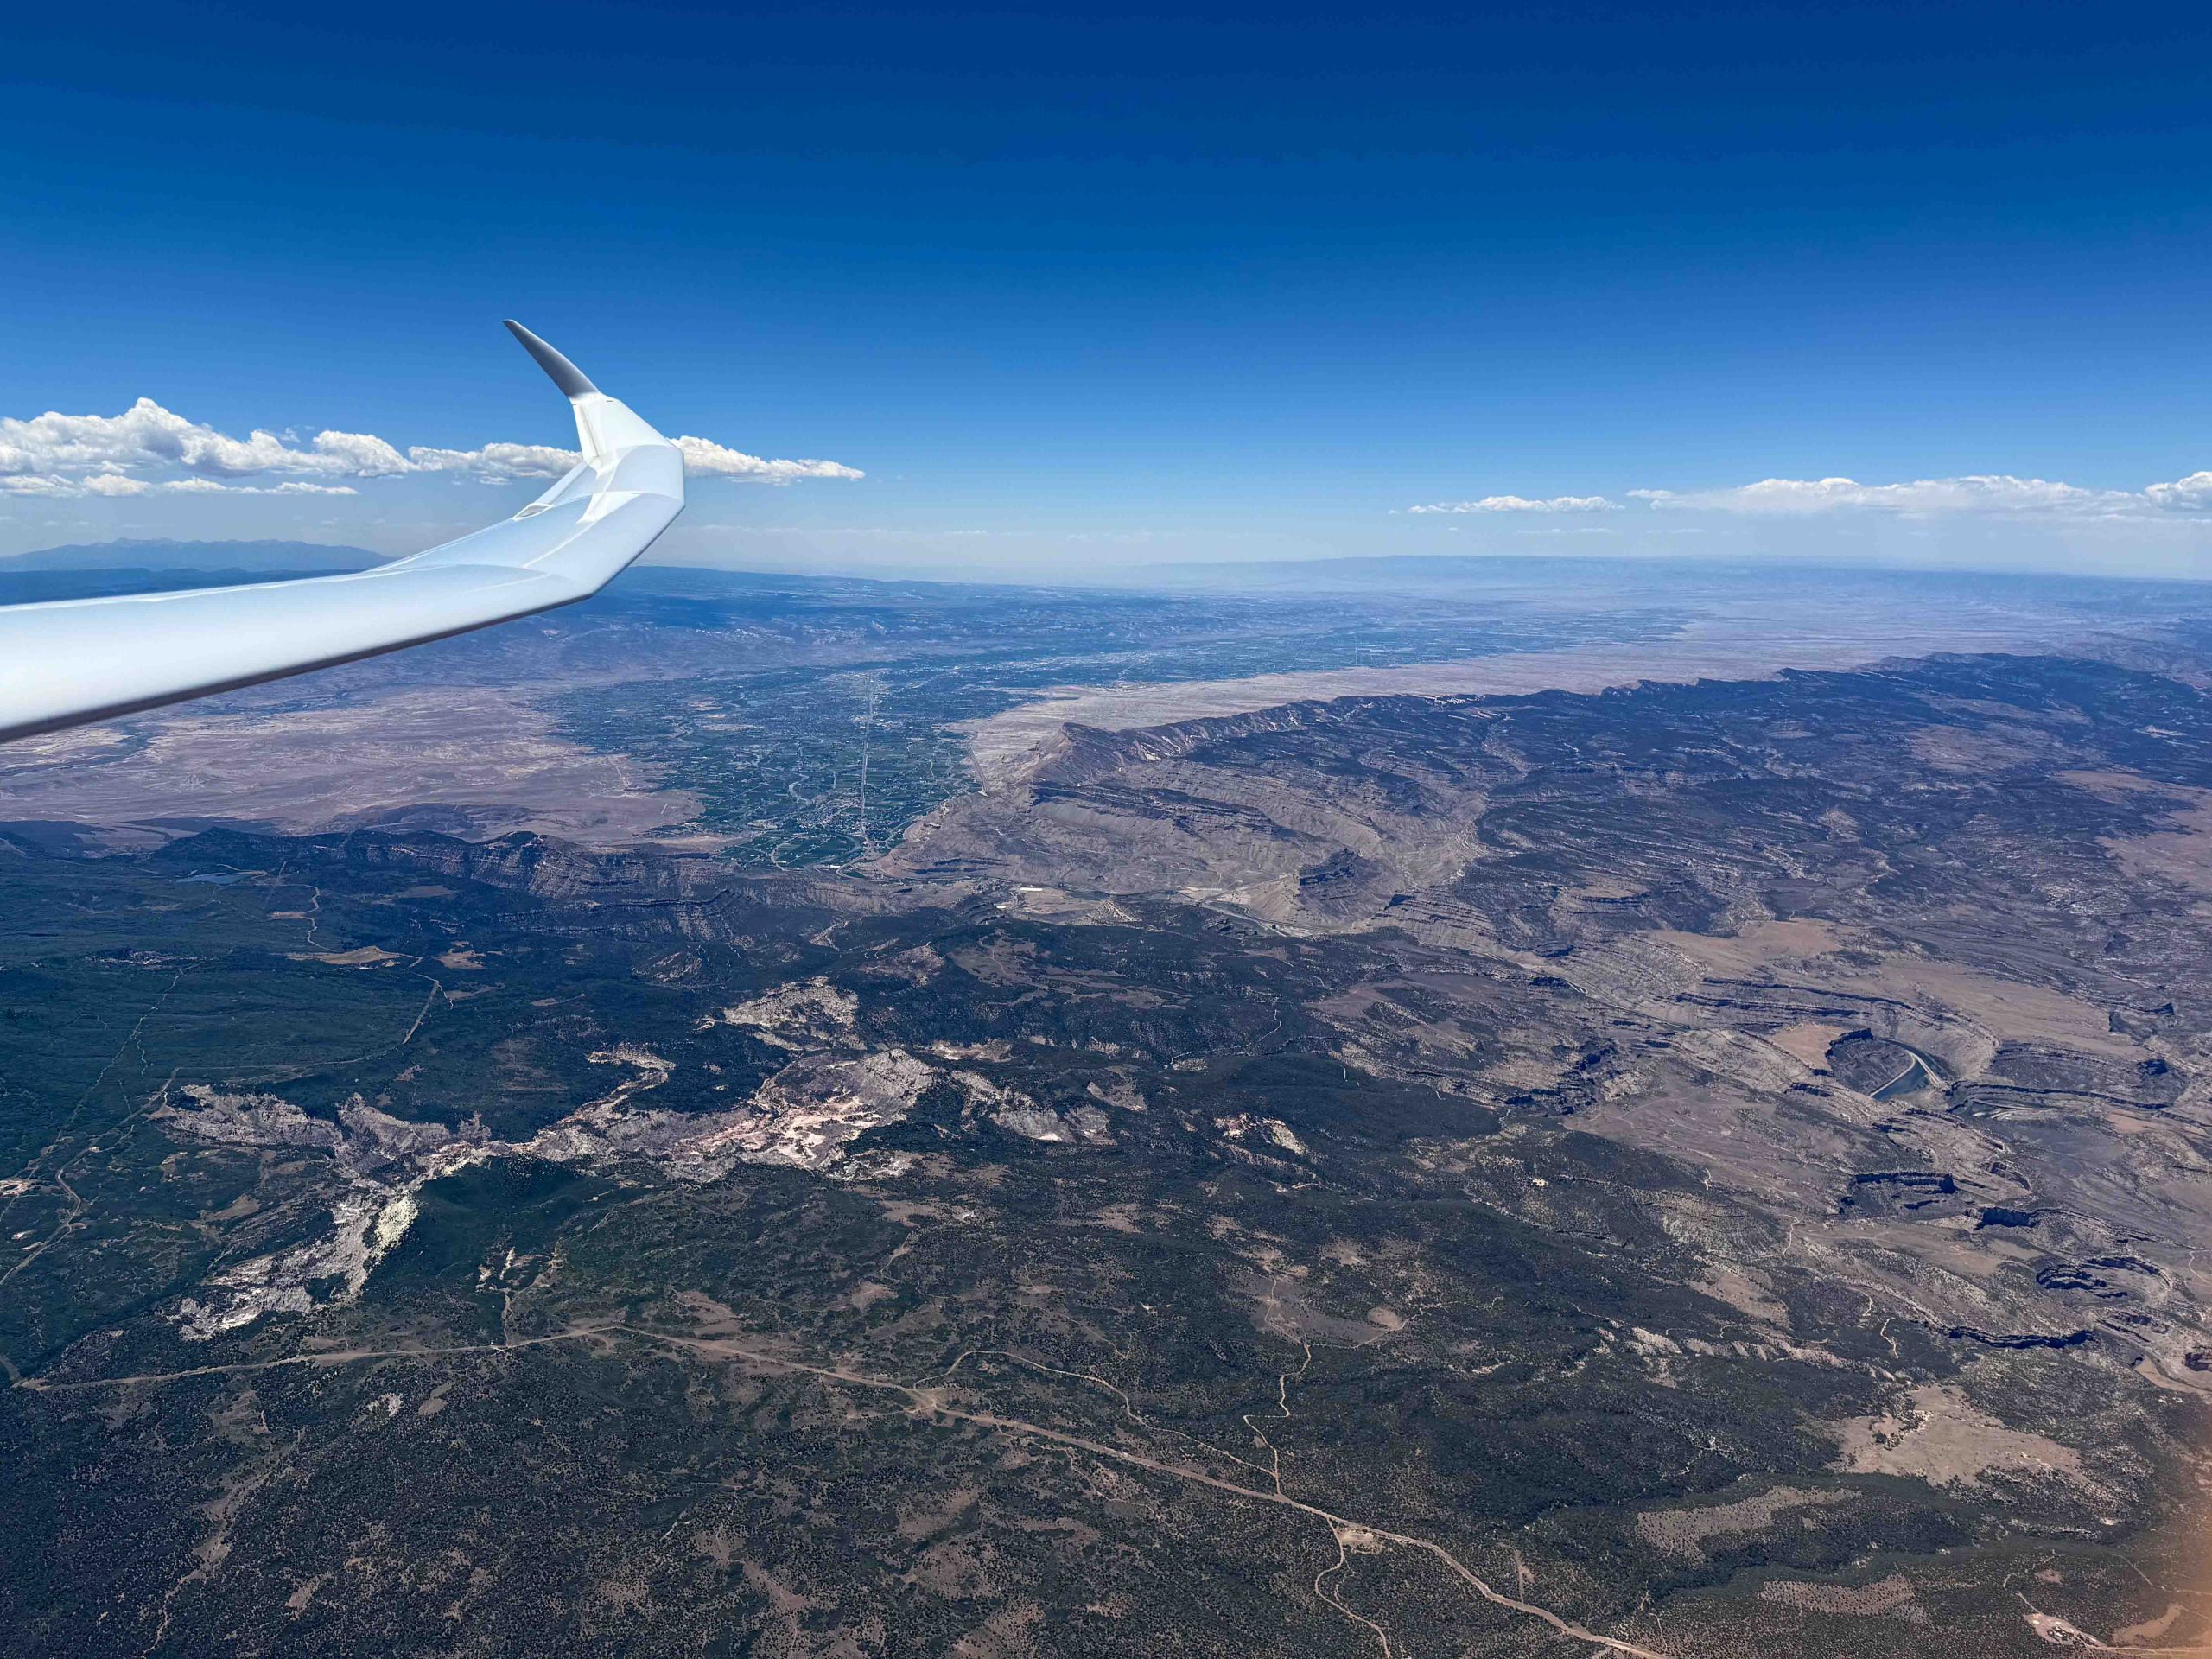
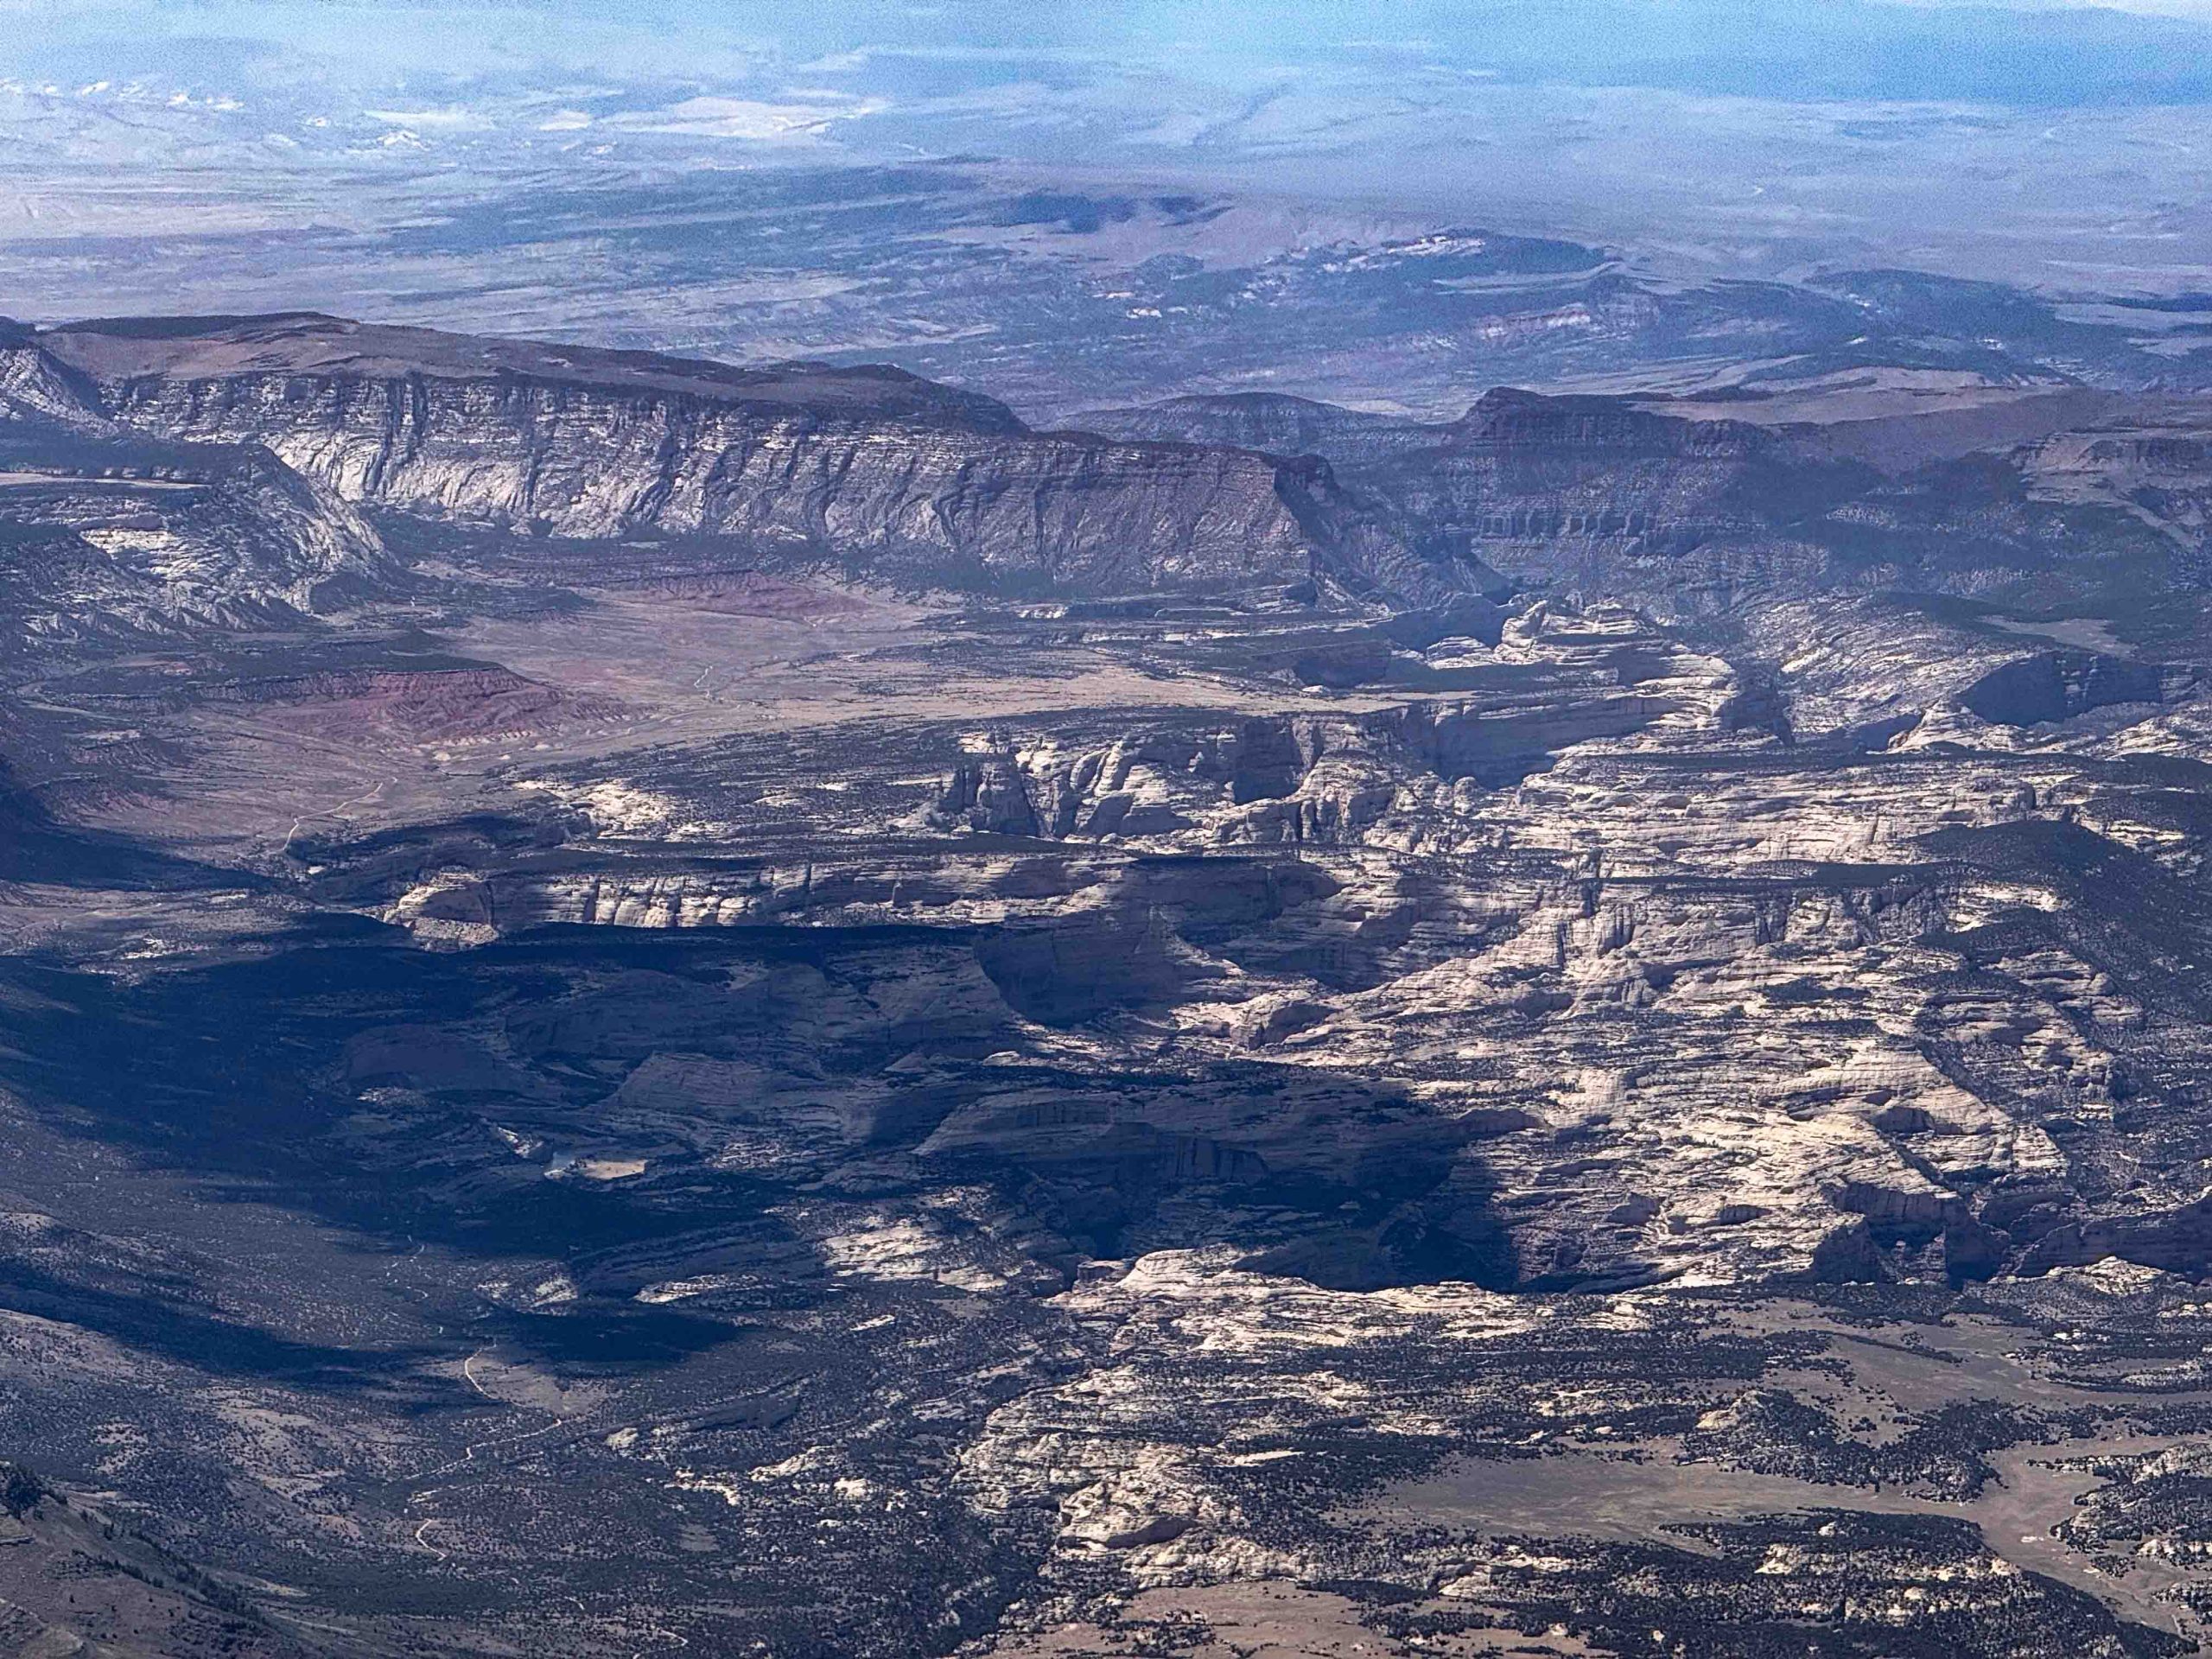
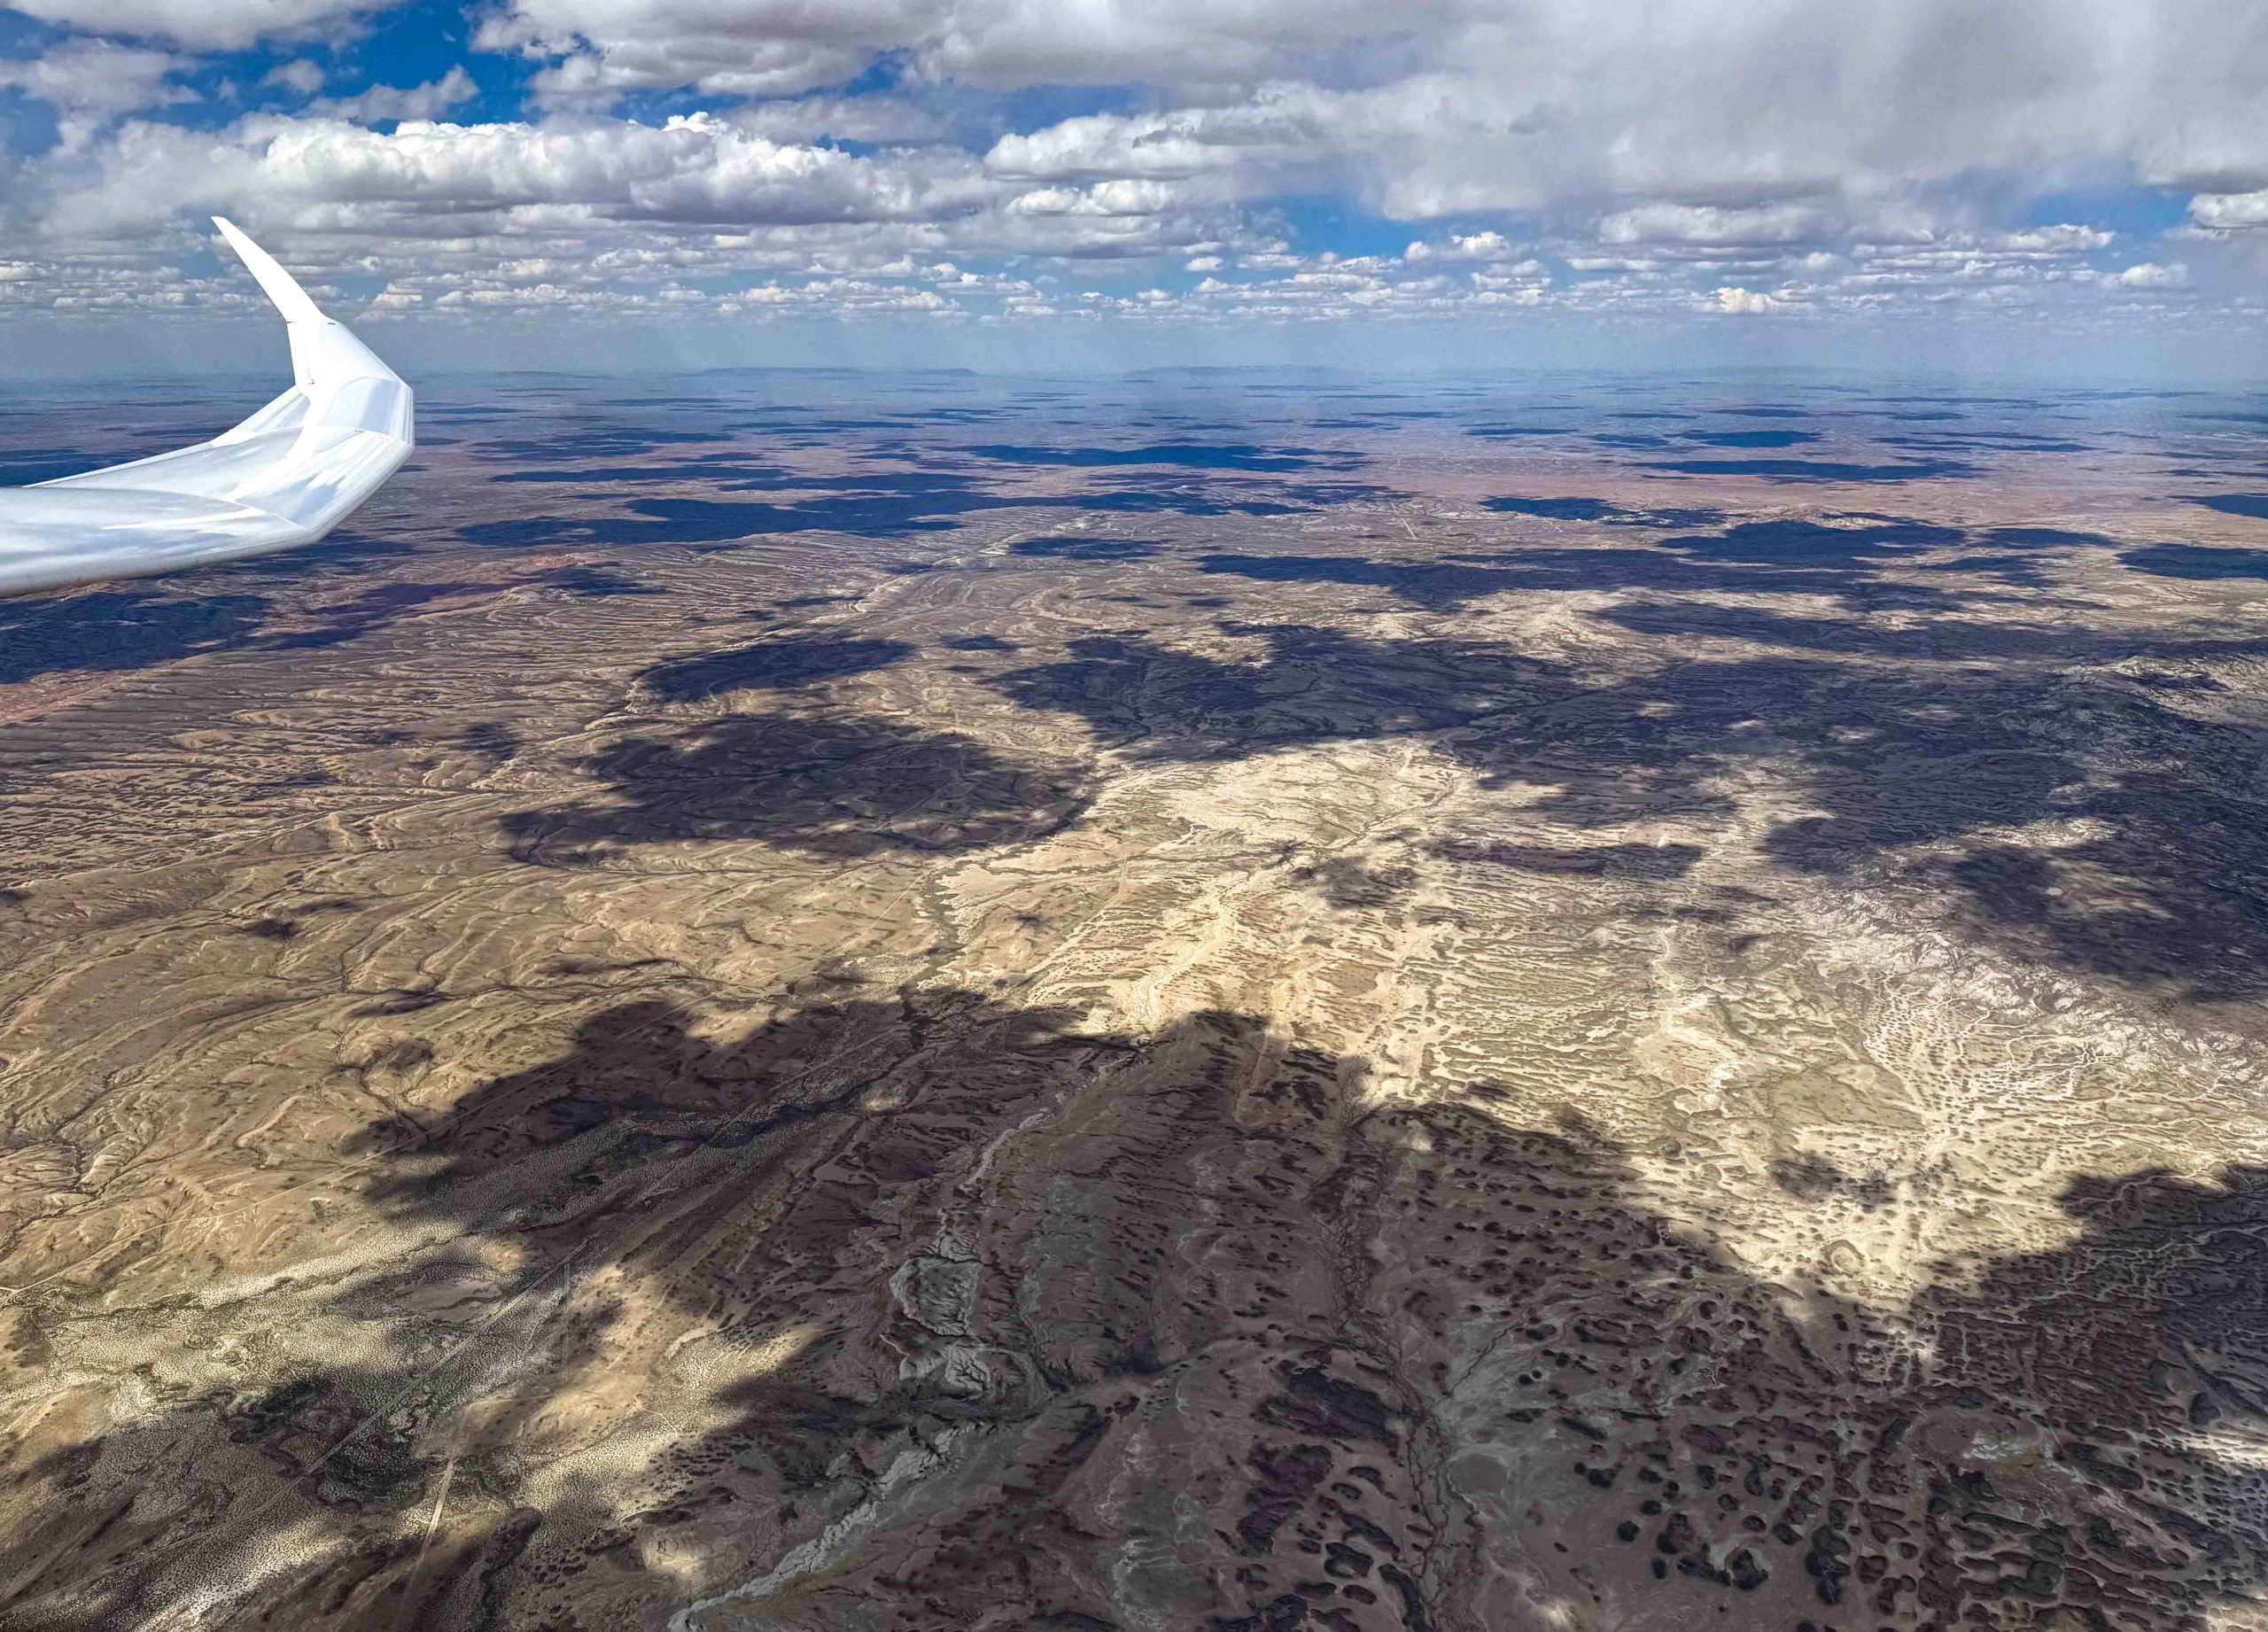
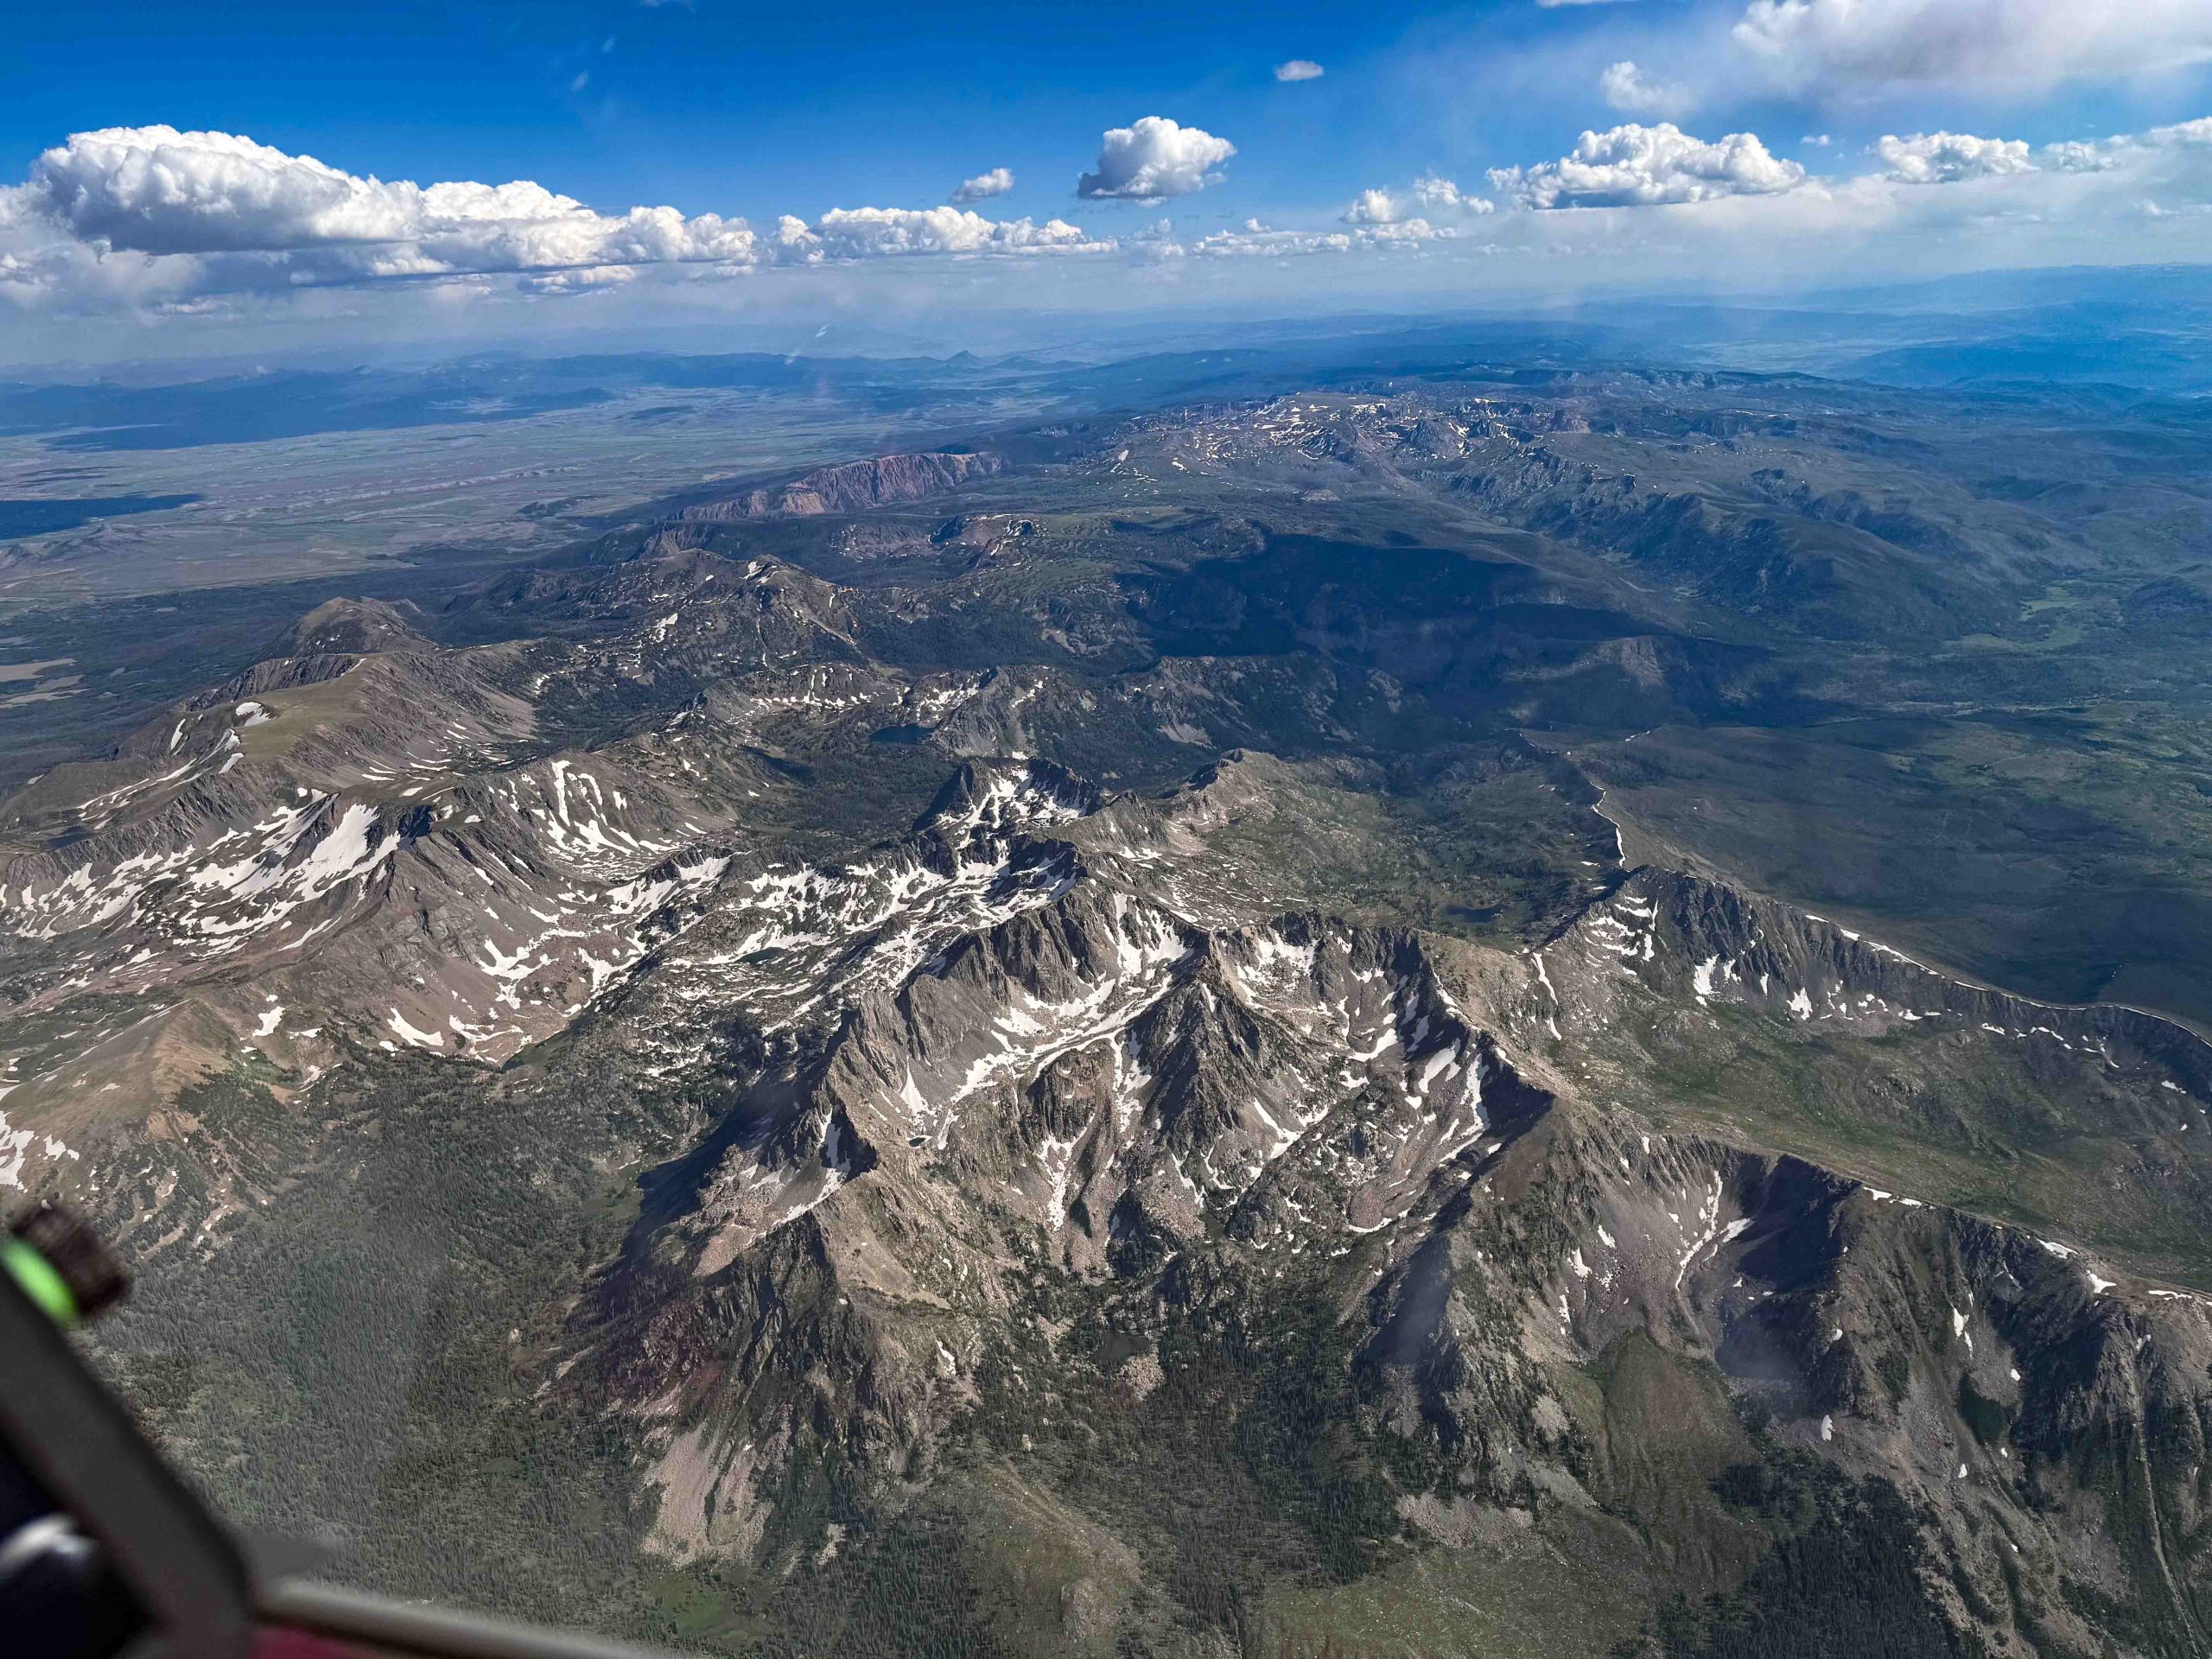
No longer concerned about the virga ahead, I took scenic pictures to the west and the east, which tell different stories.

The view to the west shows where the line of clouds over the Uncompahgre Plateau ended (just to the right of the wingtip) with a wide gap across the Colorado River Valley towards the Book Cliffs to the north (the clouds on the right). I suspect the ~50 mile transition through the blue would have worked with some lift in the blue (possible capped at a lower altitude). However, it would not only have been a detour but also cost mental energy.
The view to the right (i.e., to the east) shows the Plateau Creek Valley below with Horse Mountain to the left separating it from the Colorado River Valley (on the left edge). As you would expect, the clouds follow the high ground with more virga as you look into the distance to the east where the elevation increases.

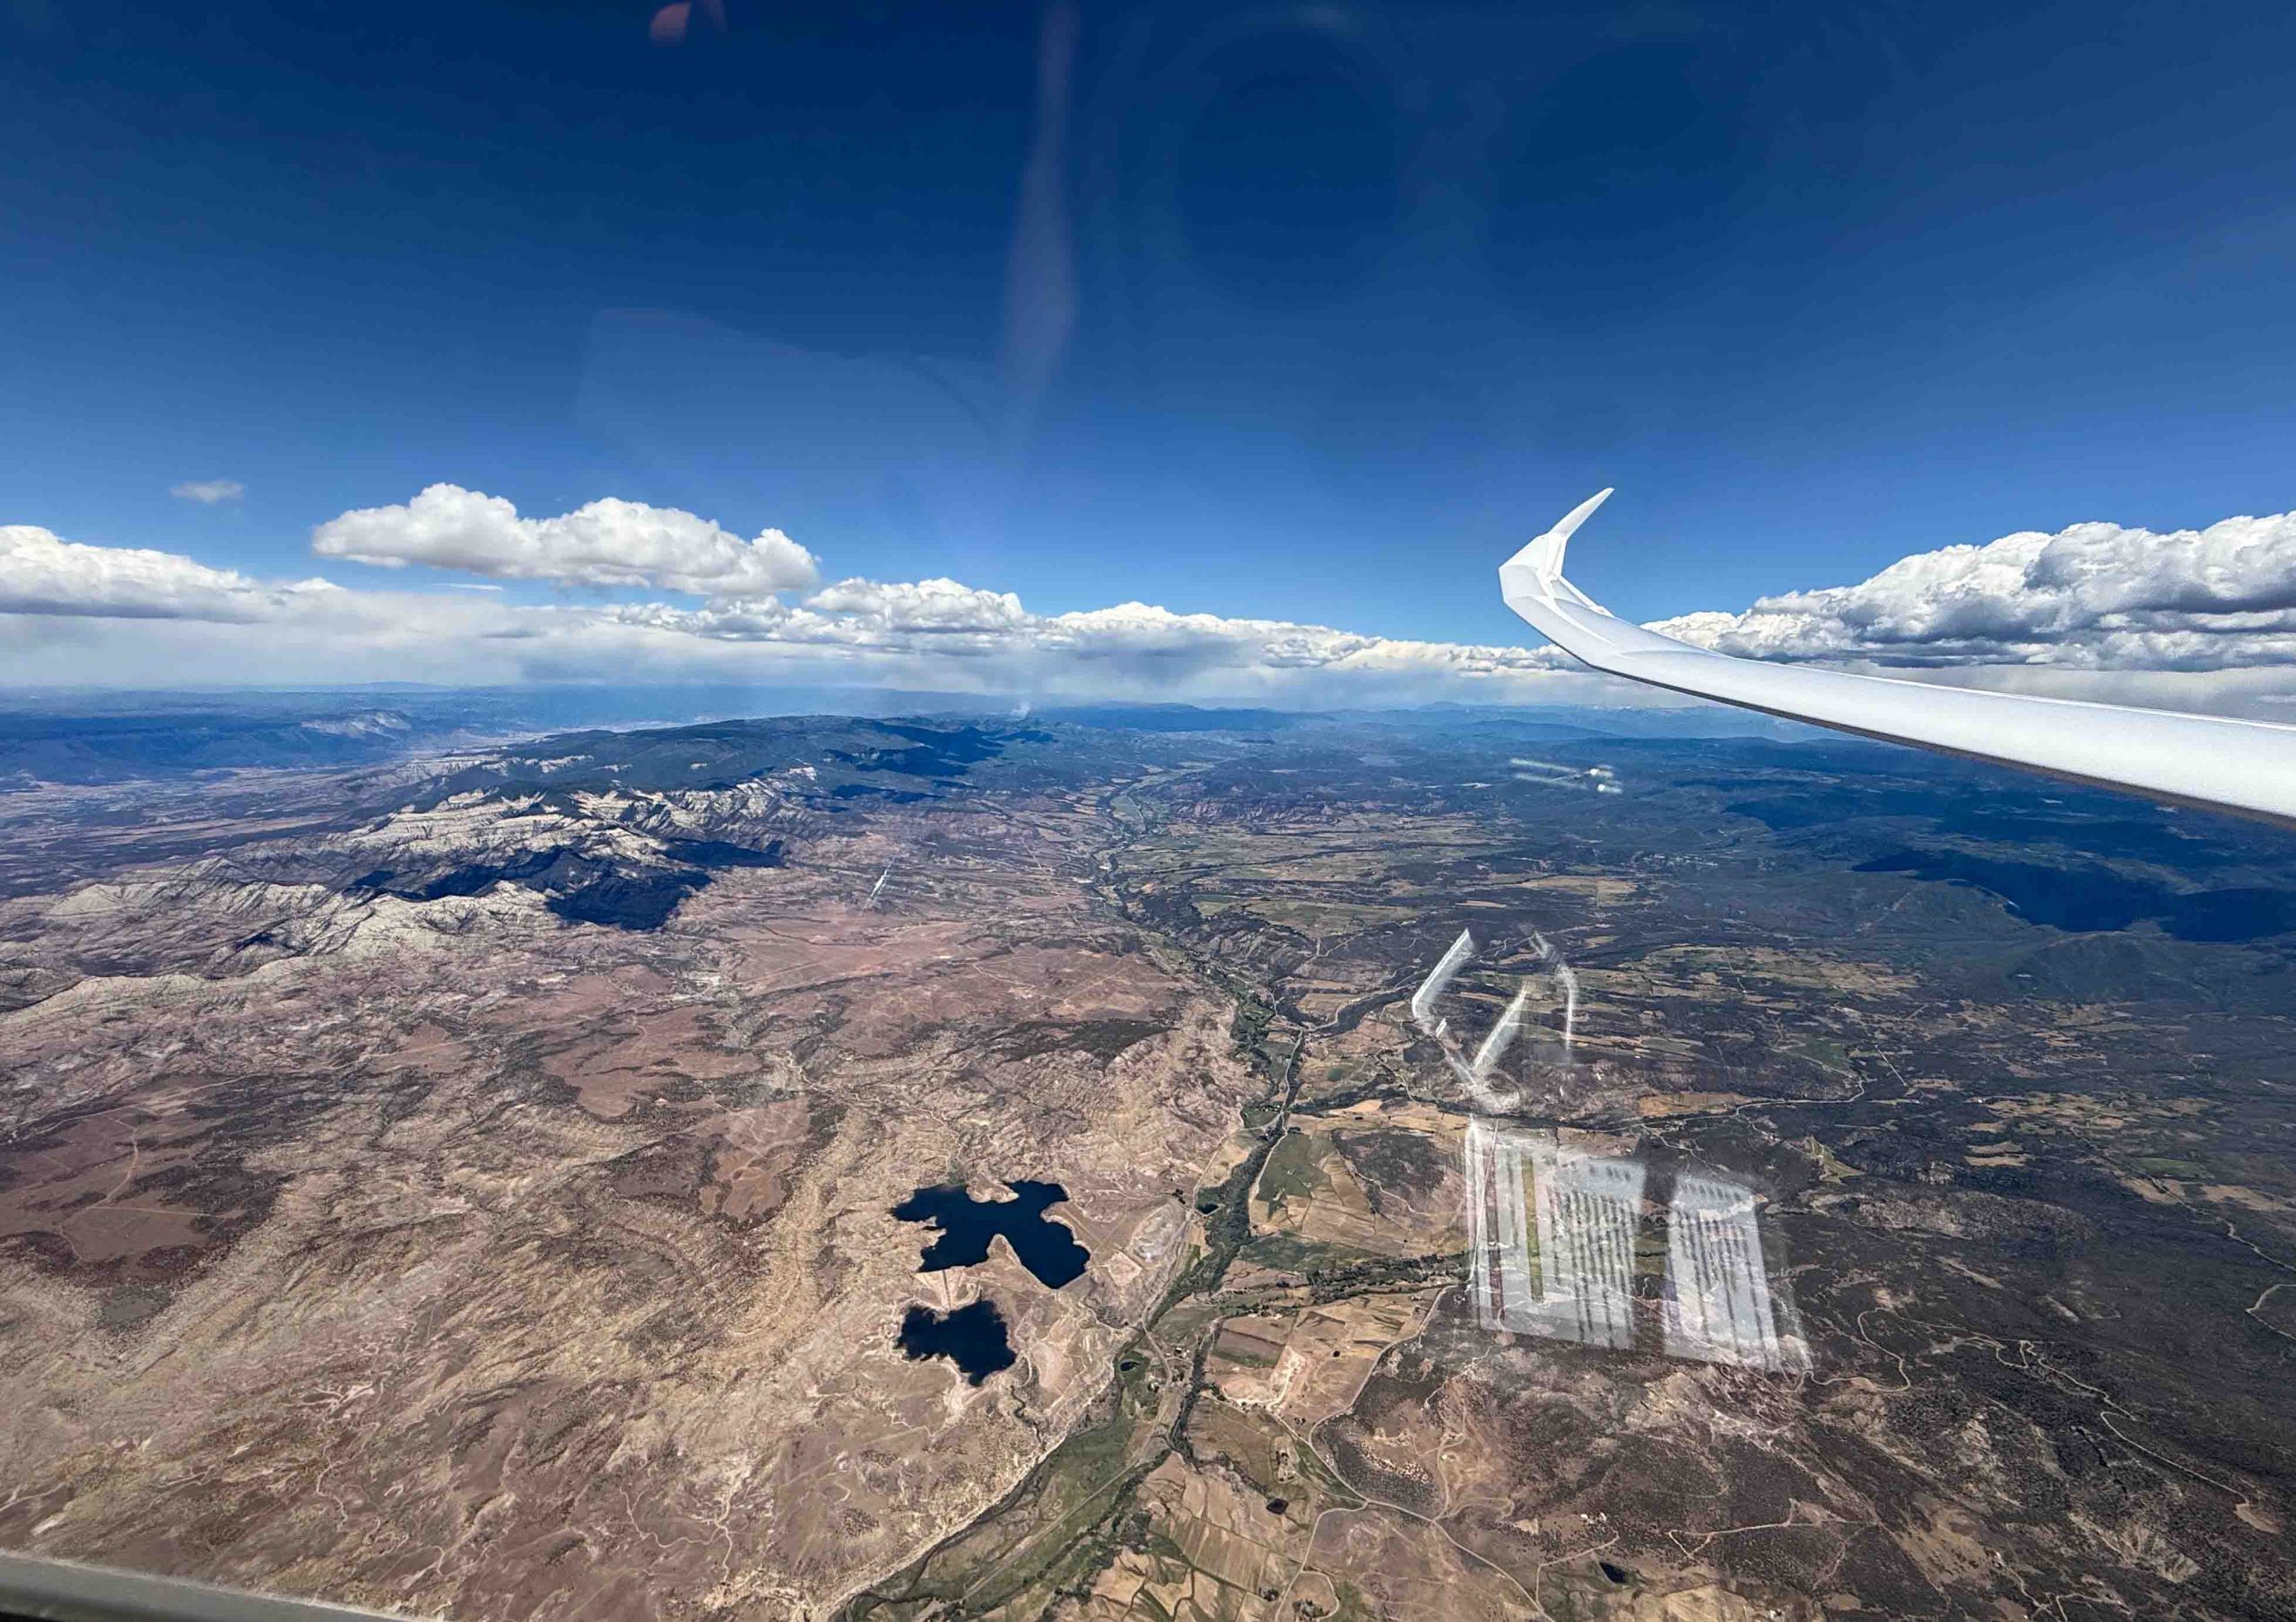
Transitioning through the virga line turned out to be a non issue. This was also a moment to take note of the time.  As discussed earlier, the Book Cliffs were my cut off location in case I would fall behind schedule. I chose it because from there I am very familiar with the route back towards Boulder with good airports along the way should I run into weather issue.  As I arrived over the cliffs, my watch showed 2:00 PM and my cut off time was 2:20 PM, which meant I was still on schedule.  The sky behind the virga looked good and I saw no reason to waver.

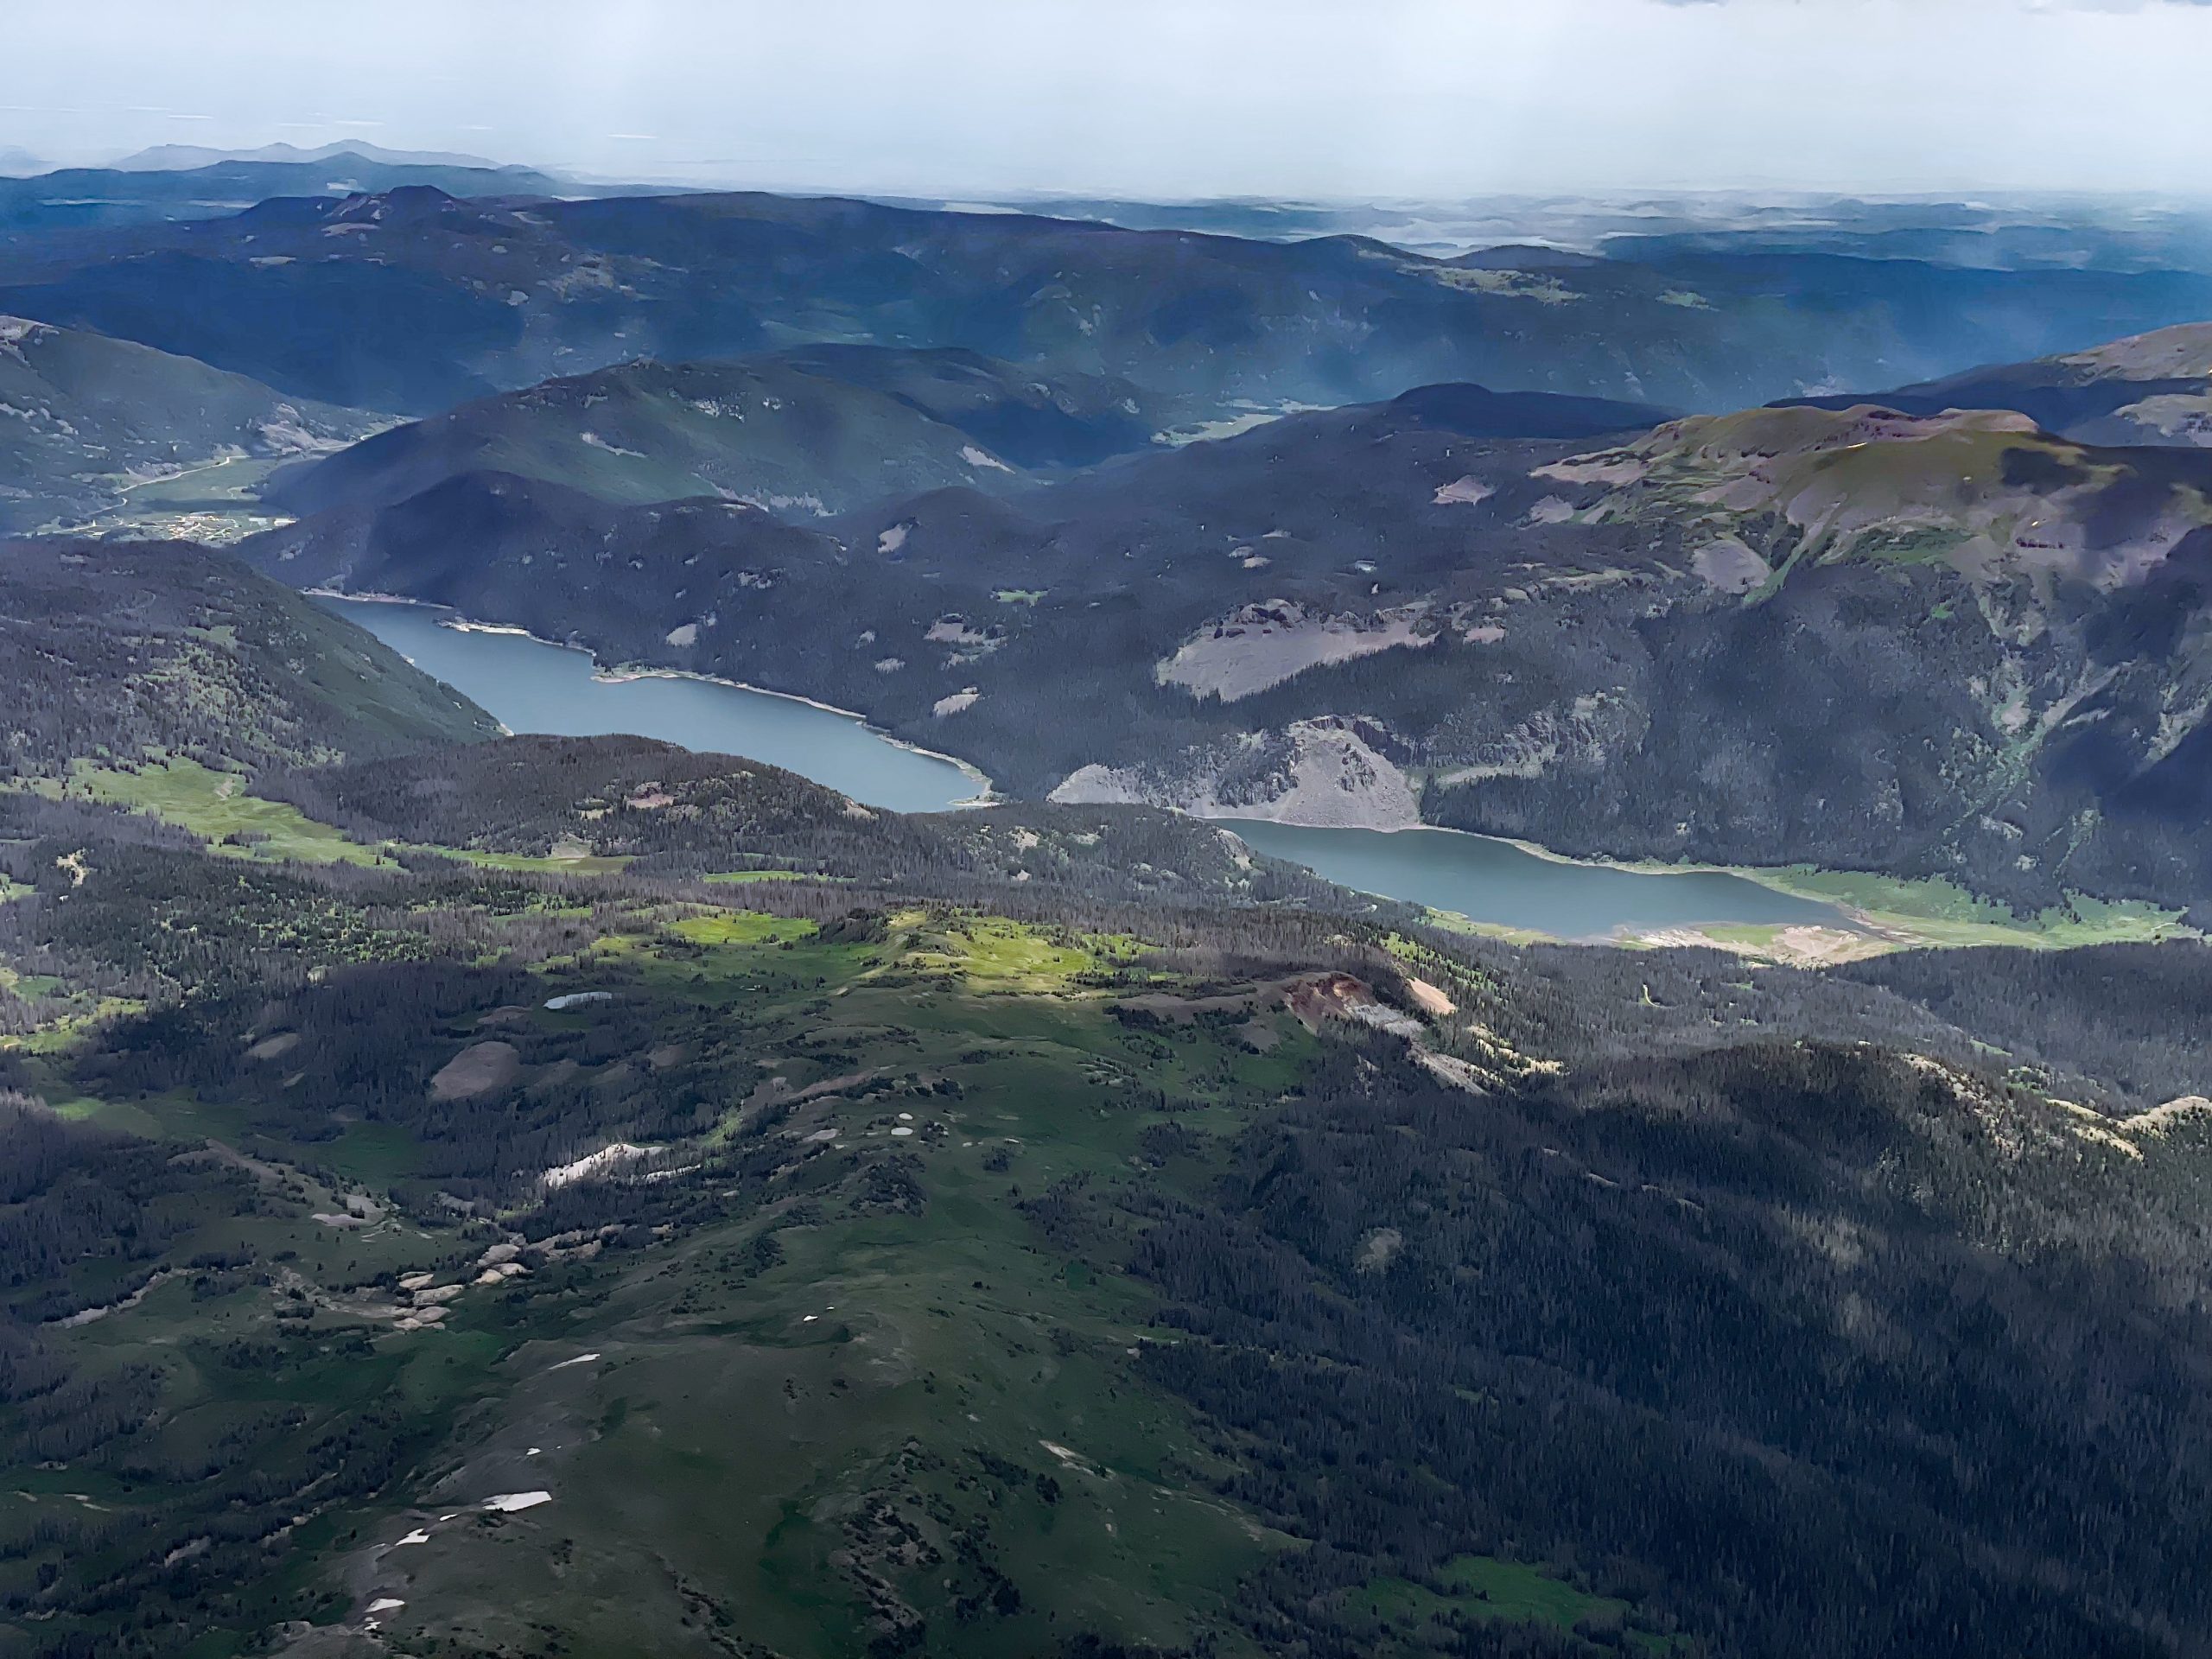
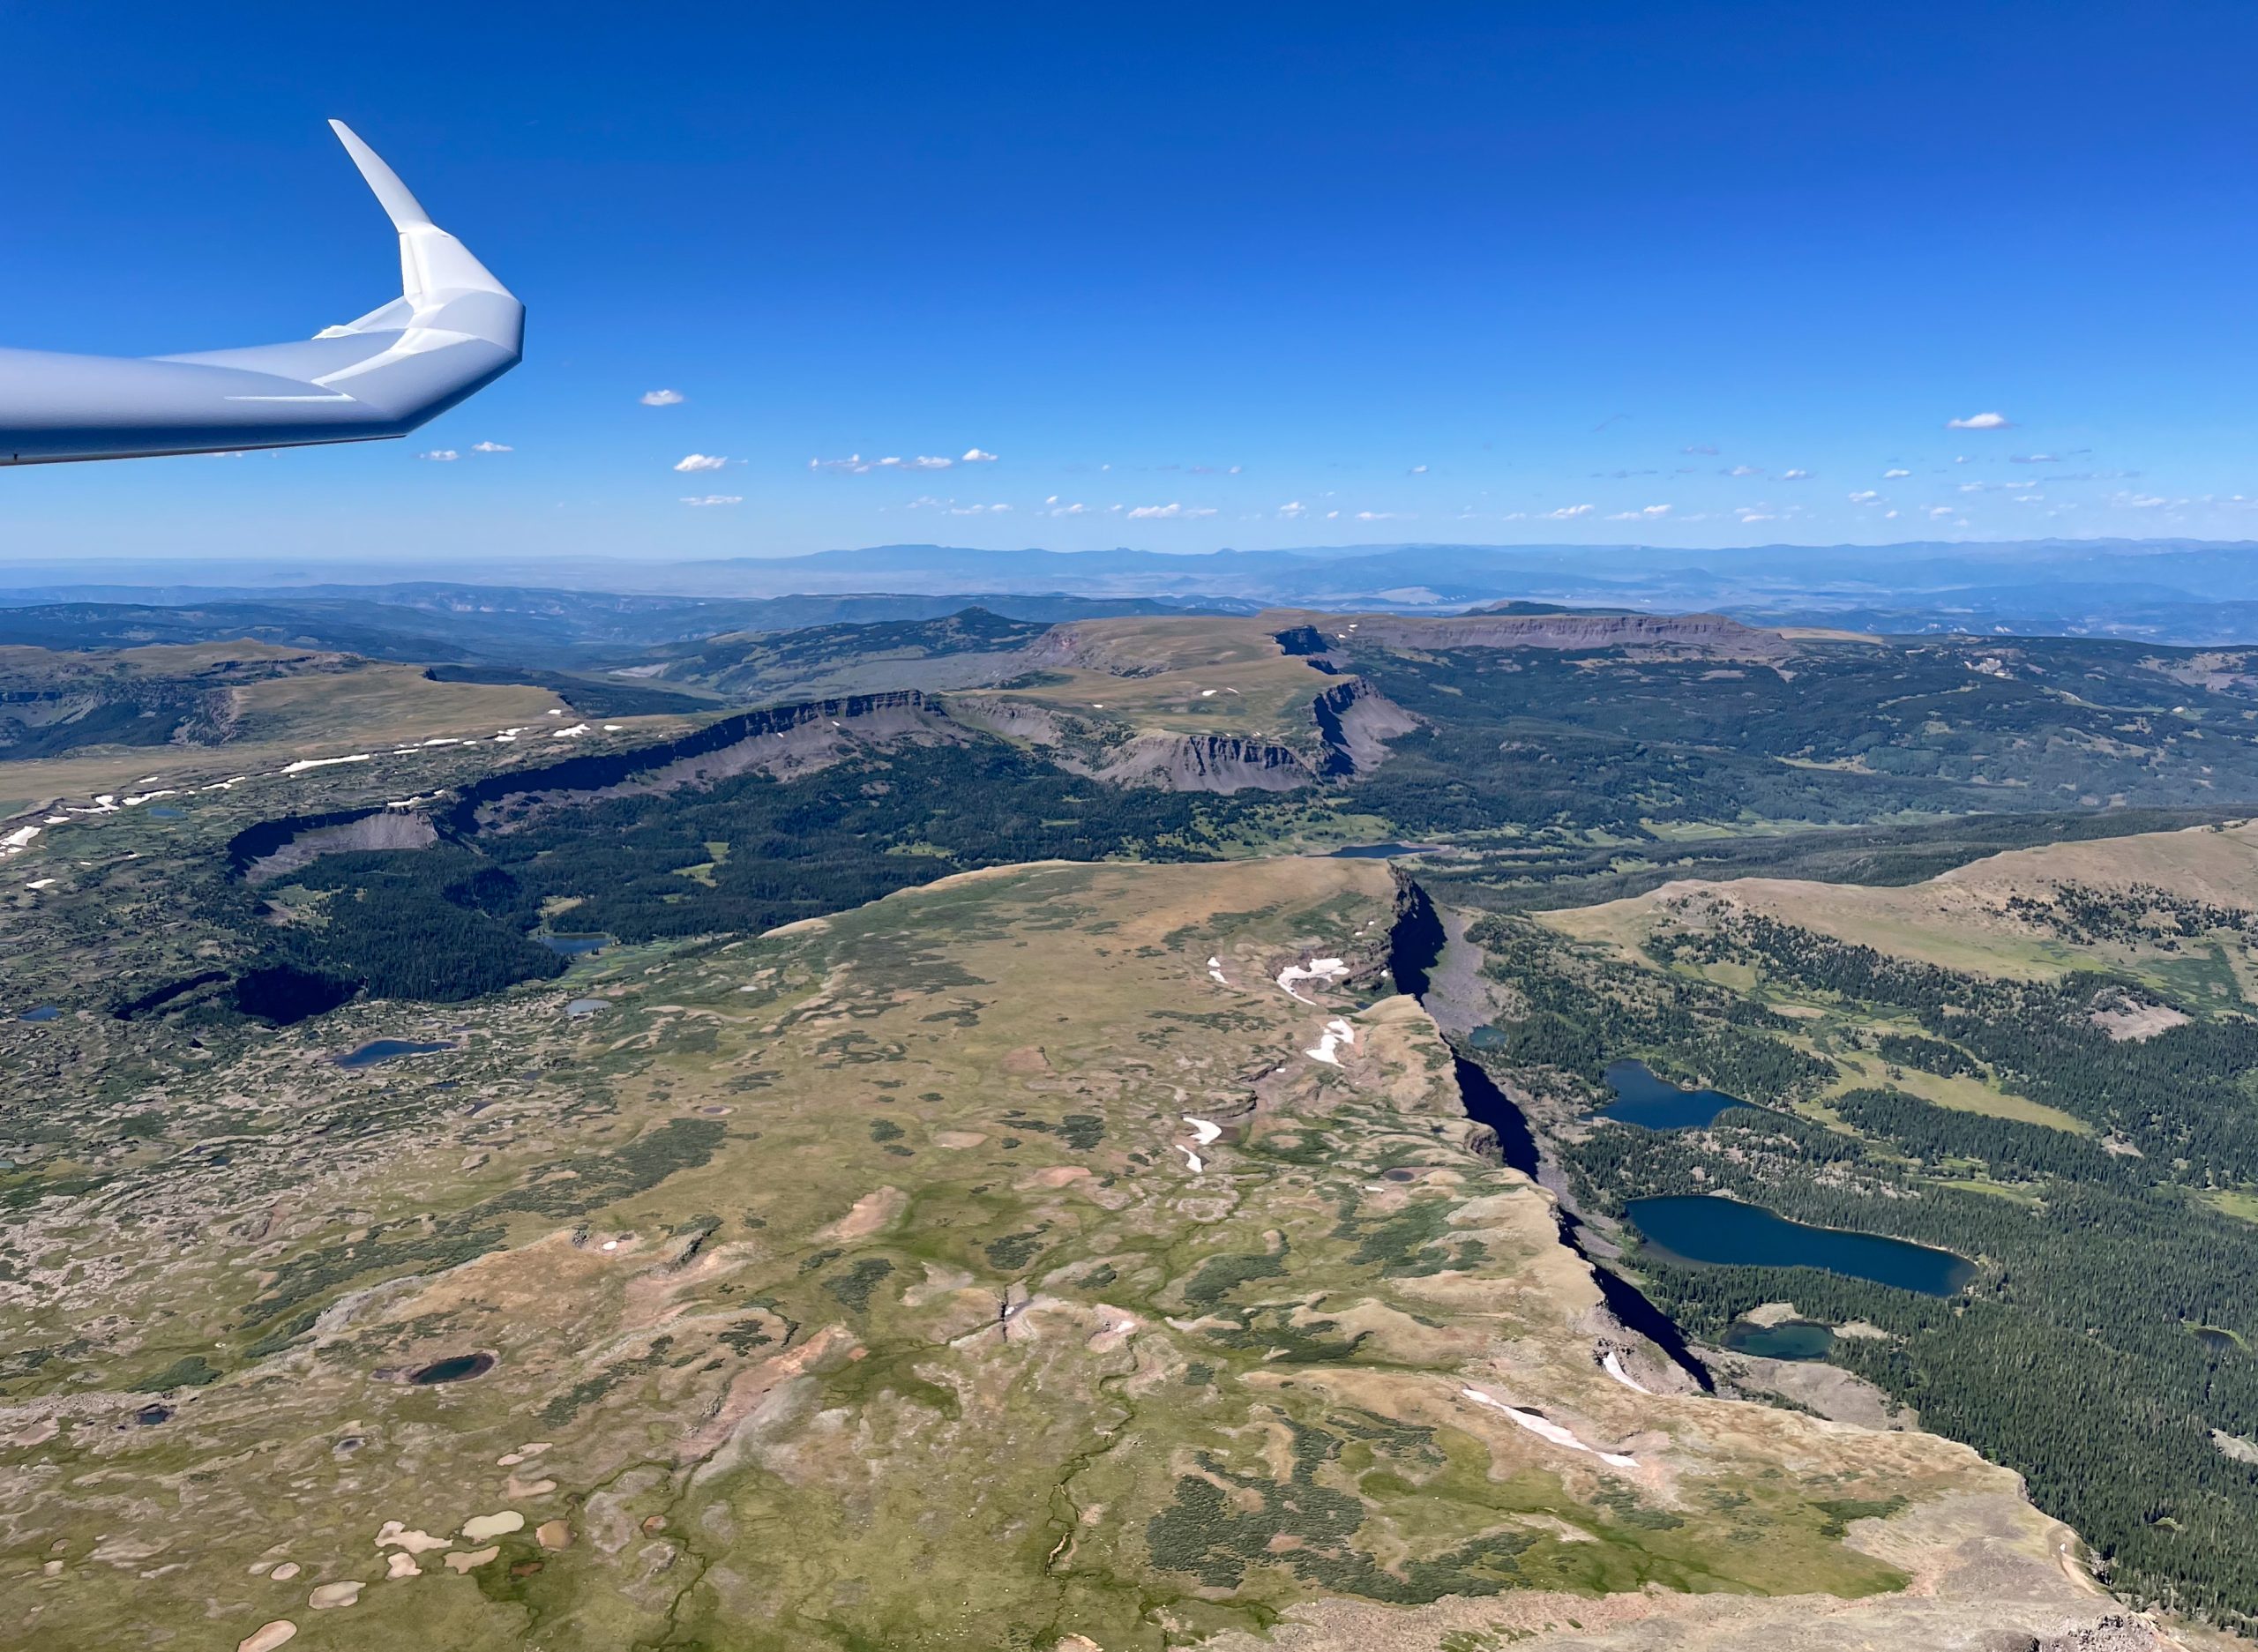
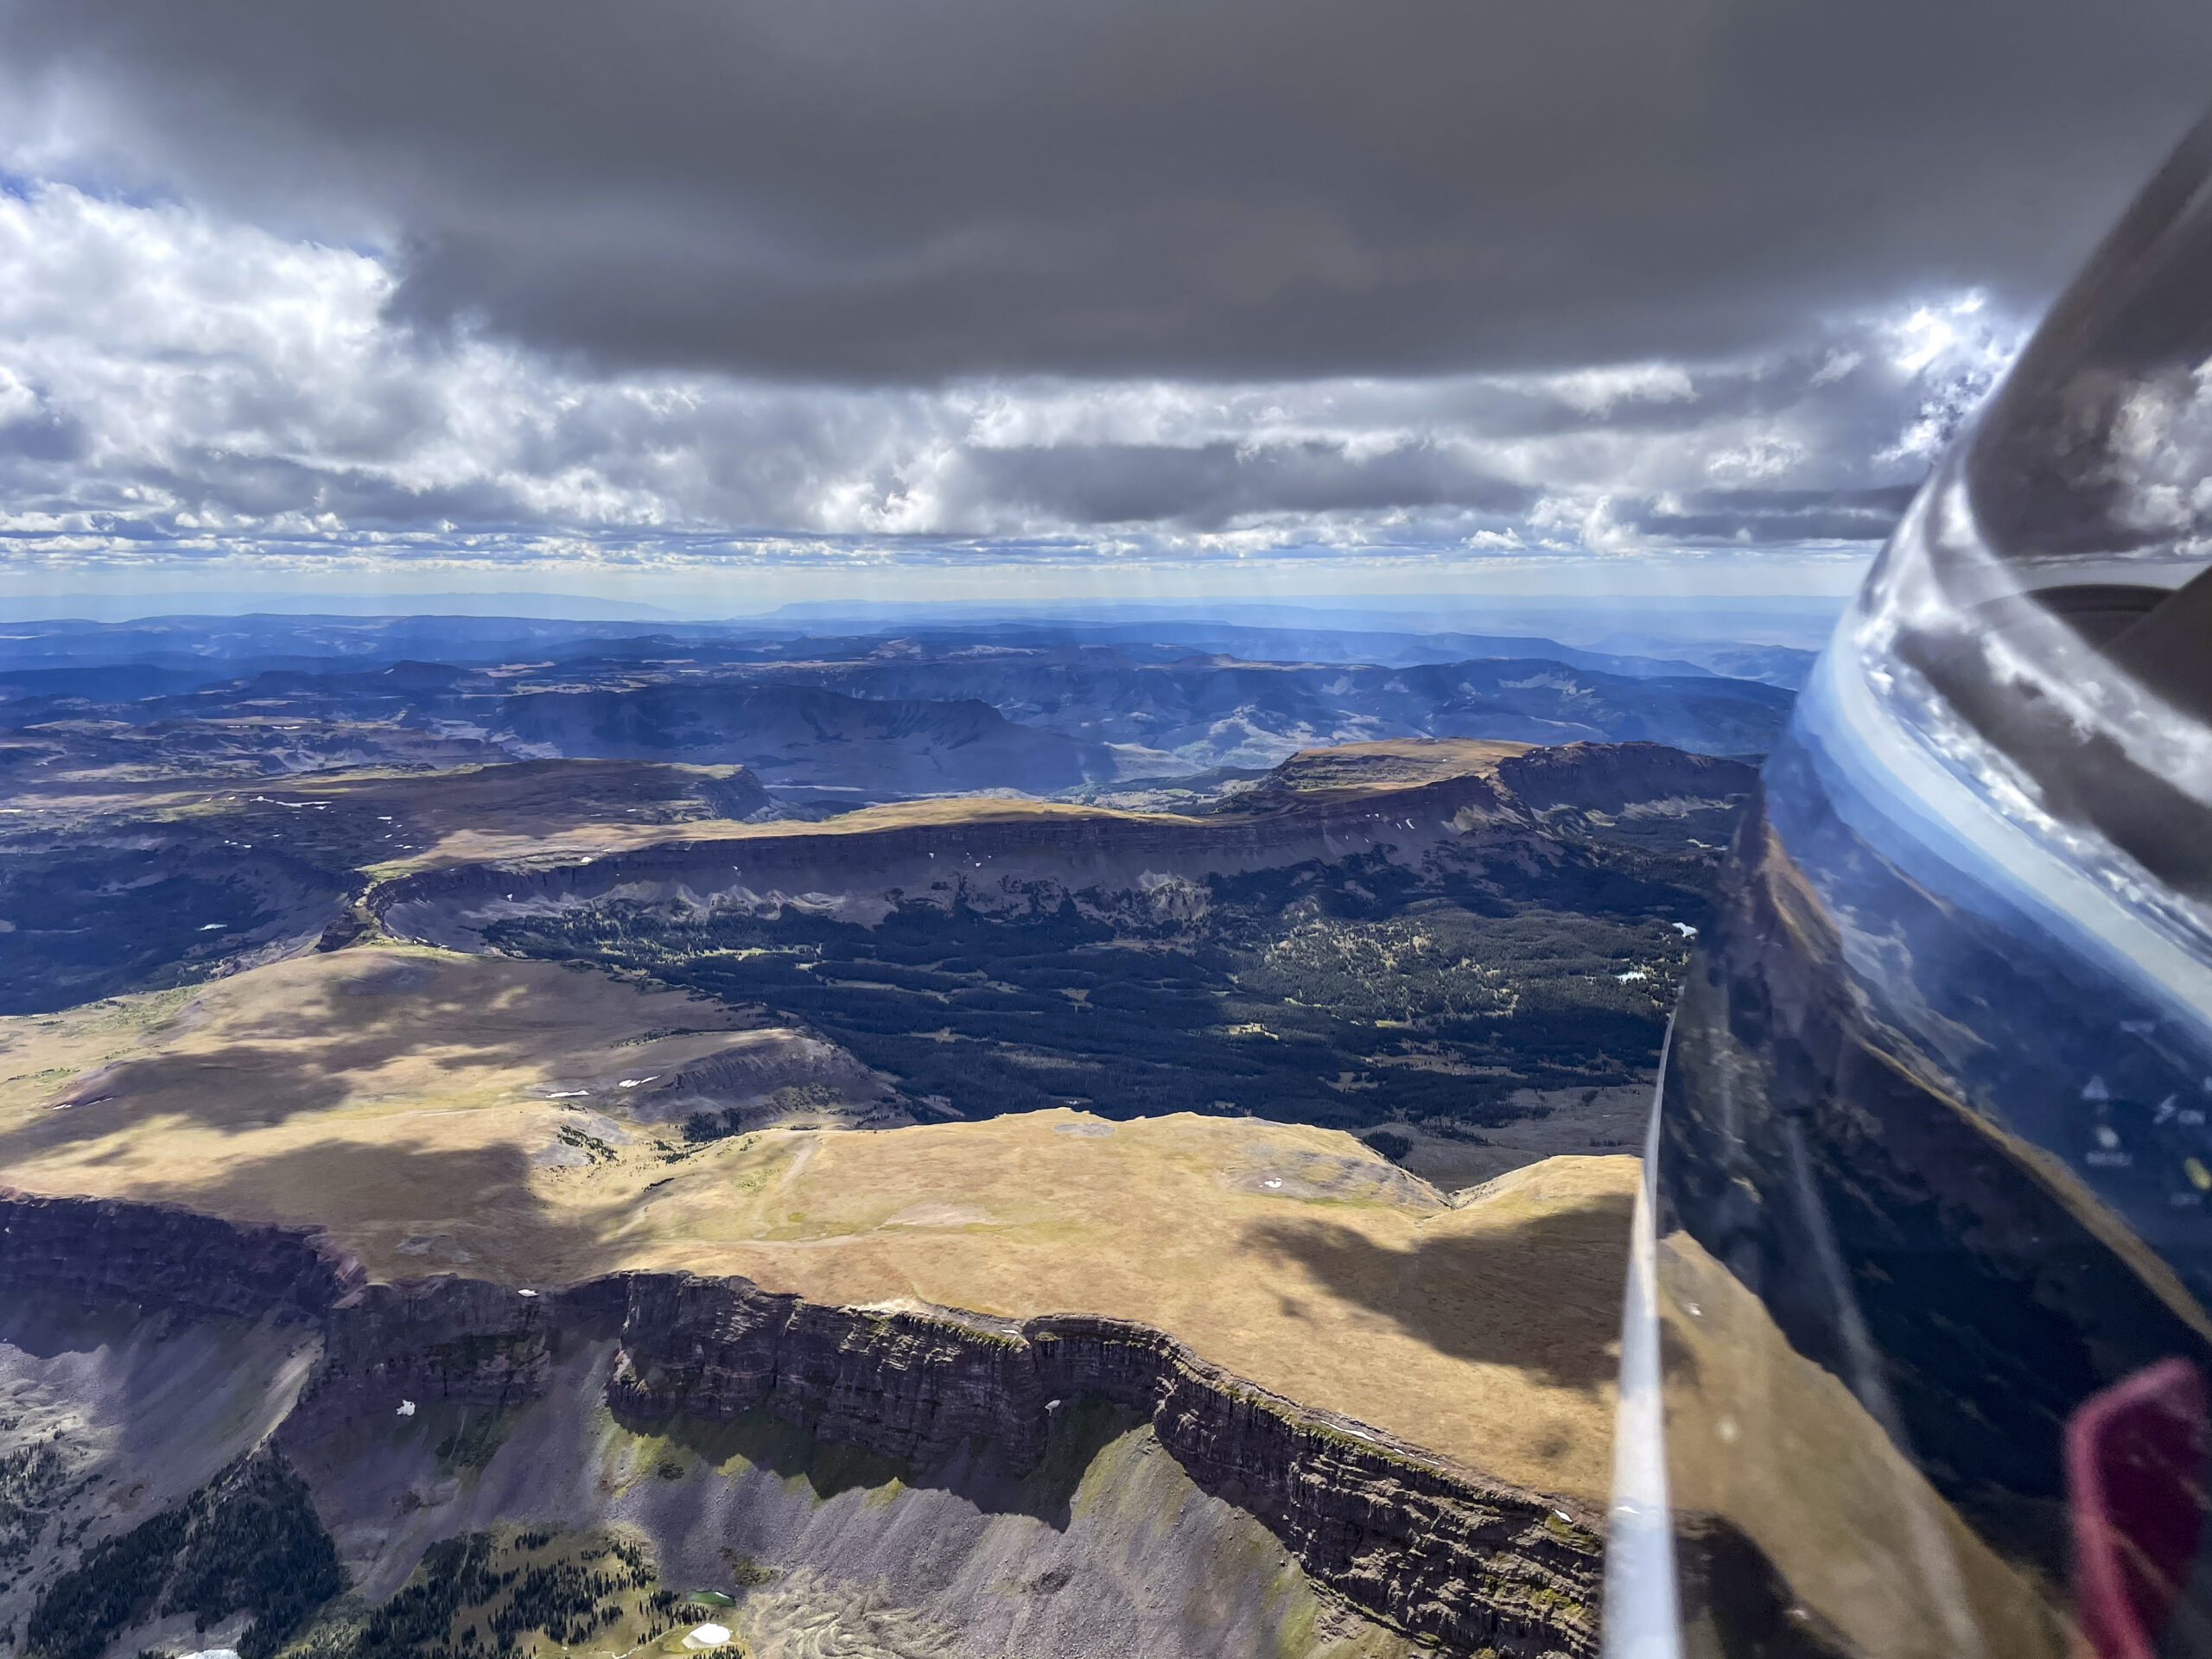
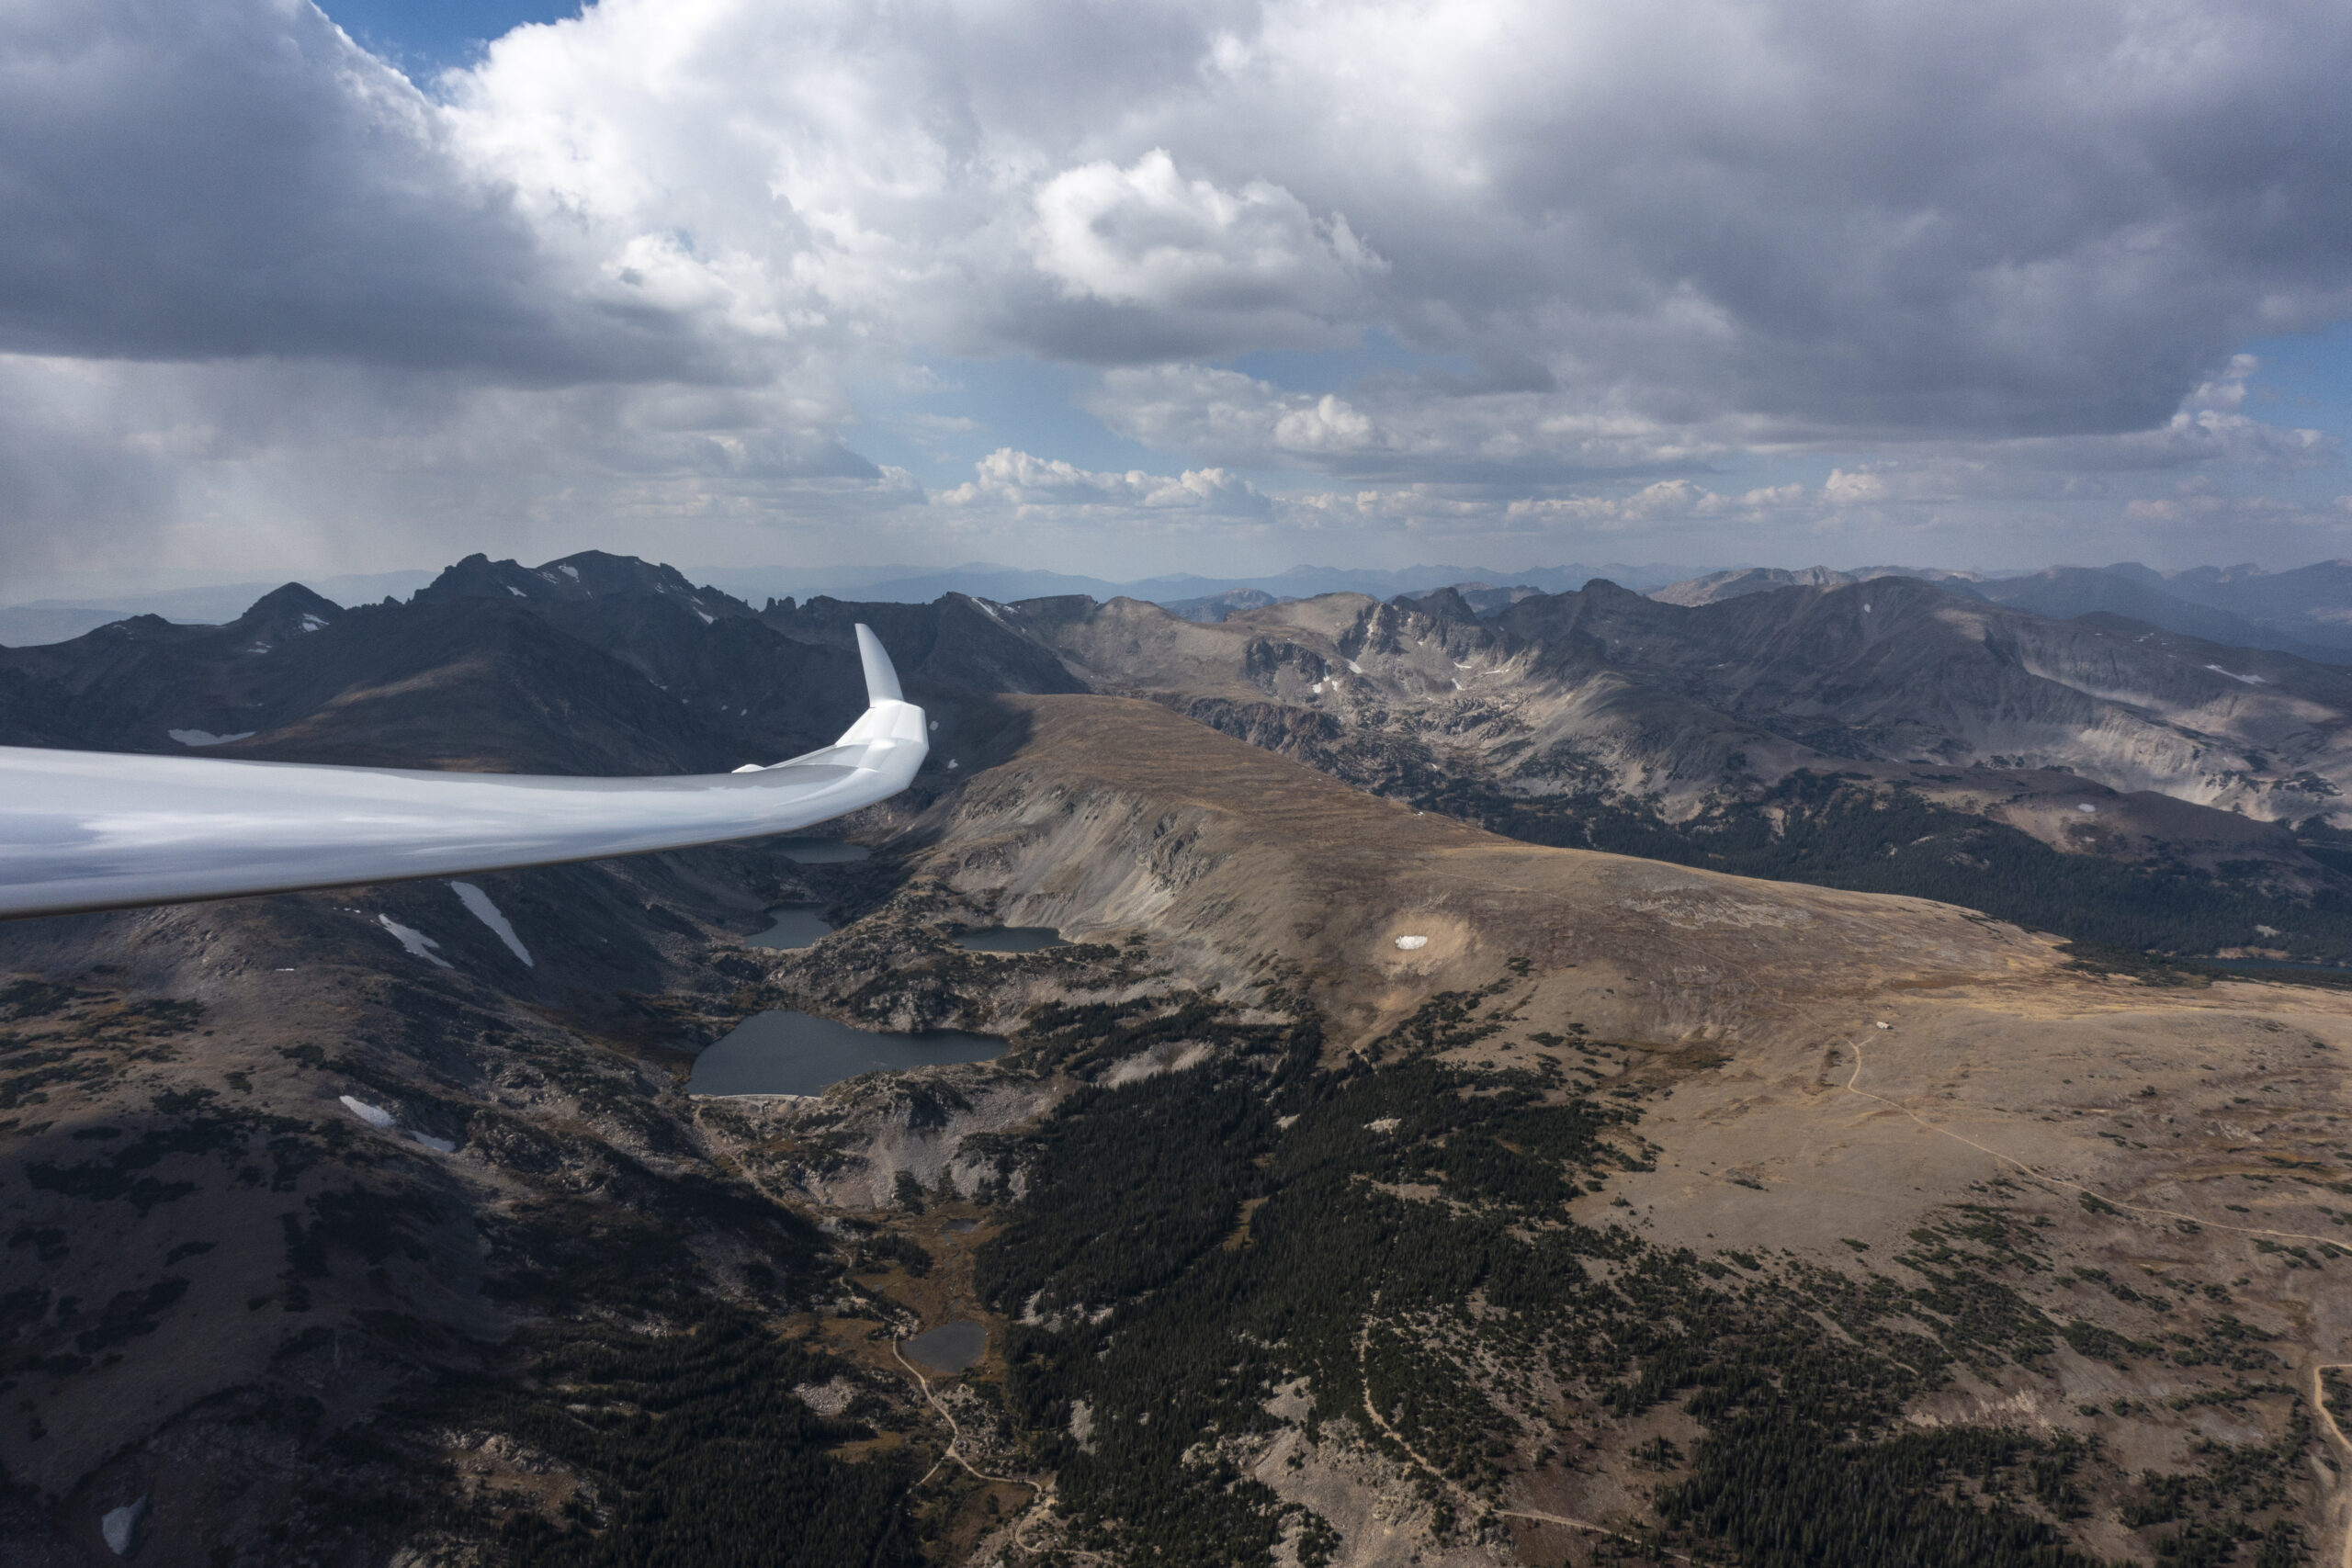
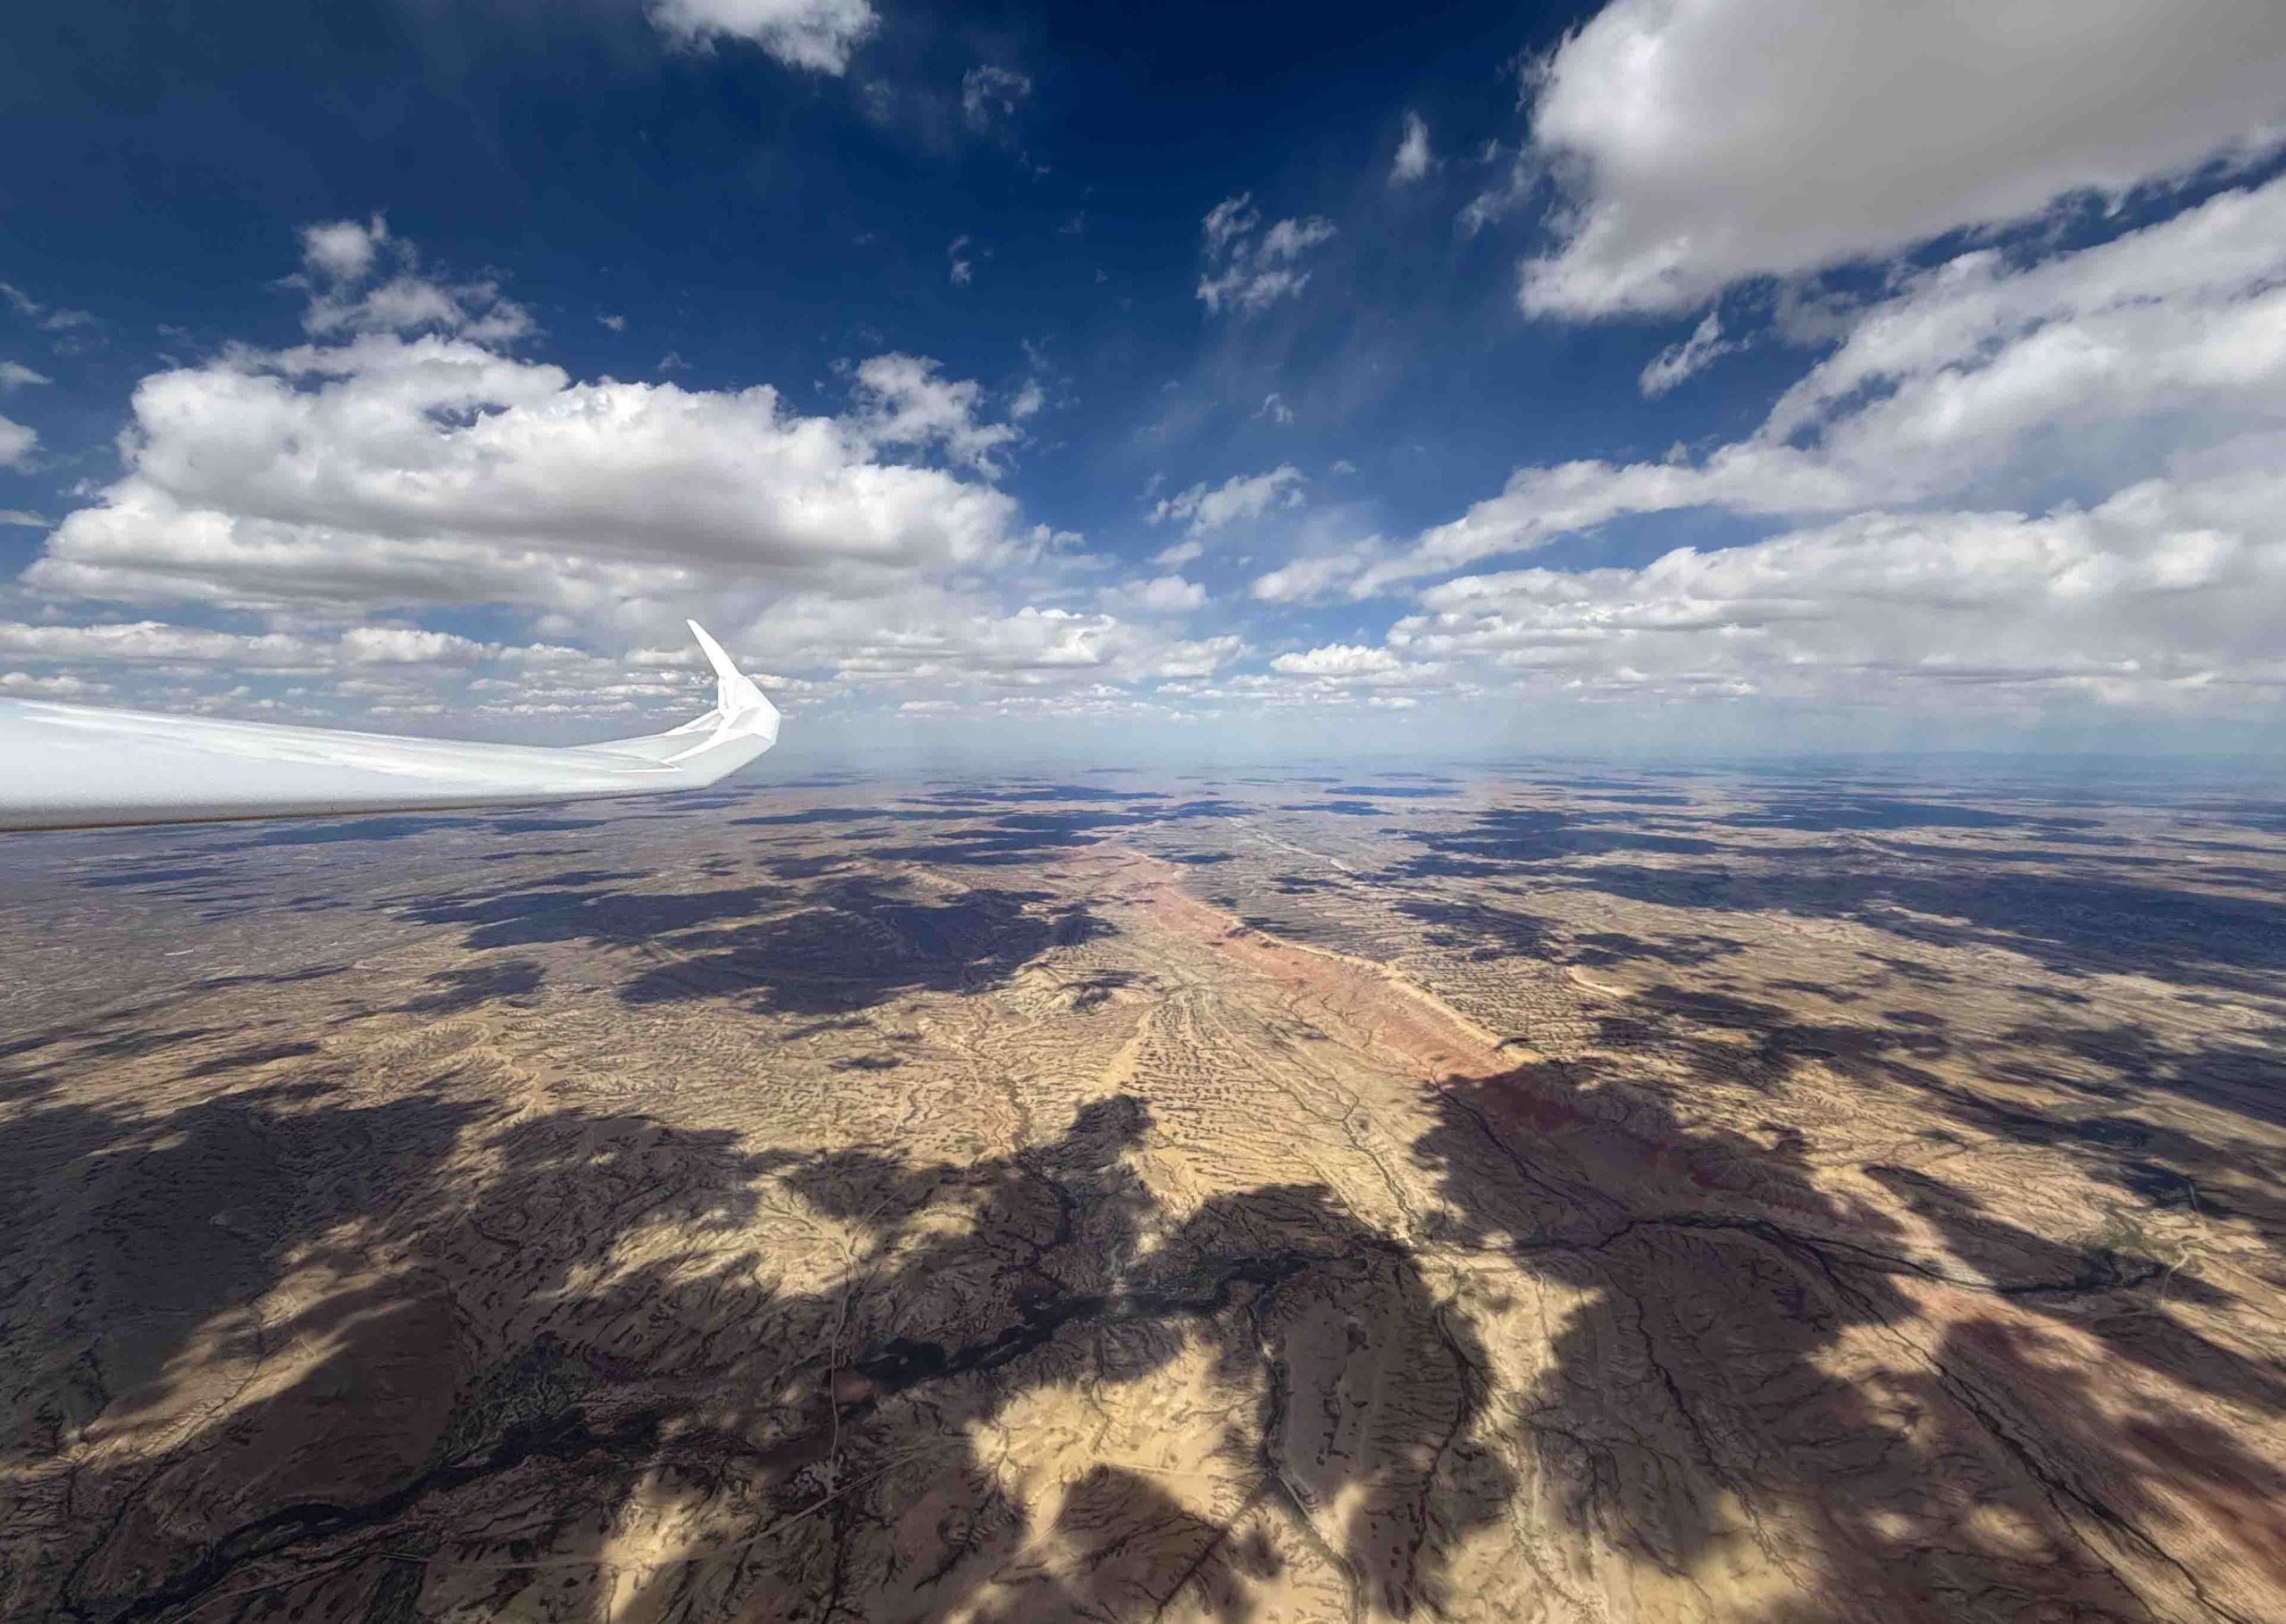
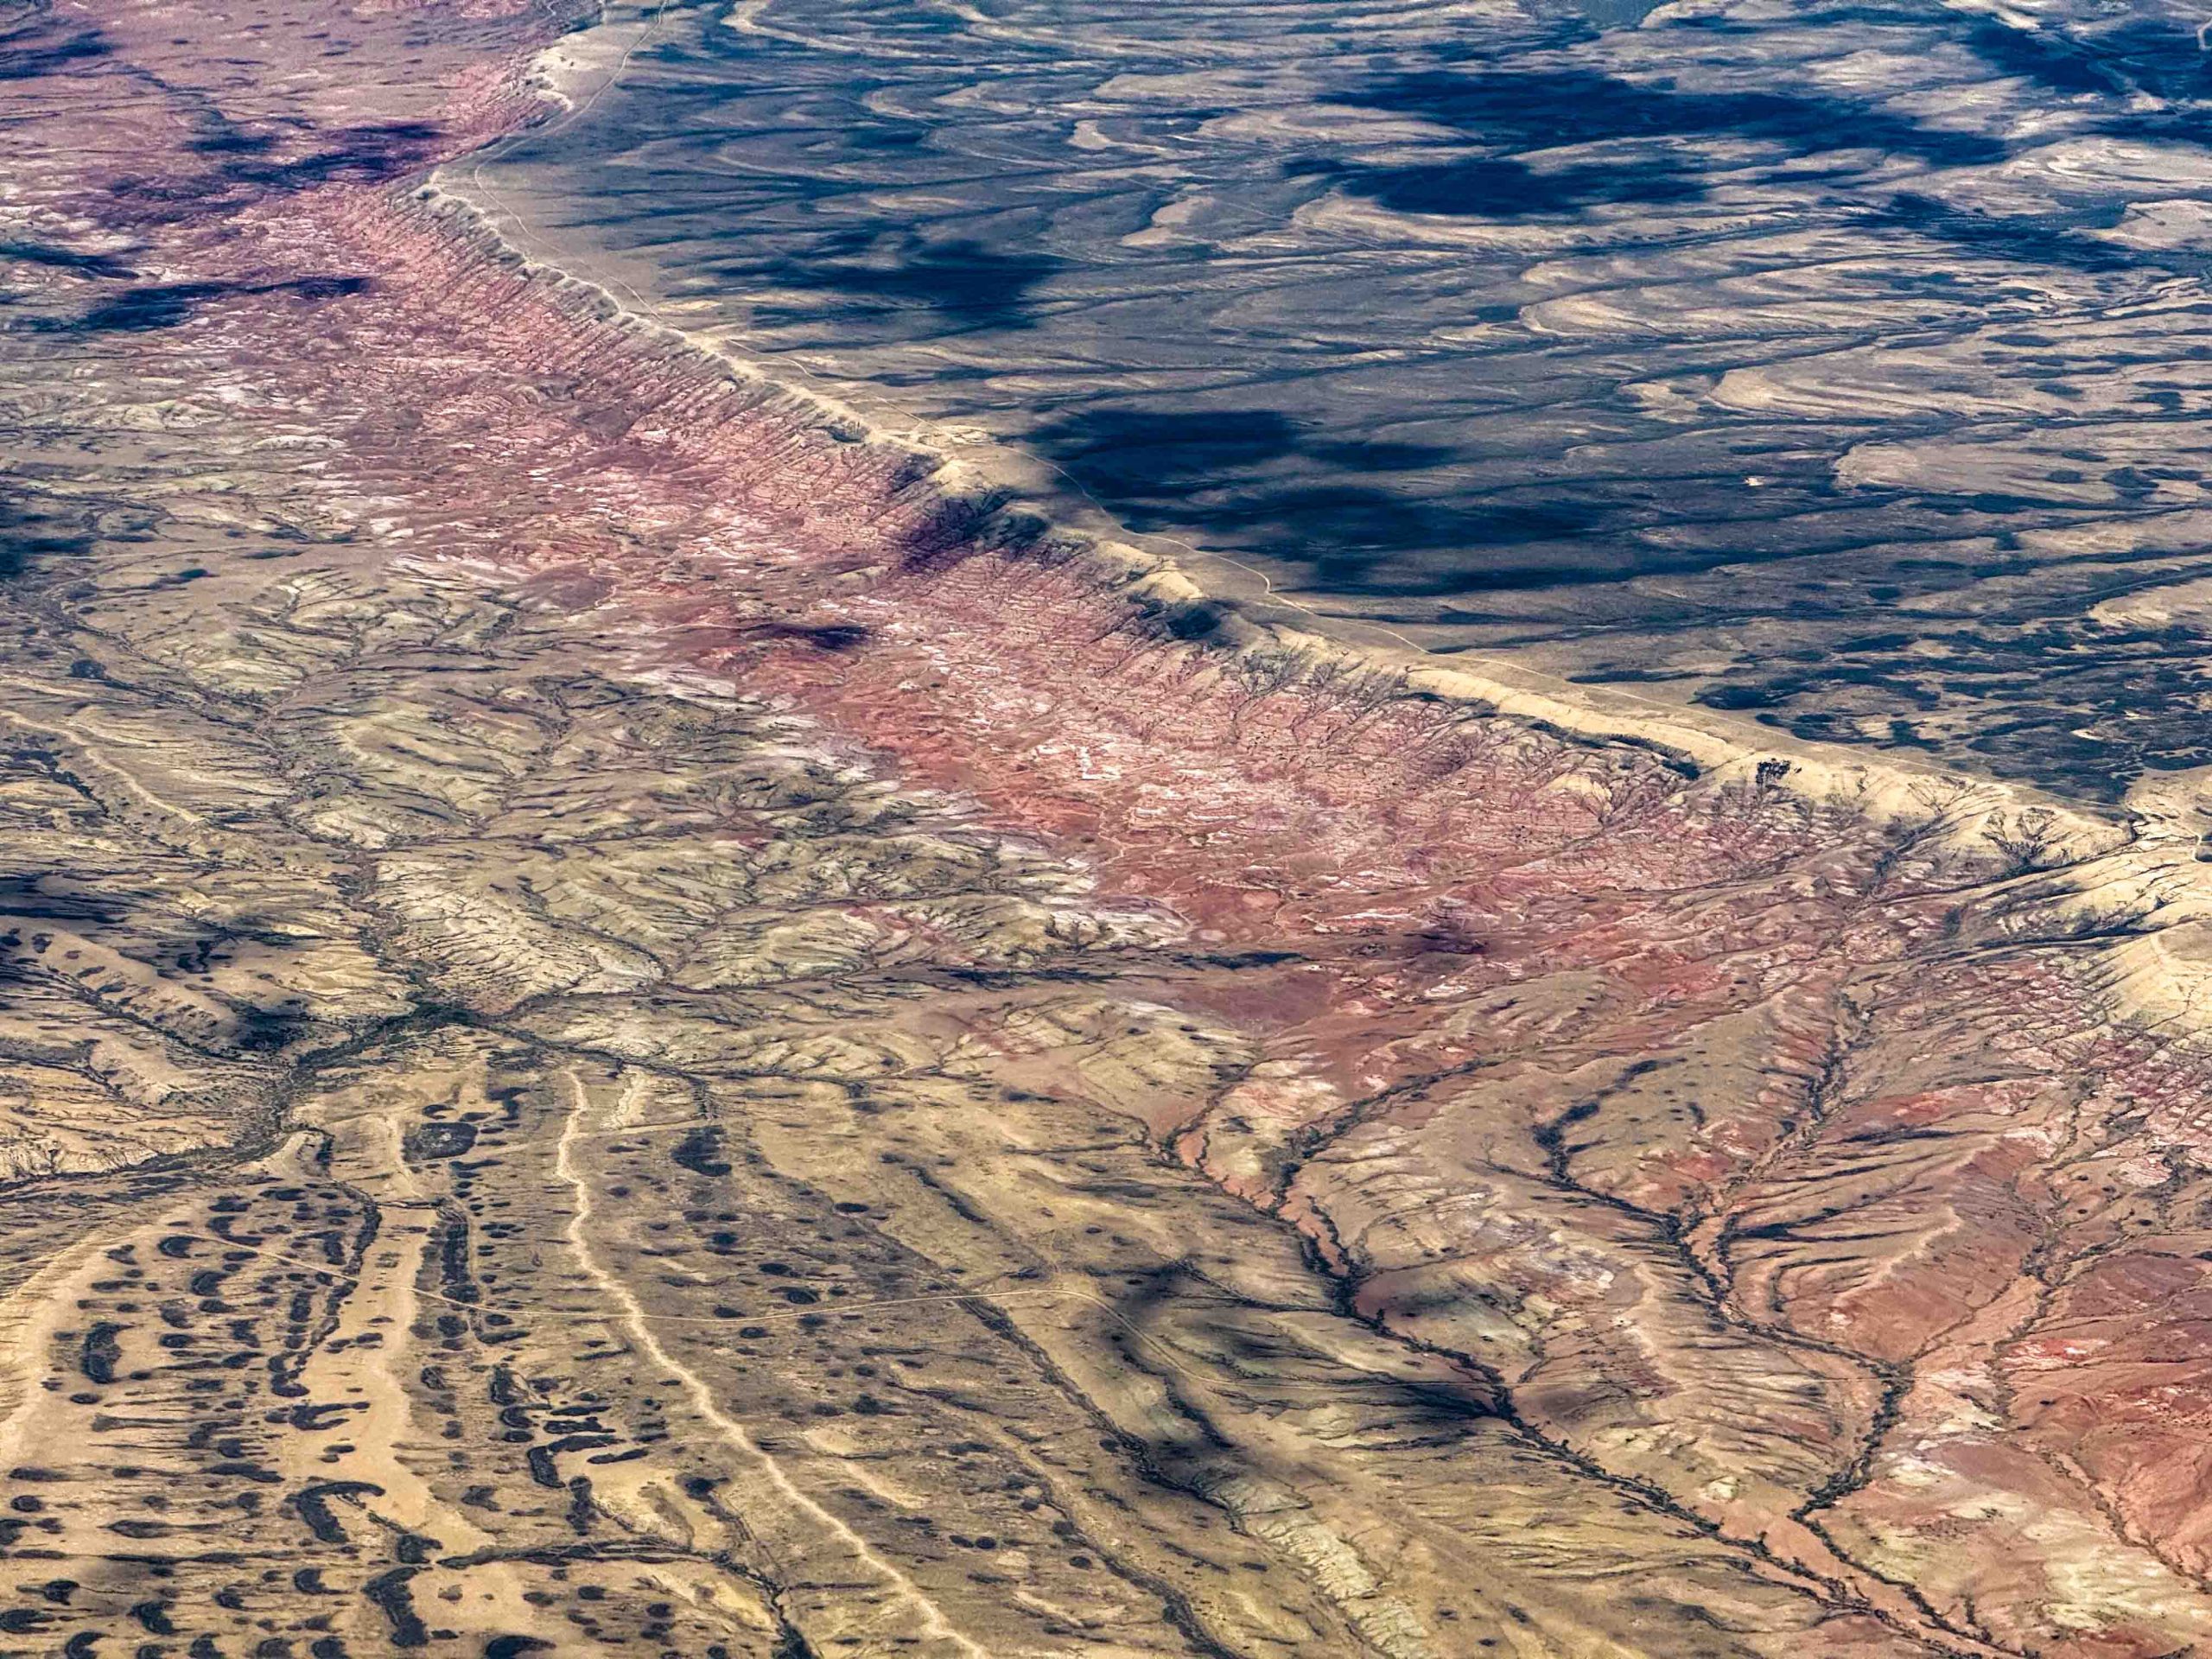
As I continued north, the clouds were well-formed and well-spaced (albeit with two or three blue holes in between), allowing me to also pay attention to the dramatic scenery below.

View of Dinosaur National Monument at the southeast flank of the Uinta Mountains. It’s so called because it exposes dinosaur fossils from the Jurassic Period, 150 million years ago. (No, I did not see any Dinosaurs on this flight, not even Pterodactyls).

Considering the wild landscape, I also had to keep landable airports in mind. After Mack Mesa, I considered Meeker to the northeast, than Rangely to the north-west. North of the Uintas, Dutch John was my best option until SW Wyoming Regional came in glide.  Having planned the task around this airport avoided a lot of potential stress.  But generally things were going well and thoughts of landing out were just a theoretical concern, rather than a real, practical worry.

As I approached the second turn point I noticed another one of the task planning parameters to come true: the wind (which had been light out of the southwest) started to pick up and became increasingly westerly.  I was excited about that as it promised the hoped-for tailwind on the last leg.  As the wind increased I paid close attention in the thermals. Fortunately I did not notice any centering problems or a degradation in thermal strength – a potential consequence of the increasing wind.

Leg 3

It was 3:40 PM when I reached my northern turn point, 20 minutes ahead of my targeted schedule and 35 min before my cut off time of 4:15 PM.  It was an exciting moment.  The sky ahead look fantastic, even better than on Leg 2.  The wind was now solidly at my tail and – even better – it helped arrange the lift lines in the direction of the wind: two or three nice cloud streets were beckoning in my general direction and it was just a question of which one to follow. I had another 360km to go and had to suppress the sense that it was already time to celebrate success.

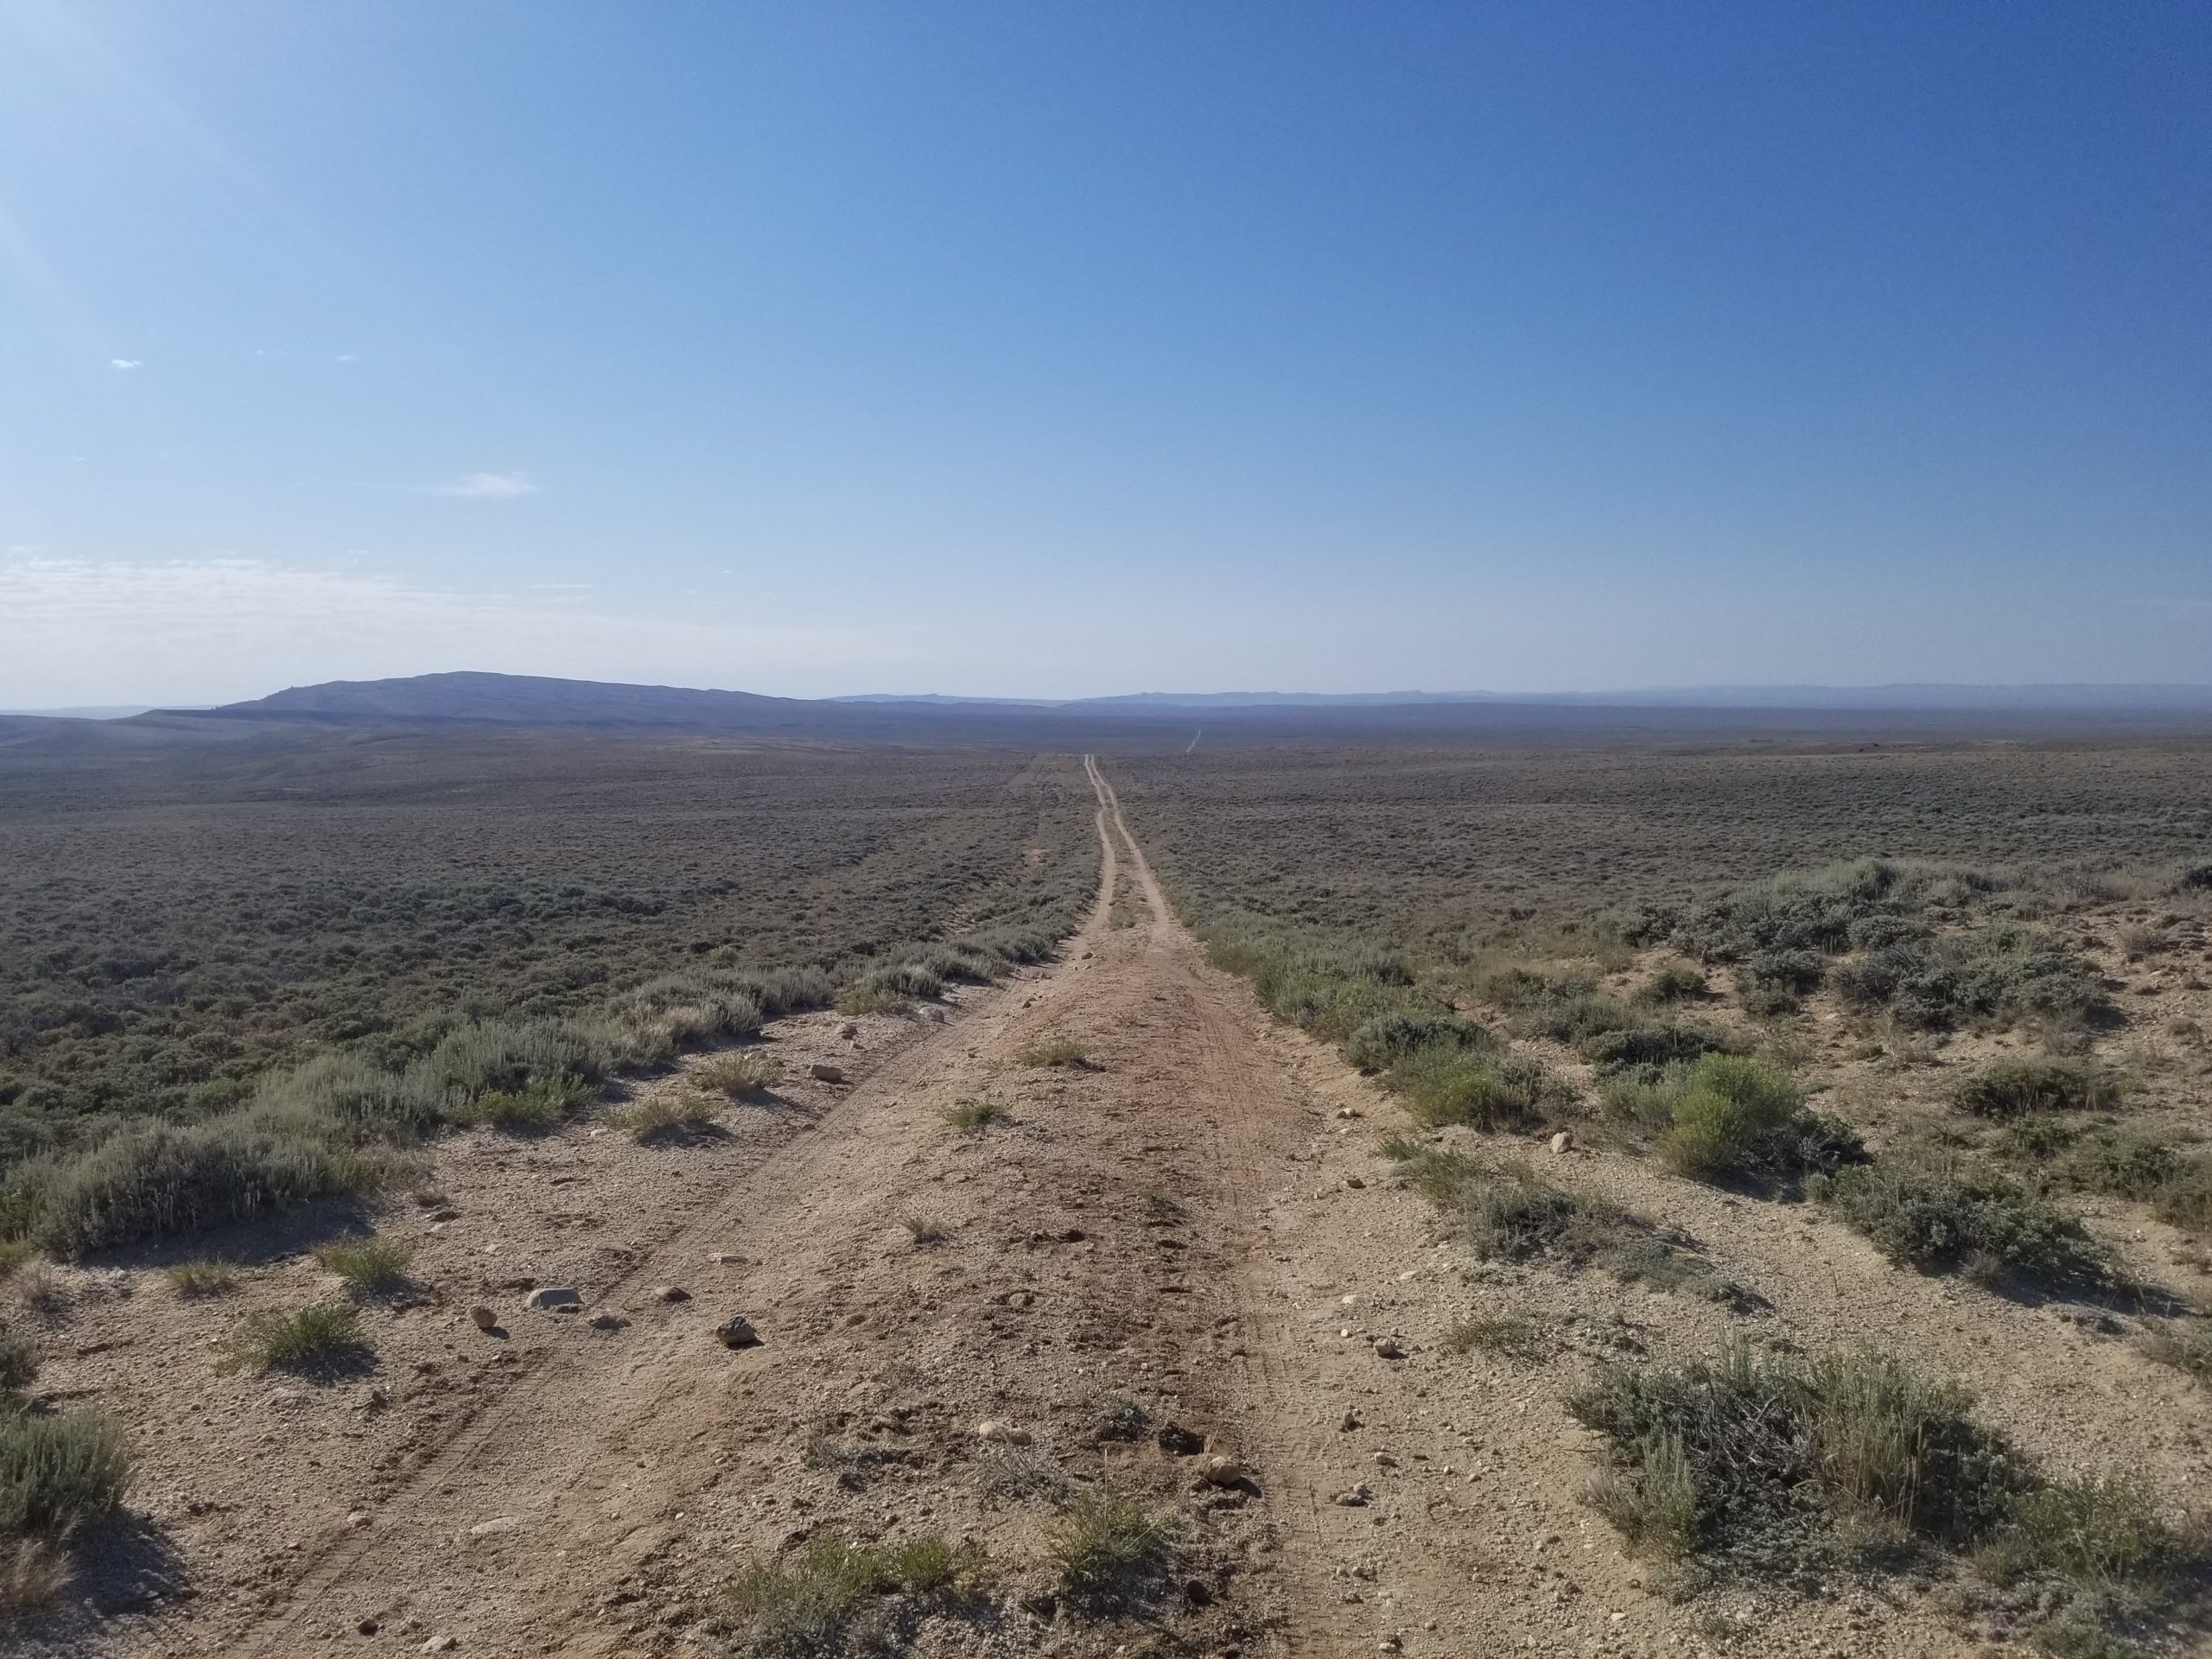
Then, for a minute or two I could not make up my mind and found myself wavering between two lift lines, which caused a drop in altitude to 13,700 ft.  This caught my attention because the next 90 miles were without any possible place to land.  I was also quickly getting out of glide from SW Wyoming Regional (getting there would require backtracking into the wind).  This made me determined to take the next climb, even if it was weak.

The next cloud worked and within 5 minutes I was back at 16,000 ft.  The next airport, Dixon, was still 70 miles in the distance but I now wasn’t concerned at all: the line I picked worked great: from here until Dixon I would only briefly stop twice to top up altitude. My ground speed on this stretch reached close to 200 kph.

“Alien planet” like scenery in south-western Wyoming between Rock Springs and Dixon.
This area seems completely untouched by human activity. For long stretches there was no street or any other sign of human presence to be seen.
What a great line of clouds to follow! Note that my altitude here is over 16,900 ft. I’d estimate that the bases of the clouds were between 22,000 and 23,000 ft. (Unfortunately we’re not allow to fly higher than 17,999 ft.).  There was a little bit of virga here and there but generally easy to avoid.
Beautiful cumuli and out-of-this world terrain – as far as the eye can see. The hills on the horizon are the Ferris Mountains – about 100 miles to the NNE.

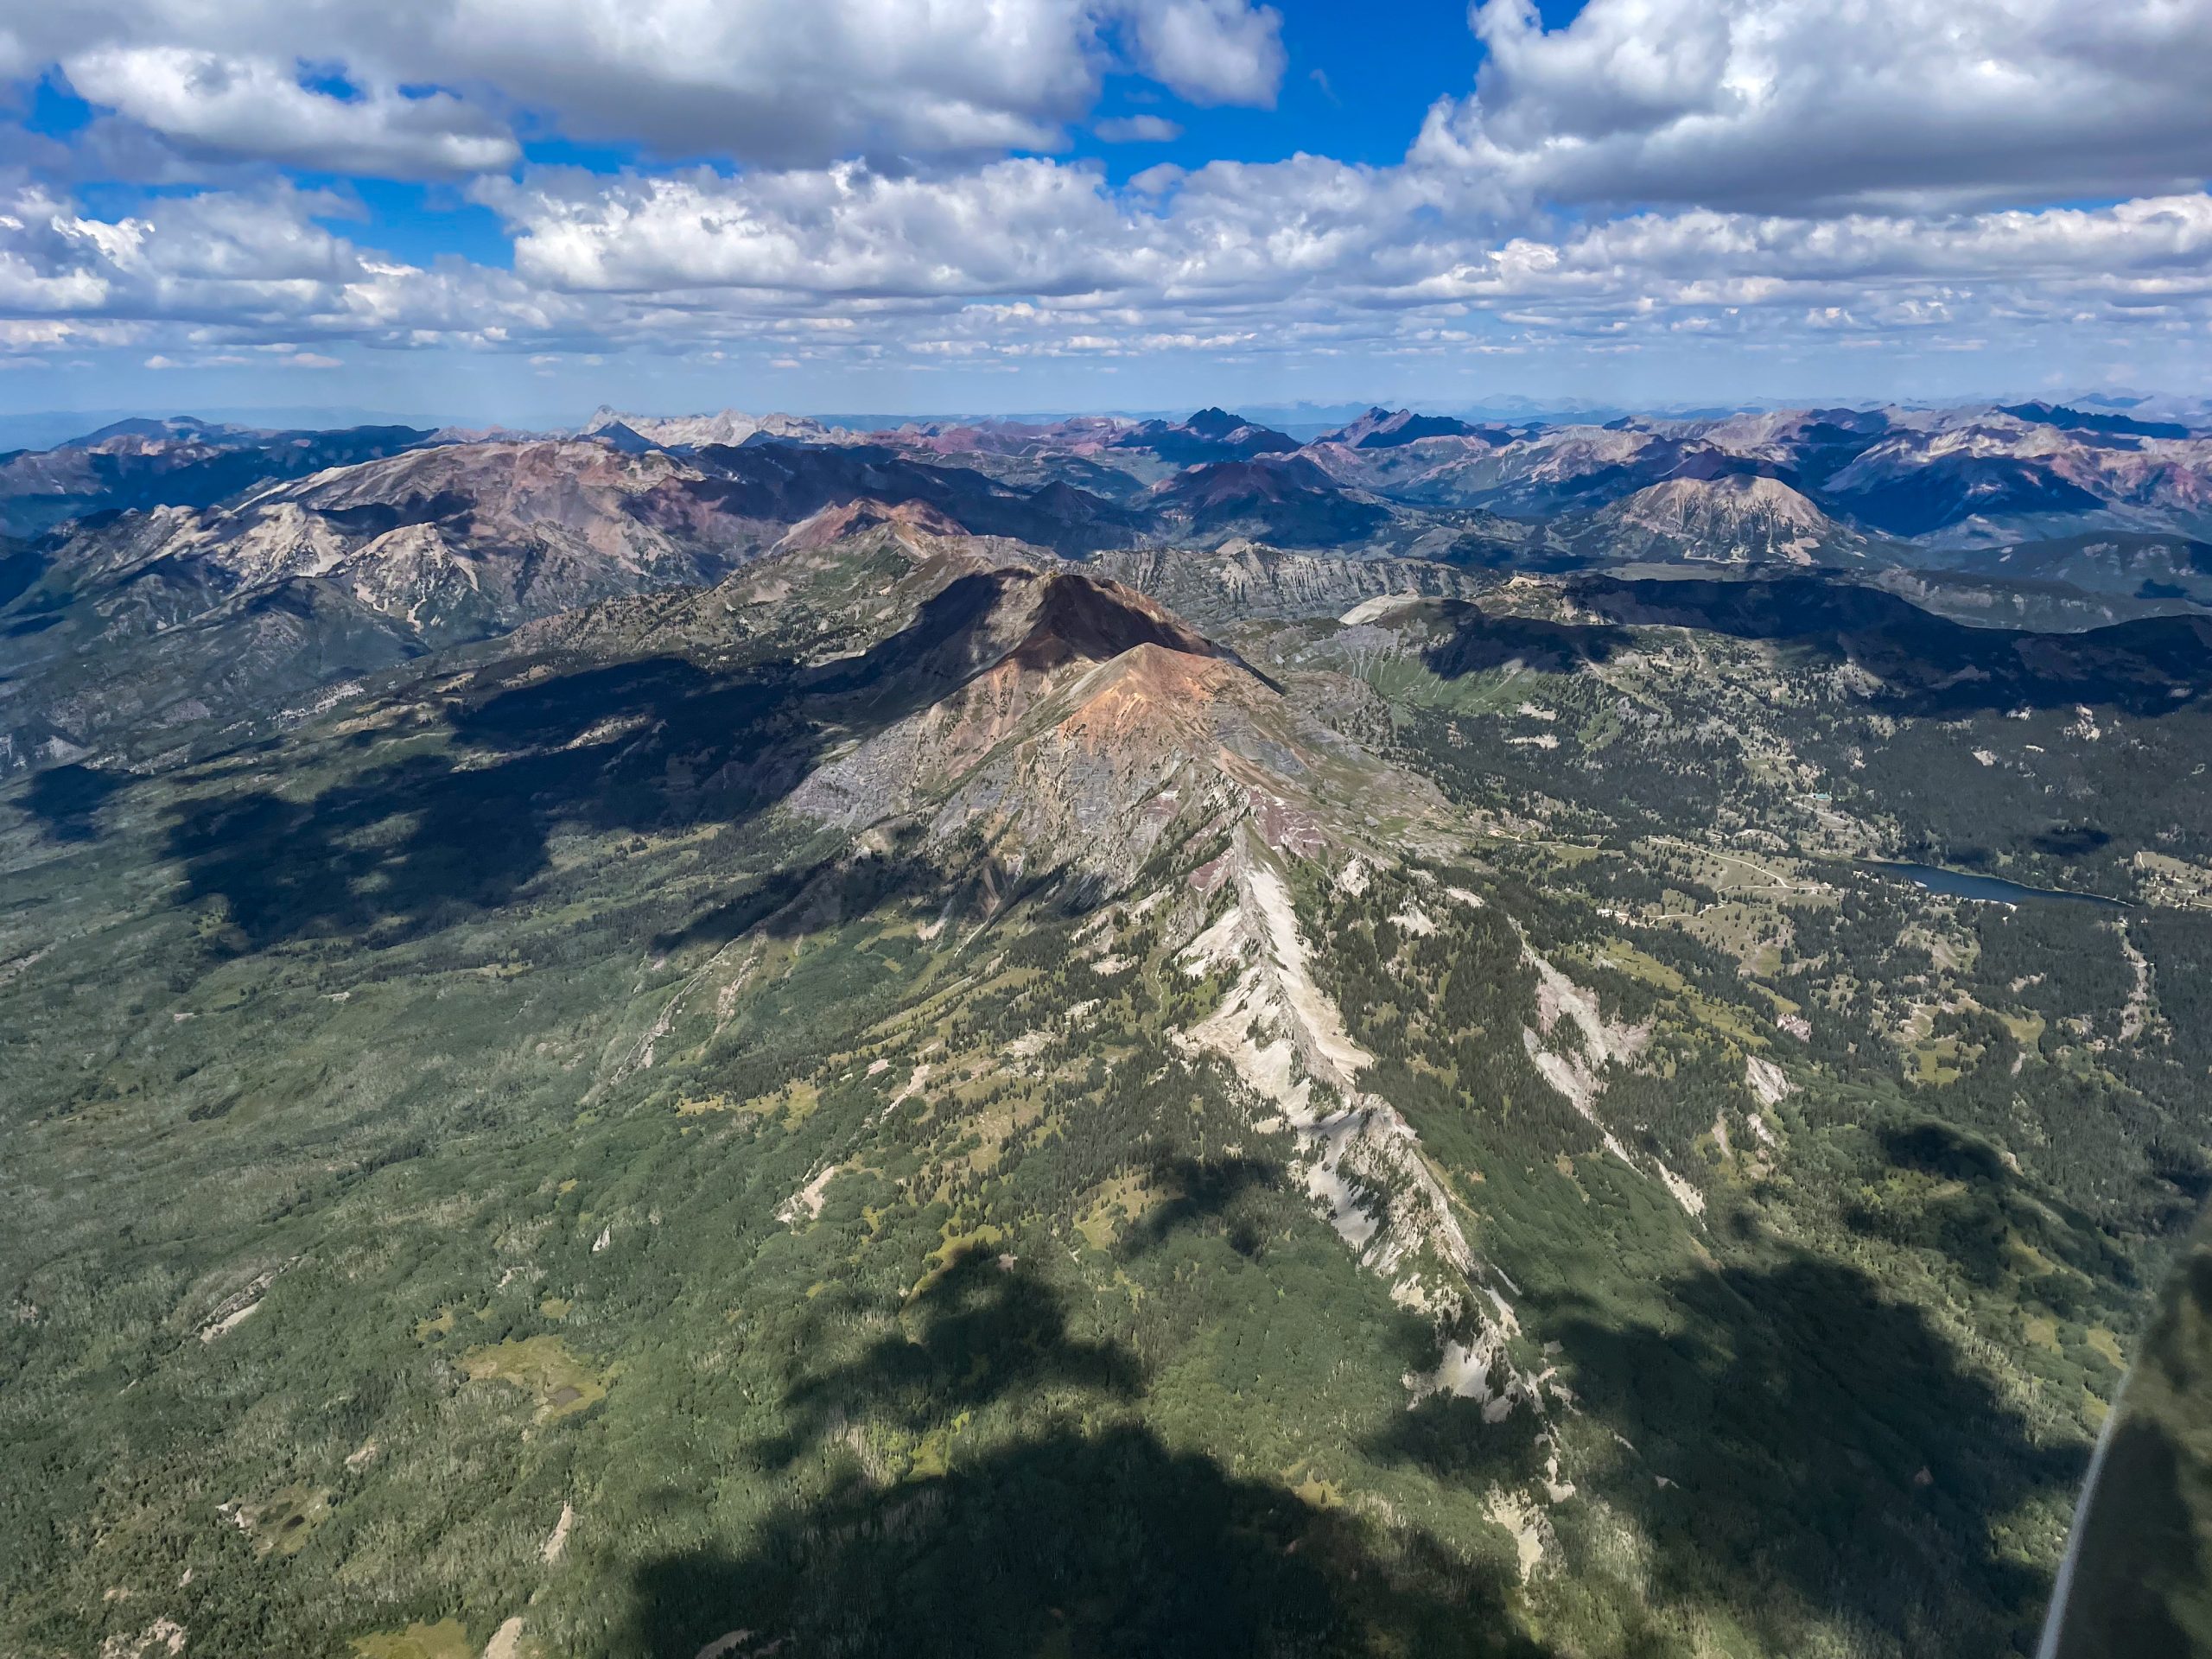
Not only the scenery, also the character of the flight changed when I passed Dixon and got back into Colorado.

Green verdant hills below and over-developed sky above Bridger Peak. The North Platte River Valley is behind.

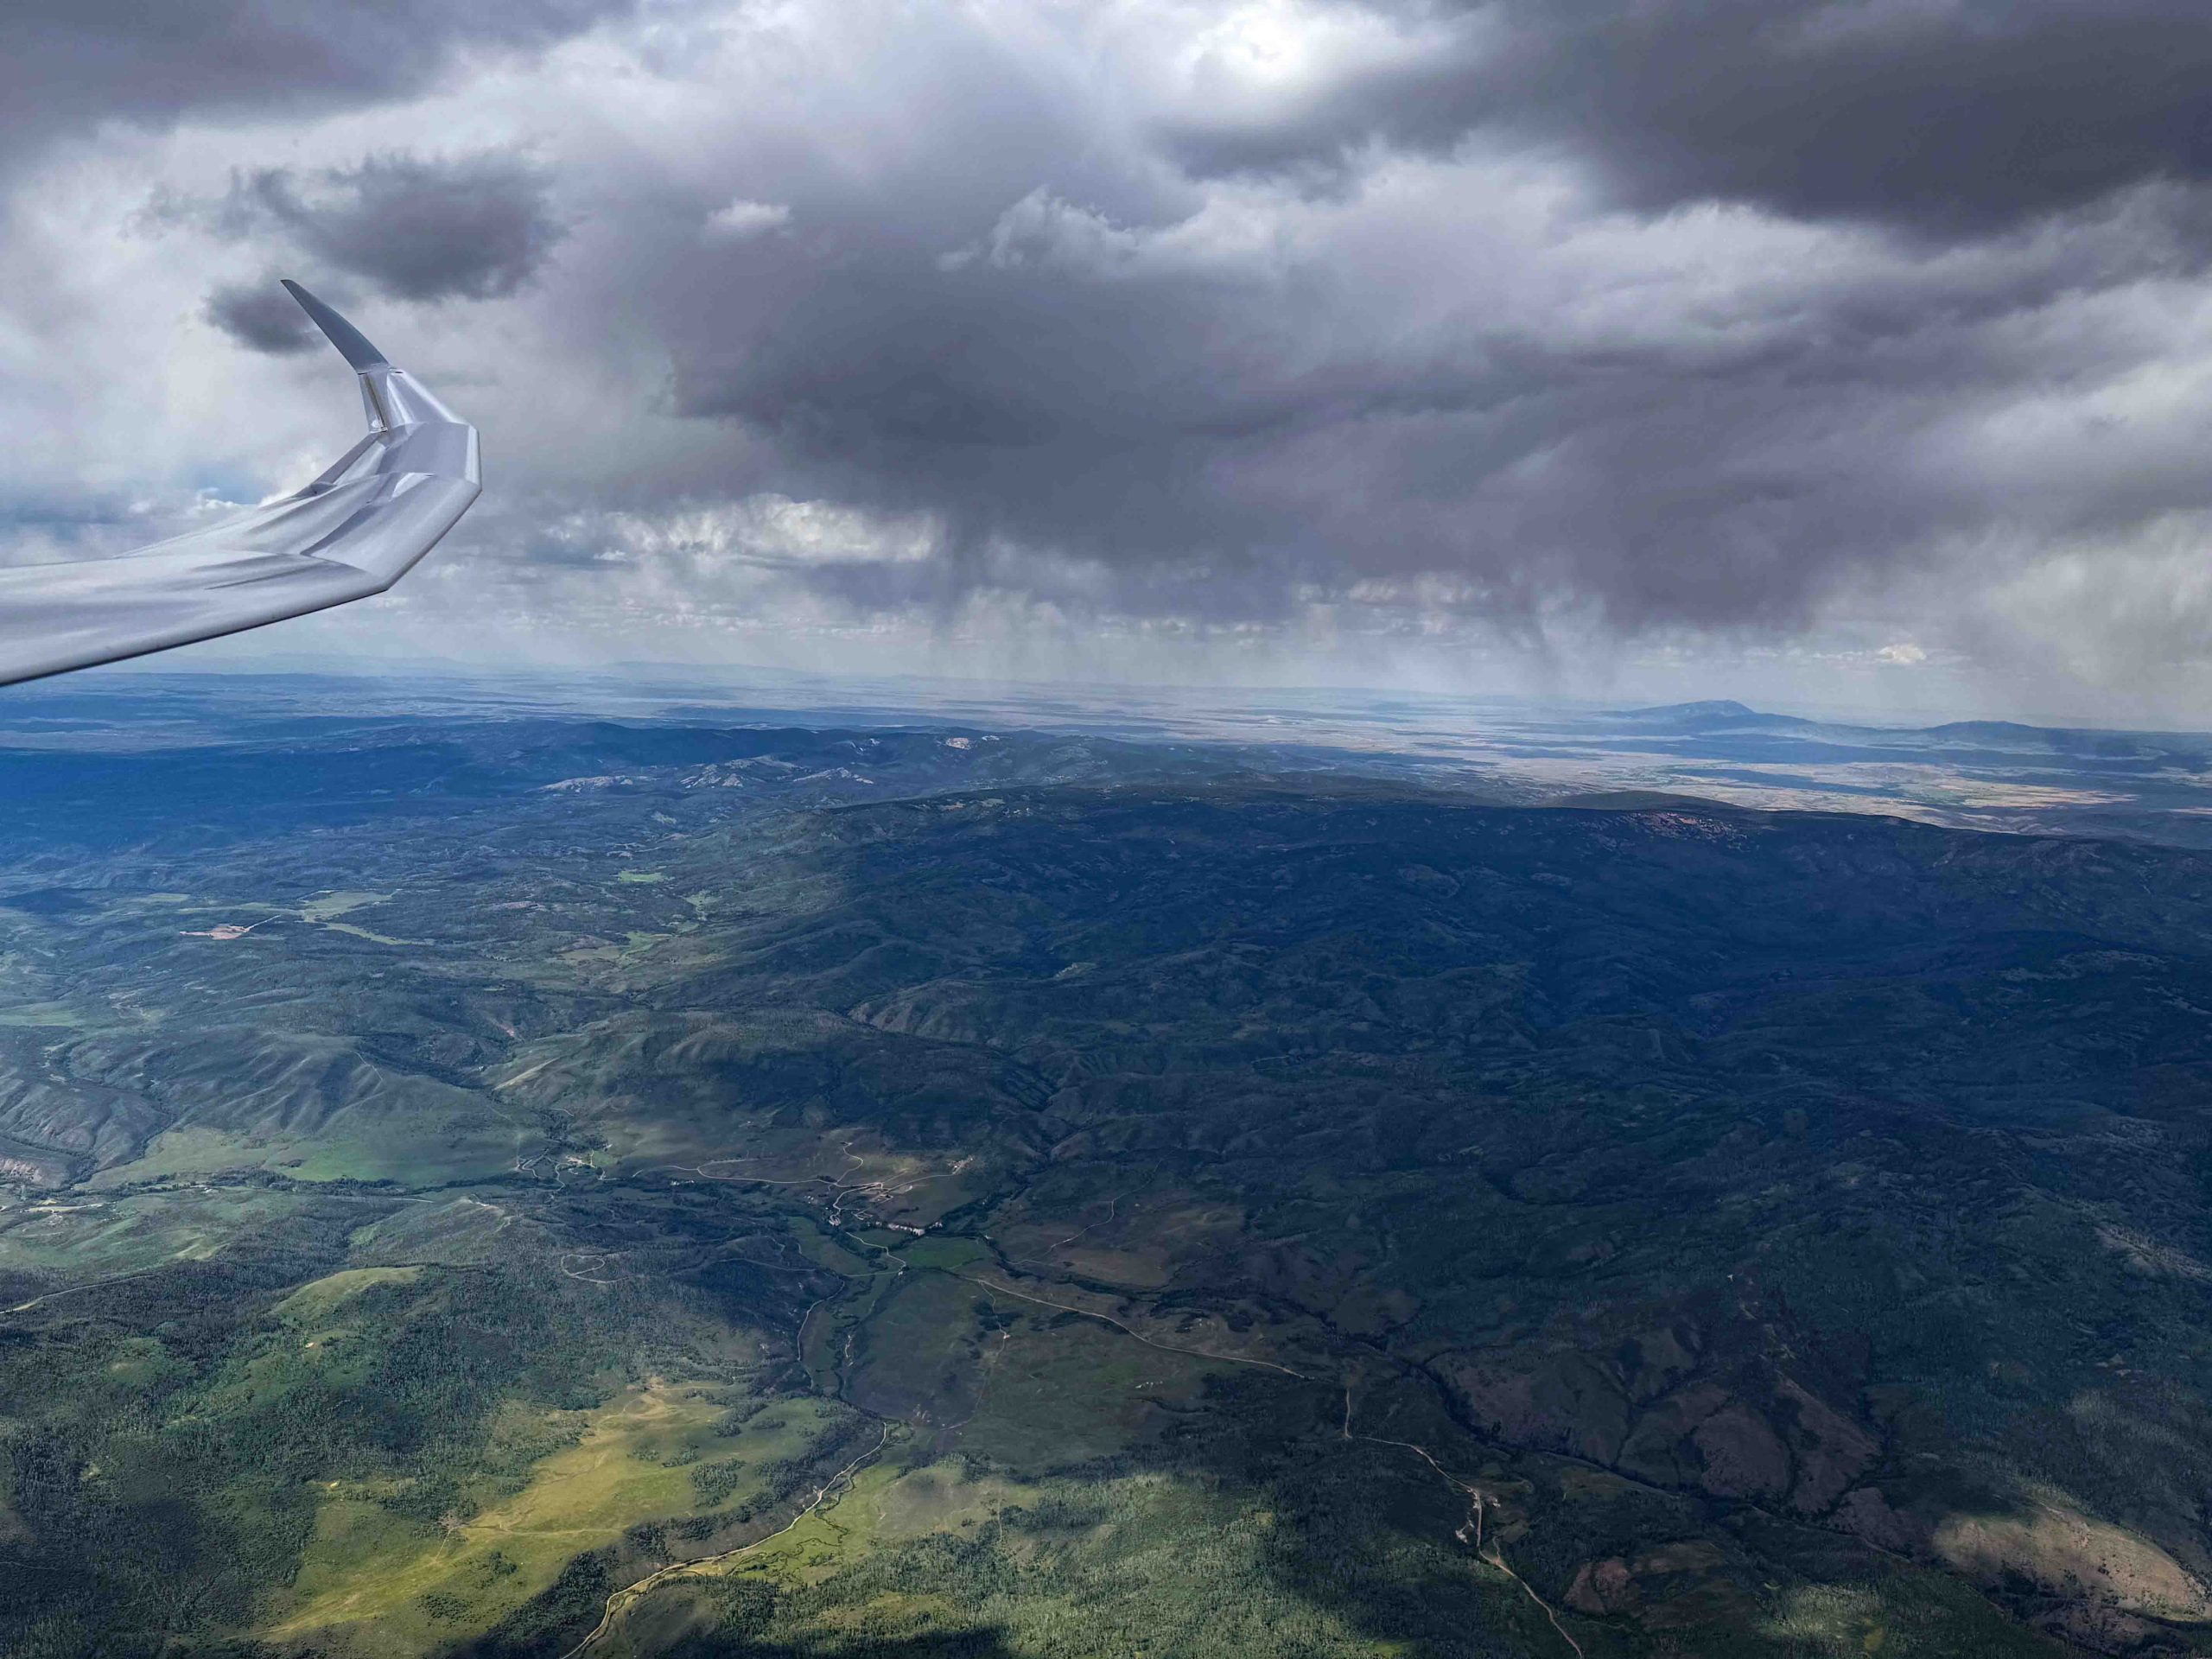
There was more overdevelopment over the mountains and more blue sky over the valleys.  This meant I had to pay more attention to picking the right lines.

View towards Steamboat Lake from the north. Steamboat Springs is in the distance. The Park Range is center left.

As I reached the Zirkel Mountains in the northern Park Range I had to make up my mind: the northern half of North Park was devoid of clouds.  Should I go around North Park or veer south-east and cut across? Showers over the Poudre and along the Northern Front Range made me opt for the southern route.

Zirkel Mountain is below. I decided to head towards the cloud at the left edge of the picture.

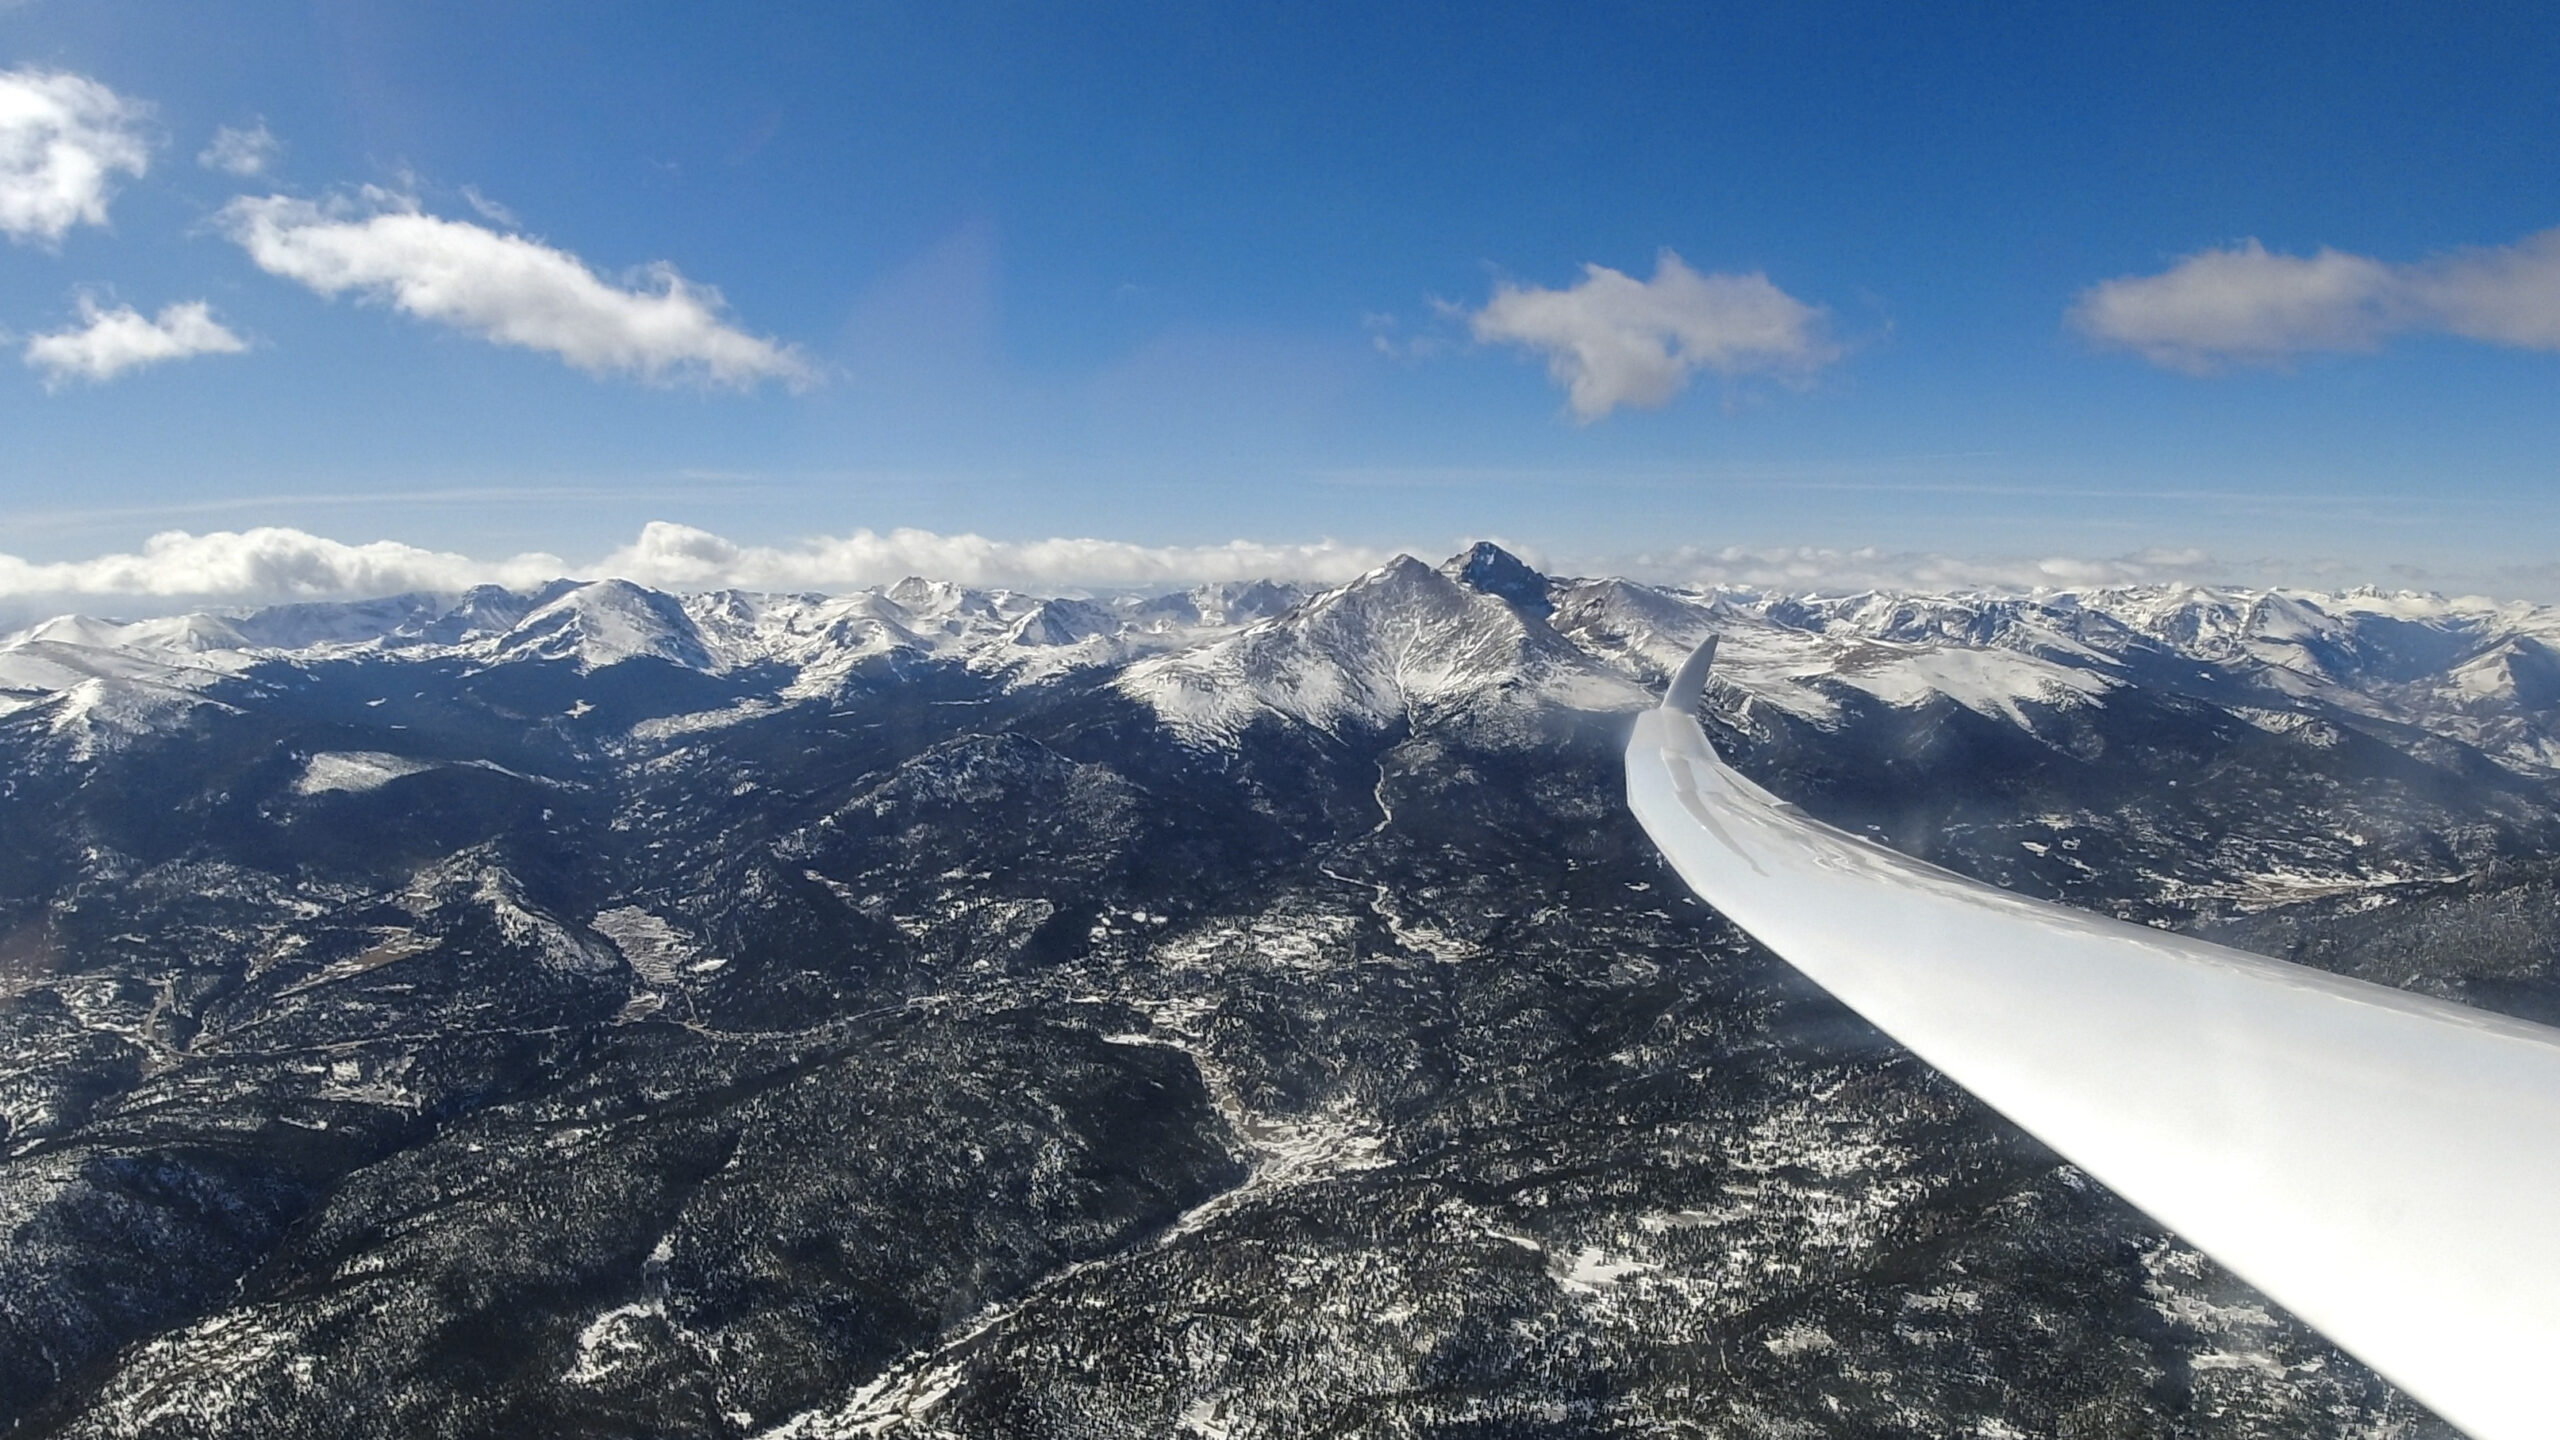
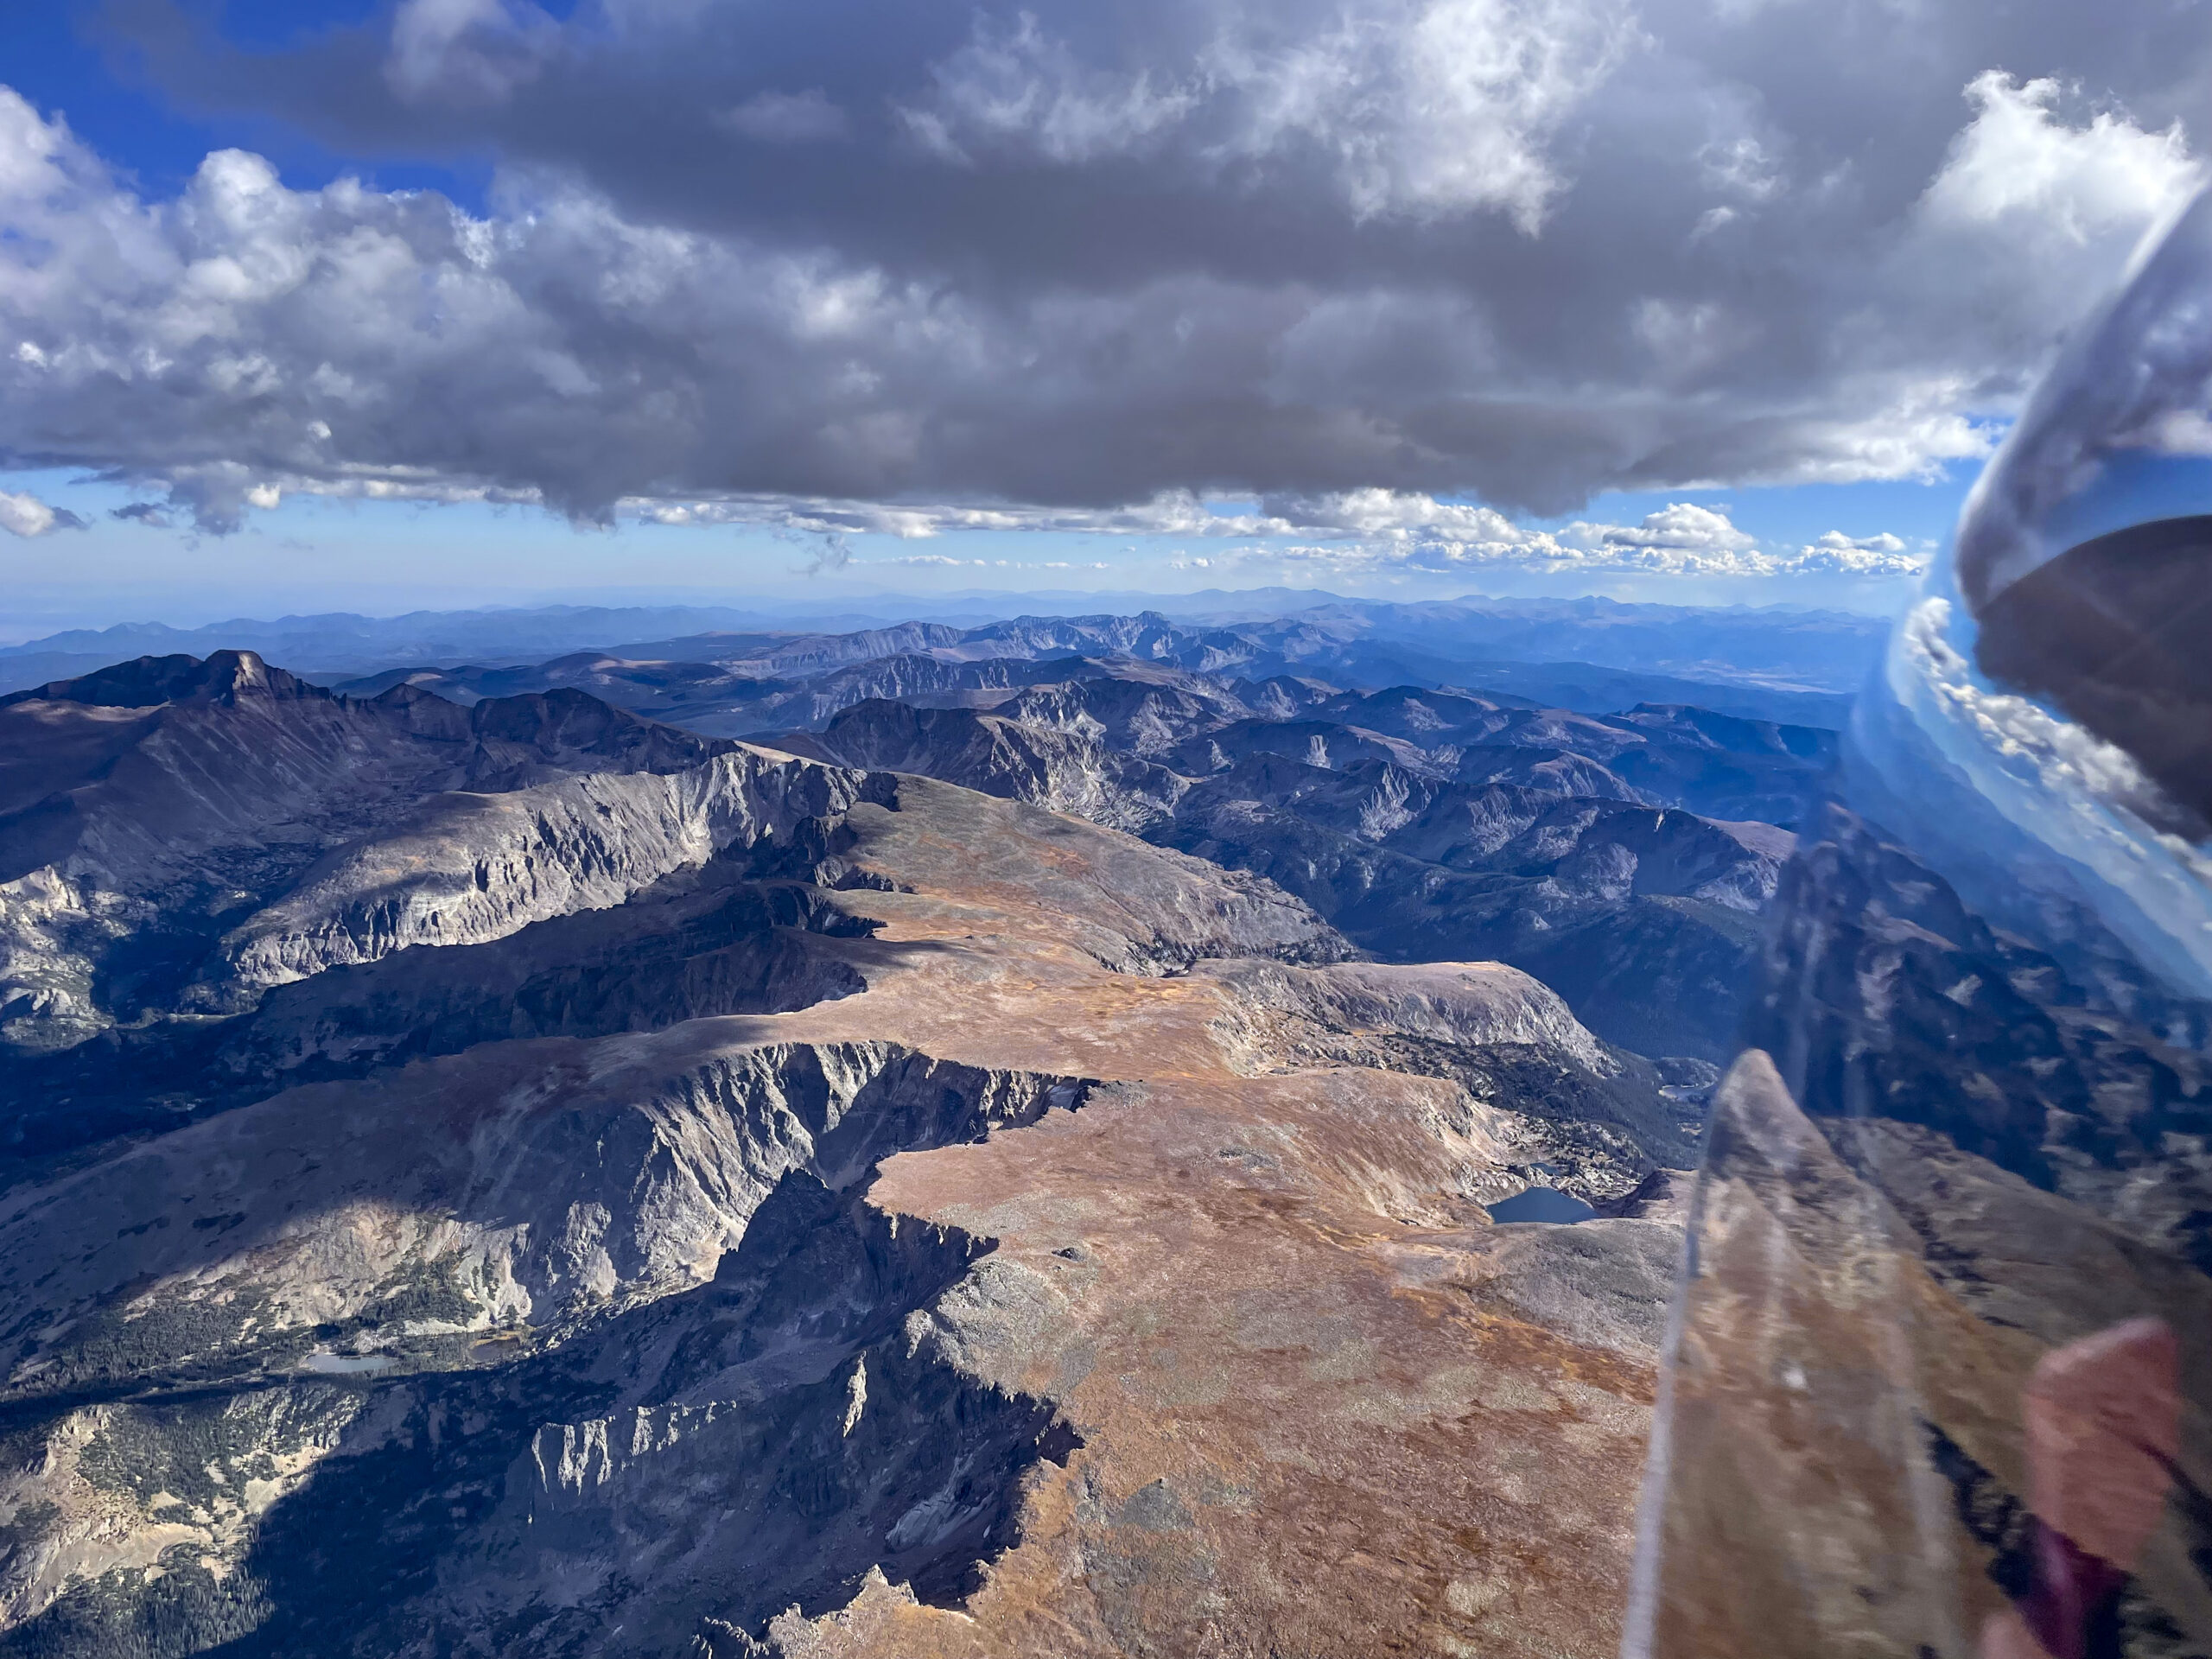
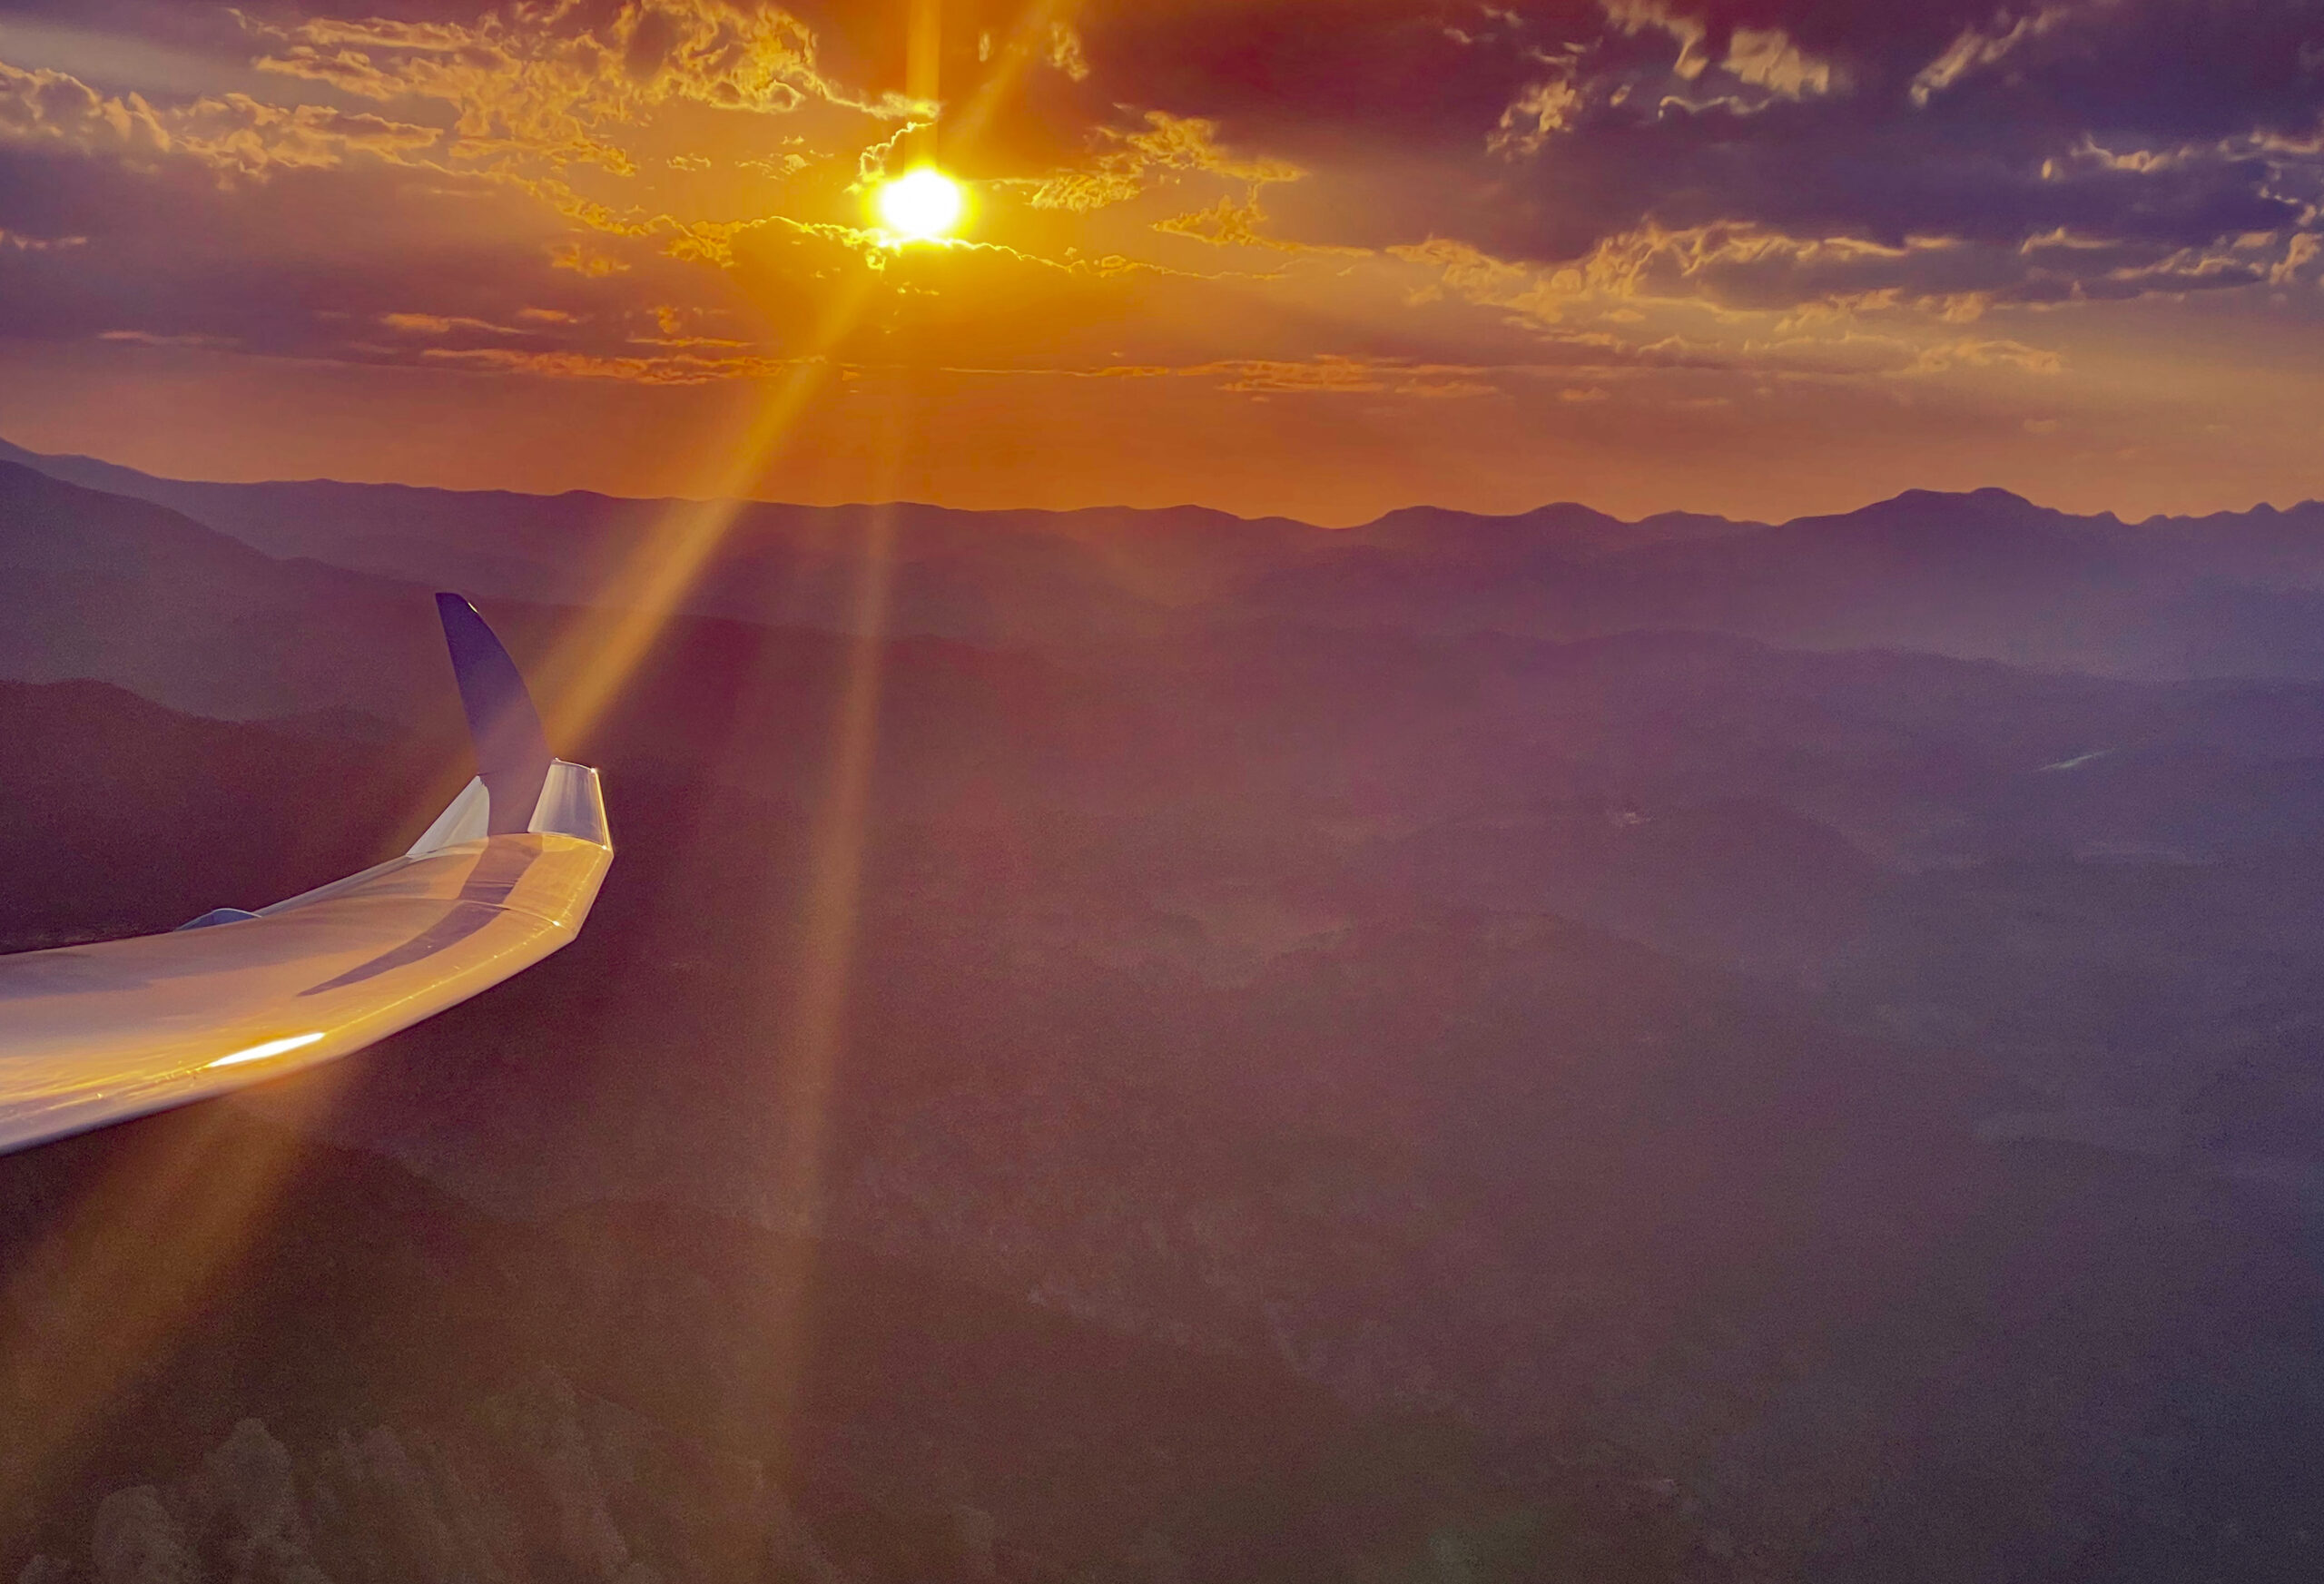
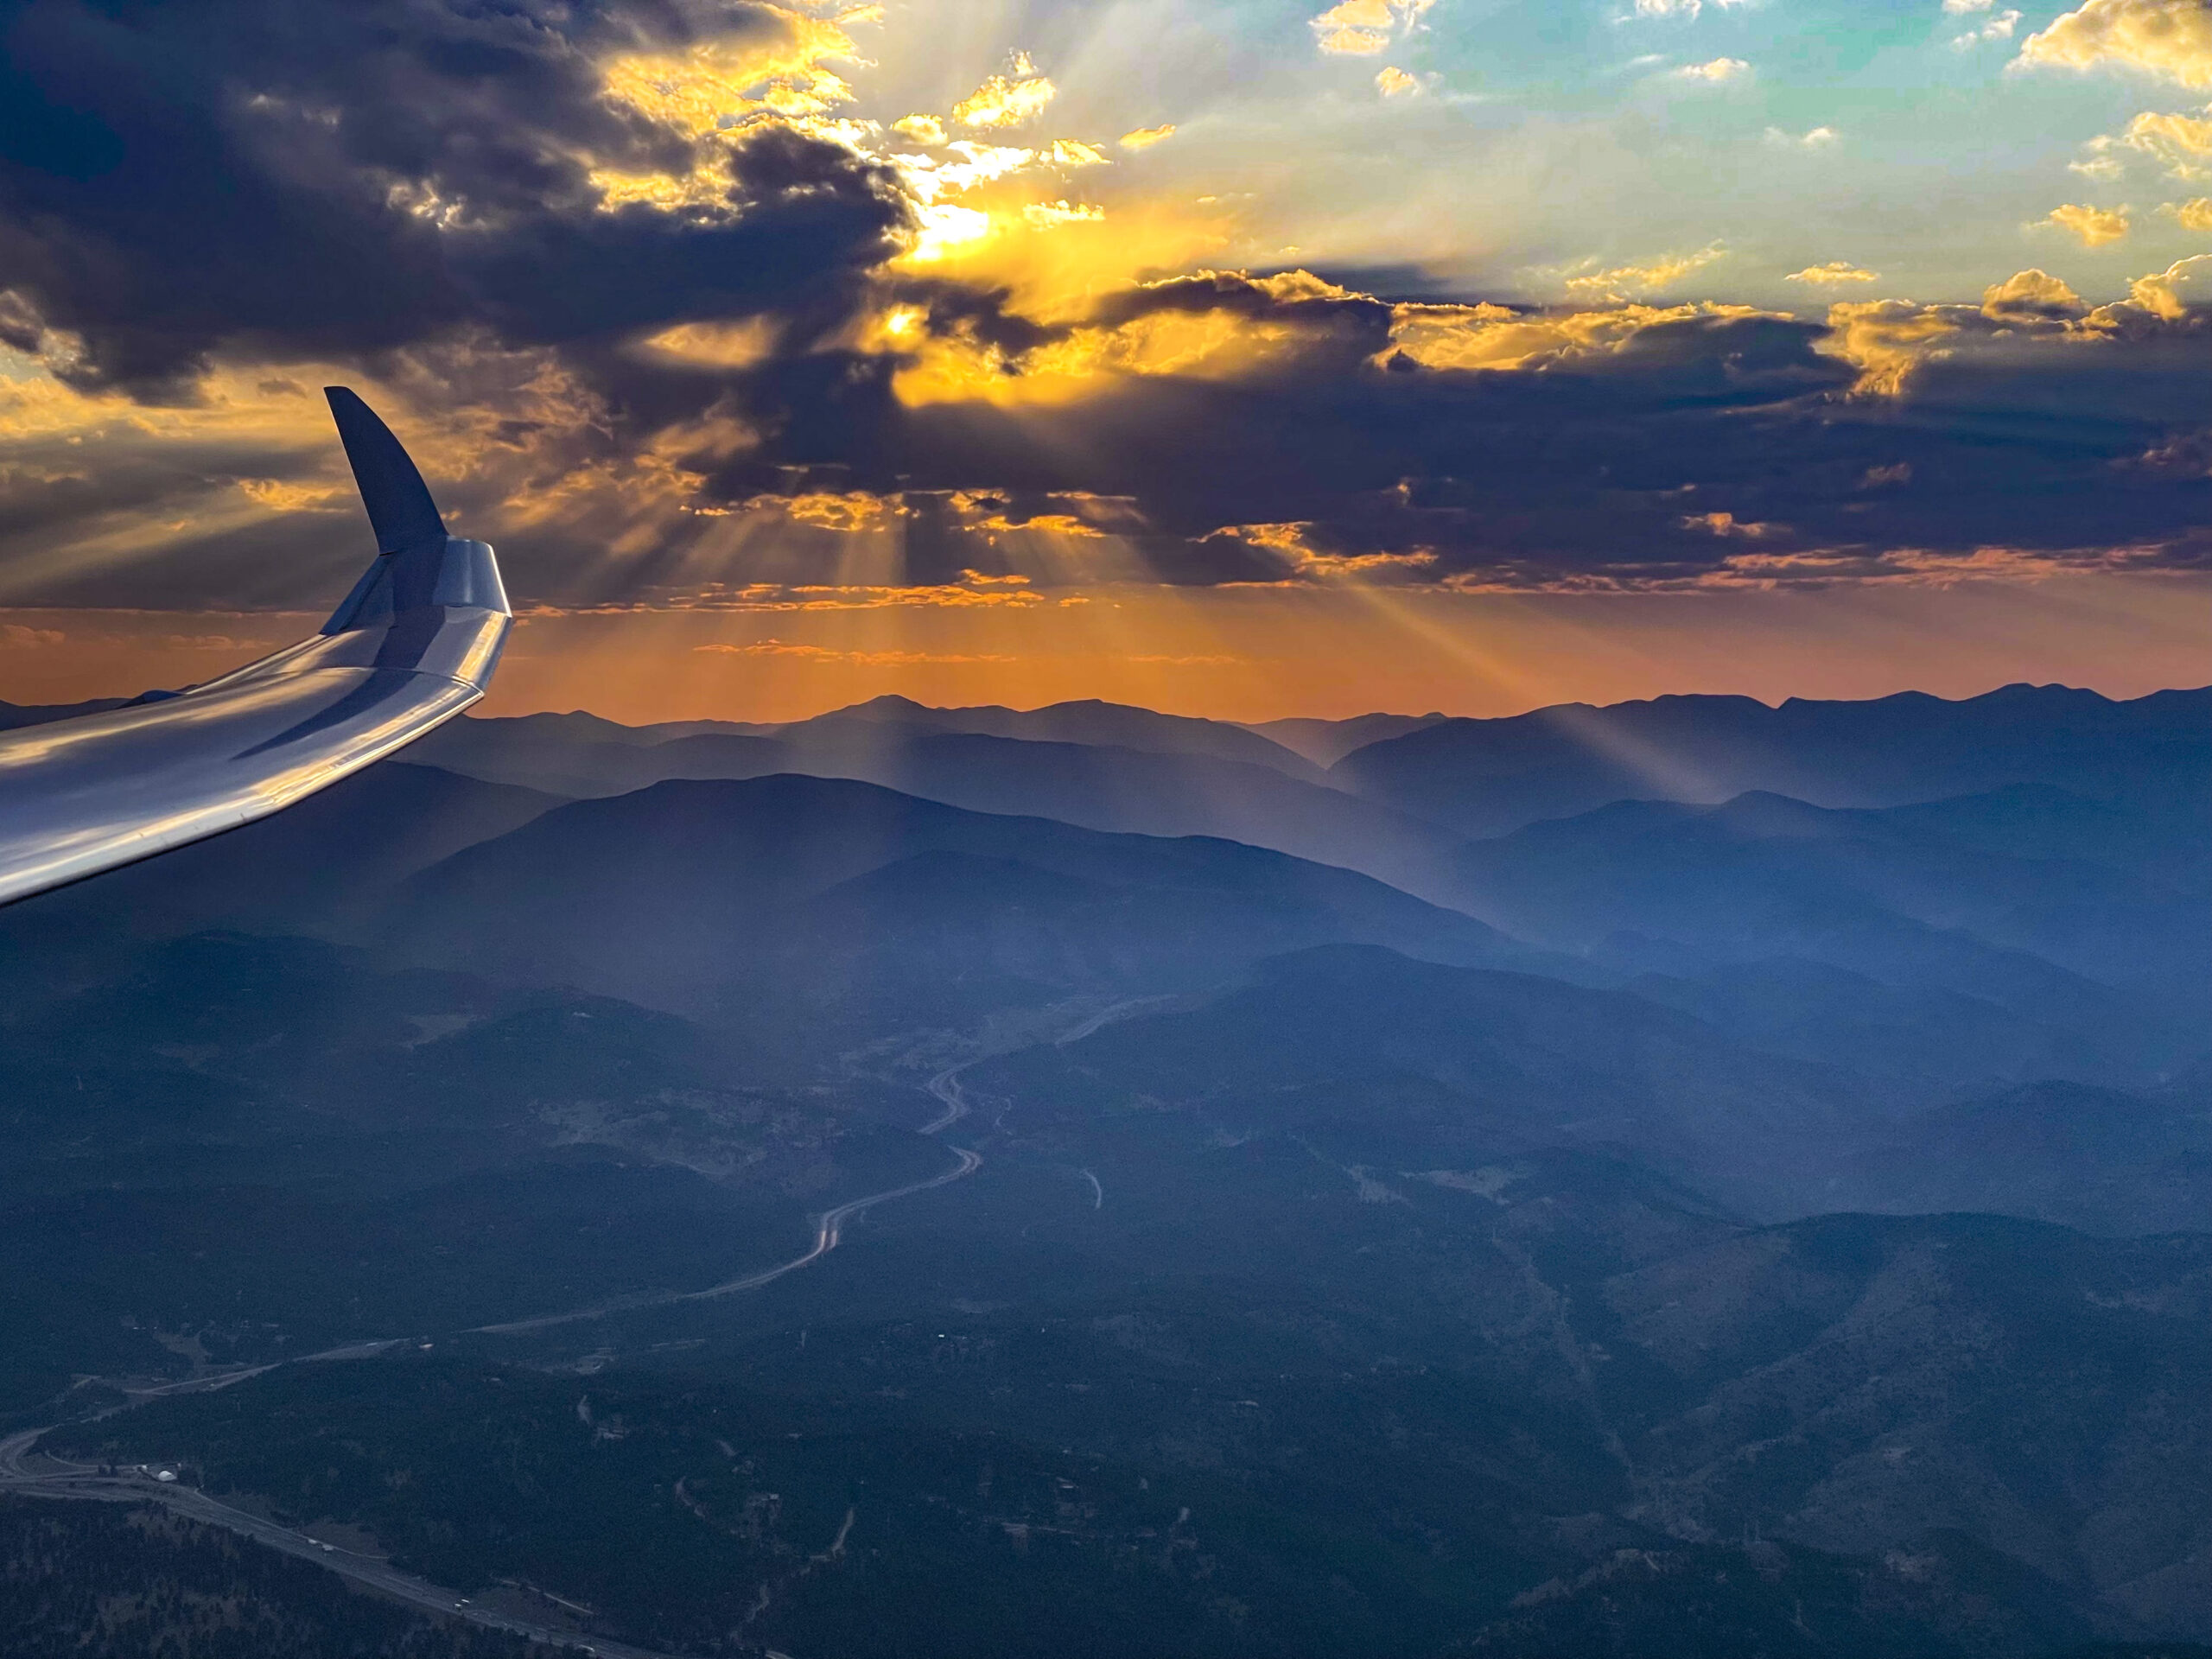
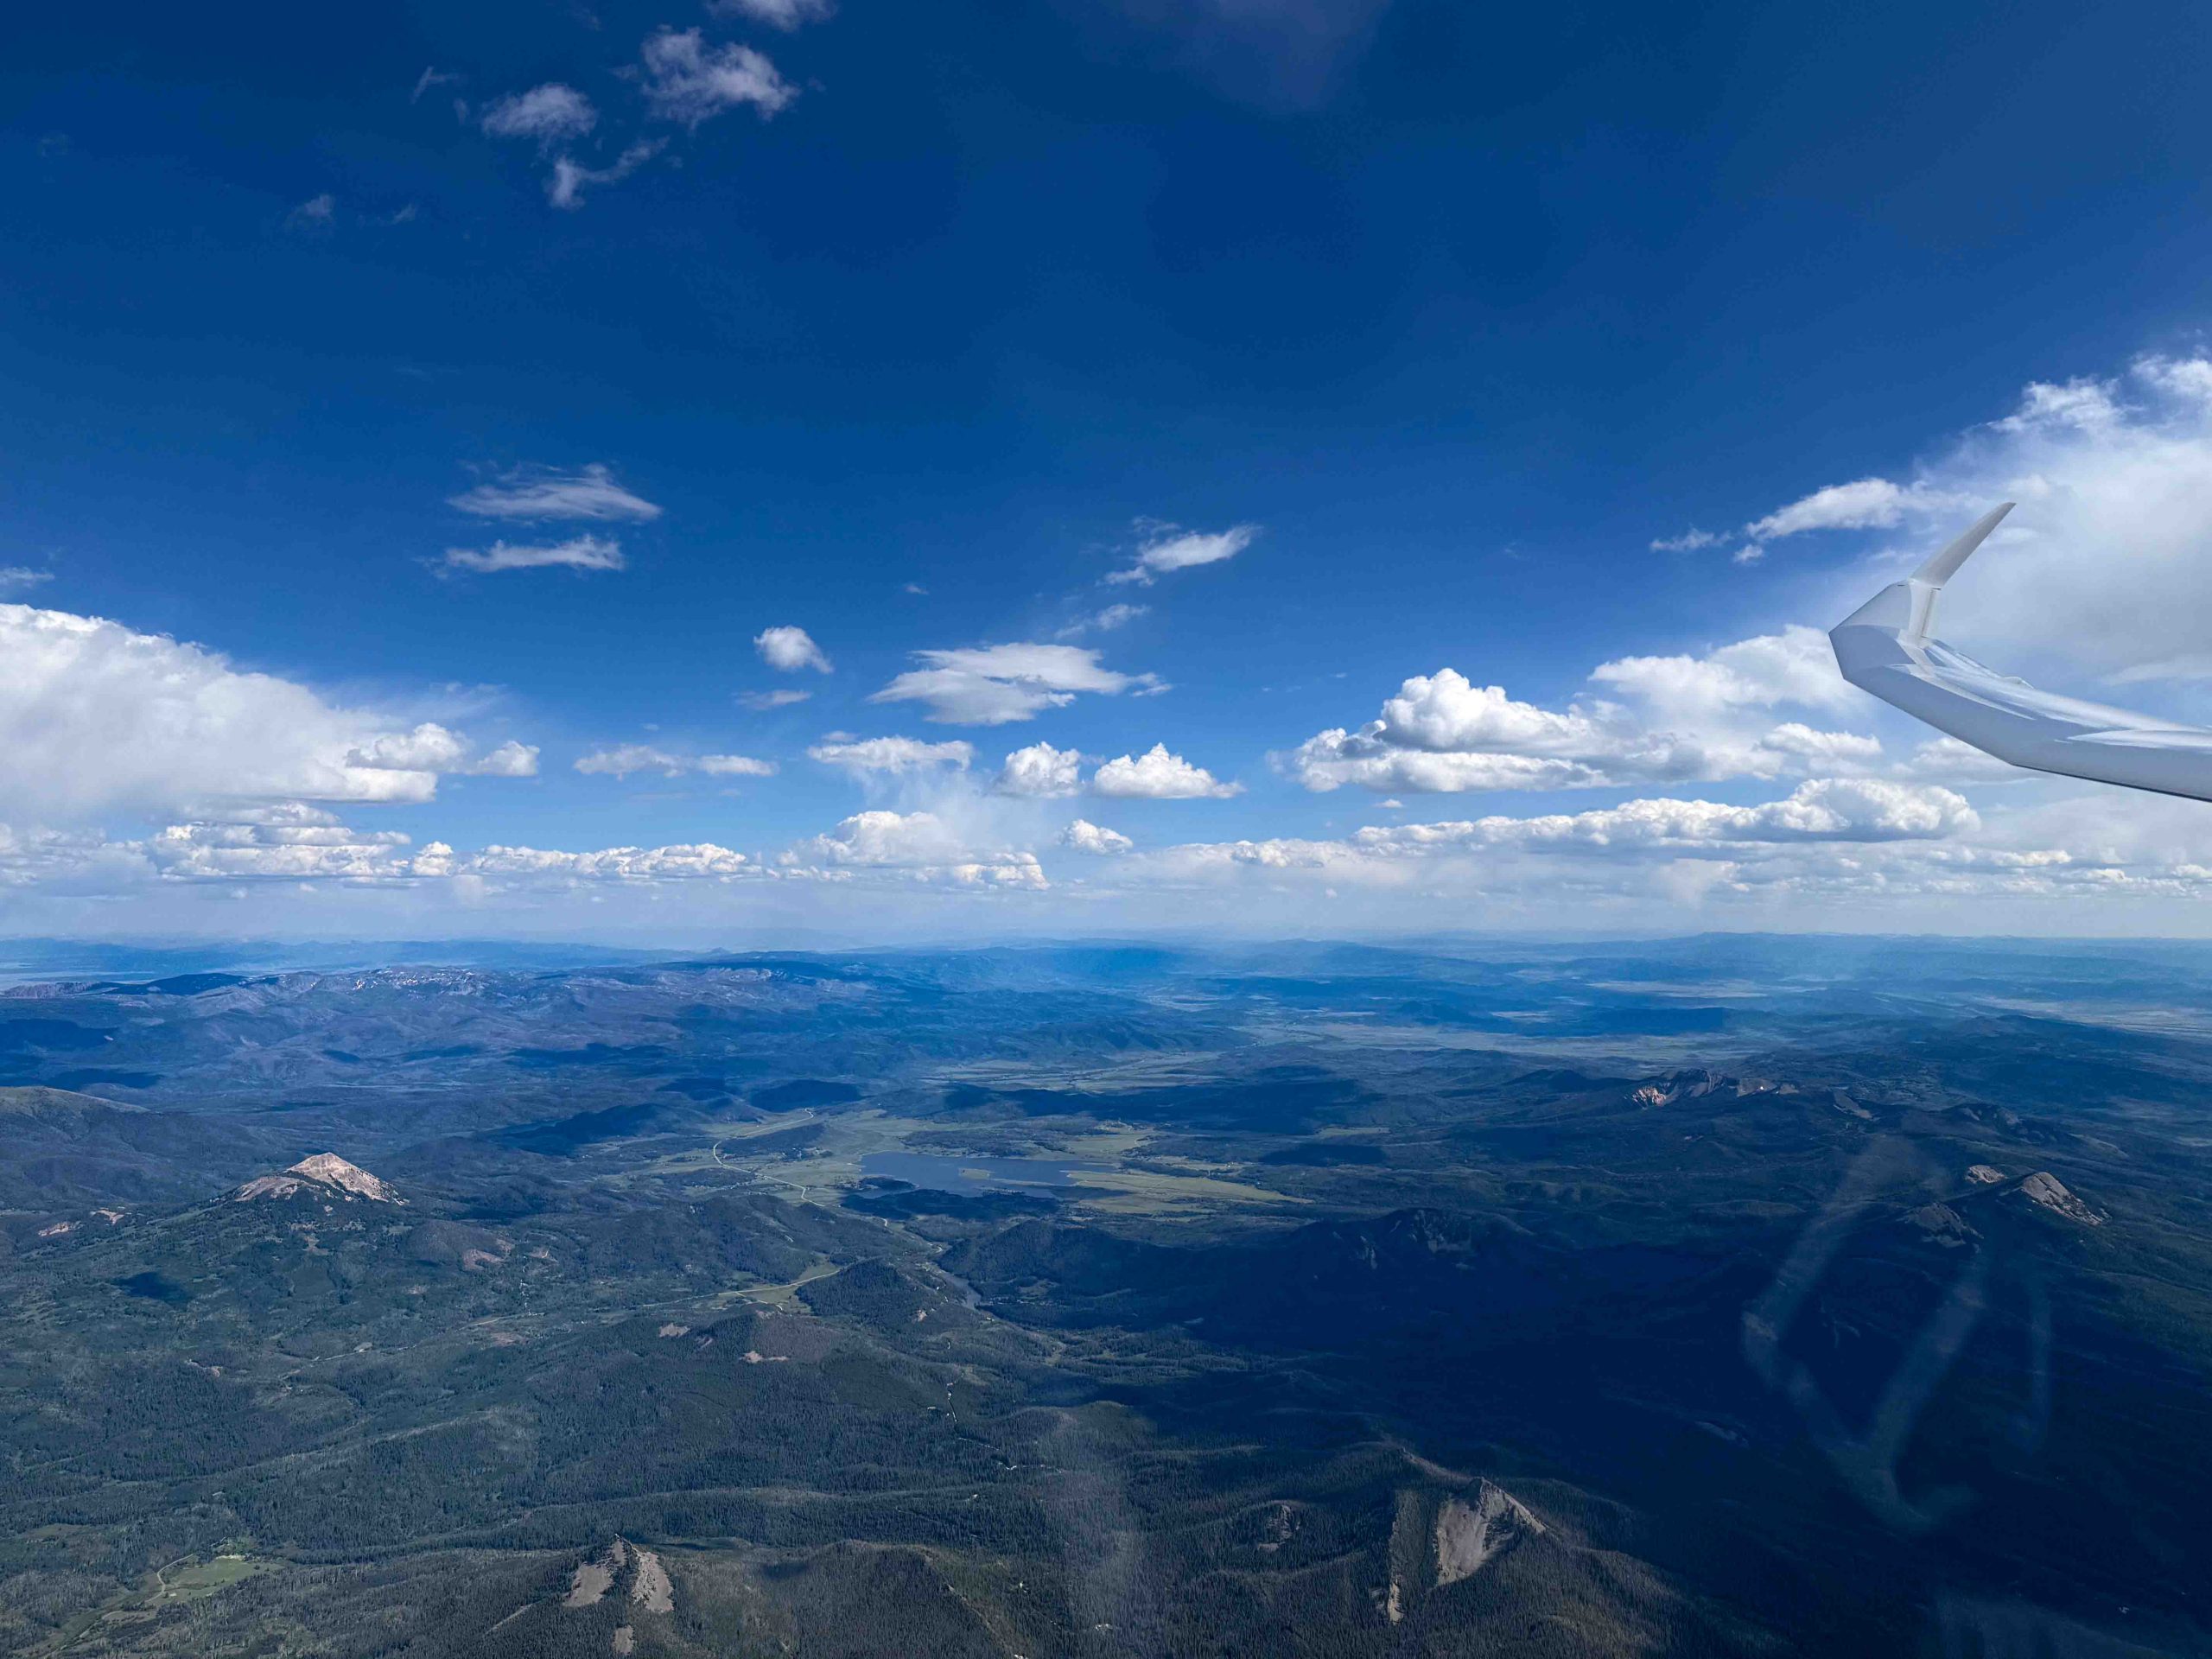
This turned out to be an excellent choice. The cloud I picked allowed me to climb to 17,500 ft and from there it was just one 100 km long final glide across the Continental Divide and towards the finish line. All stars aligned.  Near Trail Ridge Road even the clouds parted, giving me clear passage while showers fell on Longs Peak and over Mummy Mountain.

I watched my task speed inch up as I approached the finish line, which I crossed, uneventfully, at 5:42 PM. It felt incredible! I had been counting on making my final climb around 7 PM to make it across the divide and here I was with time to spare!

I thought about adding a yoyo to the south but then decided to just find another climb to fly out over the prairie towards the Denver Class B airspace to make a free triangle that was a little bit bigger that the one I had declared. This was a little more tricky than I had anticipated as lift was increasingly difficult to find east of the divide (which was now in unfavorable light). But work it did and so I returned to land at just 6:23PM with more than two hours of daylight left.

Final Reflections

By most measures the flight went even better than the plan: I got an early start, a full 30 minutes earlier than Skysight suggested possible.  I stayed ahead of schedule throughout the flight, and I finished well ahead of my target time.  My average task speed of 145kph came very close to Skysight’s suggested maximum of 151 kph.

In hindsight, I asked myself why I did not plan a 1250 km Triangle.  I had at least another 1 1/2 hours of active thermals left  to cover an additional 140 km.  There were no hard constraints. Even 1300 km may have been possible: 190 additional km in 90 minutes – that’s 126 kph.

Plus, I probably could have launched successfully even 15-20 minutes earlier. The initial leg clearly supported it.  With all the OD after the start I was actually somewhat late, not early.  I also could have set the first turn point further to the south (to avoid being too early on Leg 2); and the second turn point could have been further north (the weather supported it). It almost certainly would have been possible.

Who knows, in theory perhaps there was even a chance to fly the 1363 km that it would take to break the US National Record (which dates back to 1986 or the 1386 km that it would take to break the current world record (set by Klaus Holighaus in 1993)…

Here’s a theoretical 1306 km task that might have been possible that day.

Hindsight is 20:20. All of this is pure speculation and impossible to know.

For sure, whether its 1300km or even longer, everything would have to work perfectly.  There’d be no option to ever get stuck. No significant detour.  One could only take good climbs.  The pilot has to be mentally switched on the entire time.  There’s no room for sloppiness.  Are these realistic assumptions to make?  Wouldn’t there have to be an allowance at least for some contingency?  And is all of this possible without taking any safety risks?

I don’t know the answers to these questions.  But this flight and the math shows that such a flight might – just might – be possible.  Even from Boulder, Colorado.  Can it be done?  I don’t know.

But it is an inspiring thought. 🙂

Pete Williams Trophy 2025

(Correction: an earlier edition of this article incorrectly stated that in scoring flights for the Williams Trophy Glider Handicaps would be only used for for the Speed Score and the Total OLC Score but not for the scores for Away-from-Home Distance and Triangle Distance.  Fortunately there is no such issue because the scorer applies handicaps for all scores.  This error has been corrected and the recommendations for OLC and/or WeGlide to report additional data to facilitate – or perhaps even automate – the scoring have been edited accordingly.)

At the 2025 Parowan Soaring Camp, organized by the Auxiliary Powered Sailplane Association (ASA), I succeeded in defending last year’s win of the Pete Williams Trophy.  In this article, I will examine the rules of this contest and take an analytical look at the flights that helped me secure this second win. In particular, I want to see what can be learned from these and other competitors’ flights and how pilots can “best play” at this particular contest.  The lessons learned can also be used for improved task setting in 2026.


The Pete Williams Trophy

The Williams Trophy is a unique contest format based on each pilot’s top OLC scores during the event. However, it is not simply the best overall OLC score that matters. To win the Williams Trophy pilots have to do well in four different categories, I’ll call them the Four Williams Trophy Categories.
  1. Triangle Distance (based on the OLC triangle score)
  2. Distance Away from home (based on the OLC distance score)
  3. 2-Hour OLC Speed (based on the OLC Speed score over four legs), and
  4. Overall OLC Plus Score (based on 6 legs with bonus points for embedded triangle and distance)
Pilots can fly as often as they want during the 2-week event but only the four best flights of each pilot count for the contest.  Plus, each flight can be used for only one of these four categories.
Scores are taken from OLC and glider handicaps are applied to all scores.
Plus there is one other unique rule: to avoid pilot fatigue resulting from very long flights day after day, full points are only awarded for flights up to 6 hours long (from takeoff to landing). If a pilot stays airborne for more than 6 hours, their score is pro-rated accordingly.
Let’s look at an example: say Pilot A scores 600 points for a triangle flown in exactly 6 flight hours and pilot B scores 680 points for a triangle flown in 7 flight hours. Pilot A is awarded 600 points (the six hour flight is not pro-rated) while pilot B is awarded only 582 points (680 x 6/7 = 582). I.e., Pilot A does better than Pilot B, even though Pilot B has the higher nominal OLC triangle score.
This format means that it is not simply the longest flight that counts.  Instead, speed matters as well. In that sense, the contest is somewhat of a hybrid between OLC flying and traditional contest flying.  (In the example above, Pilot A obviously flew faster on average than Pilot B and that is the reason he or she won.).
An algorithm automatically determines which flights of each pilot give the pilot the most favorable overall score. ASA president Tom Seim developed the scoring algorithm.
If pilots fly longer than the 6 hours it is important for them to use the extra time wisely by improving their average task speed. E.g., let’s say pilot C scores 900 points for a triangle flown in 8 hours.  In this case they will get 675 points (900 x 6/8) and score better than pilots A (600 points) or B (582 points).  That’s because Pilot C has the highest average speed.
When pilots first encounter this format, they often assume that flights with a duration of more than six hours are disadvantageous and should be avoided because they almost necessarily extend beyond the strongest part of the soaring day. However, empirical evidence shows that flights of more than 6 hours can actually improve a pilot’s results. We shall examine the reasons for this and develop some tactical tips for how to achieve the best results within the confines of the rules.
Overall, the format is well suited for a long social soaring meet because pilots are not pressured to fly long flights day after day, and there is no need to fly at all if conditions are marginal. Pilots also have the opportunity to regularly enjoy group breakfasts and social dinners without compromising their scoring.
However, it is fair to say that there are a few real problems and limitations associated with the scoring format in its current form.  I will identify these as well and point out what it would take to avoid them.
But first, let’s look at the results in each of the Four Williams Trophy Categories.  The winning flight in each category is awarded 1000 Williams Trophy Points.  All other flights are scored as a percentage of the winning flight.

2-Hour Speed Category

We’ll start with the 2-hour speed score which is taken straight from OLC.  It is the only one of the four flight categories that never involves any time-based pro-rating irrespective of the duration of the flight.  OLC automatically analyzes each flight and identifies the greatest 4-leg distance flown in exactly 2 flight hours without a loss in altitude.  OLC reports the raw flying speed over these two flight hours, and it applies the glider handicap to calculate the 2-hour “Speed/League” score.

My best 2-hour speed was scored on Day 3 of the Parowan Meet.  I averaged a raw speed of 181.4 kph over 4 legs according to the OLC analysis.
181.4 kph is quite fast. After applying my glider’s handicap it yielded 155 OLC Speed/League points.
I felt really good about my score until I found out that it fell far short of being the best overall speed score of the contest. Instead, the best speed score was achieved by Russ Owens, who scored a whopping 184 OLC points for his fastest flight, flown on the very same day and along the very same route.
When converted to the 1000 daily point format for the Williams Trophy, Russ’s 184 OLC speed points received 1000 Williams Trophy Points and my 155 OLC speed points earned only 846 Williams Trophy Points. This begs the question as to why Russ was able to fly so fast. (The difference is very substantial: 1000 – 846 = 154 Williams Trophy Points).
A little analysis shows that the answer has a lot to do with the wind: on that day, we had a 14-18 kt (26-33 kph) south-south-westerly wind and Russ took full advantage of it: he flew for more than two hours to the NNE with the wind directly at his tail the entire time. In so doing he made optimal use of the available tail wind to score maximum speed points. I, on the other hand, turned back to the south after less than two hours, which meant that one of my four OLC speed legs was flown directly into a stiff headwind. This of course partially negated the benefit that the tail wind could provide on that day.
You can readily see from the chart above that all four of Russ’s speed-league legs were with the wind at his tail (shown in green), while I had turned back too soon, which meant my fourth leg was right into the wind (shown in purple).  You can also see the impact this had on the attainable speed: while Russ continued to accelerate the further north he went, my fourth leg was my slowest and far slower than my second and third leg.
Had I followed Russ’ example and continued to the NNE for another 30 minutes or so, my score would likely have been much closer to his.
The lessons we can take from this are fairly simple:
  • Days with a strong tail wind (not uncommon in Parowan) provide excellent opportunities for achieving a good 2-hour speed score.
  • To make effective use of the tail wind for the 2-hour speed score, one must fly for at least the full 2 hours with the wind at the tail.
  • Of course it is important that the day also provides good soaring conditions (and not just a favorable tail wind). This was clearly the case.
Flight traces:

Congrats to Russ for showing how an outstanding speed score can be achieved by making full use of the available tail wind.

Triangle Category

Somewhat surprisingly, on Day 8 of the meet, I scored the highest Triangle score of the contest with a flight that only averaged 119 kph overall.  My 784 km Triangle, flown during a very challenging 7:09 hour flight was pro-rated to 659 Points  for being longer than 6 hours (784 x 6/7.15). As the Triangle Category winner I was awarded 1000 Williams Trophy Points.
Anders Hurtig was very close behind with a flight on Day 9 of the meet.  He flew a 660 km Triangle during a flight that lasted just seconds longer than six hours and was therefore only minimally pro-rated to earn him 658 Adjusted Triangle Points.  This translated to 998 Williams Trophy Points for the Triangle Category.
It’s notable that Anders’ overall 6-leg OLC flying speed was 122kph, slightly faster than my 119kph.  How then it is possible that he wasn’t the one with a higher score? The answer lies in the speed of the triangle itself.  Anders’ triangle speed was 115.41 kph while mine was 115.82 kph.  After completing his triangle, Anders added a little extra (high-speed) flight distance at the end to make it to 6 total flight hours.  This extra distance helped him earn a few more overall OLC points, but it could obviously not help his triangle score. Had he not flown this extra distance, his flight would have been less than 6 hours.  In other words, he did not fully utilize all the available time to make the biggest possible triangle.
In third place in the Triangle Category was Jim Dingess for a flight on Day 2 of the meet.  Jim flew a 638.72 km Triangle during a flight that lasted 5:53 hours, i.e. 7 minutes less than six hours.  Jim’s average triangle speed was 111.59 kph. He received the full 639 points (no pro-rating necessary), which translated to 969 Williams Trophy Points.  Had Jim used the remaining 7 minutes to make a bigger triangle, he, too, could have improved his score by several points.
The top three scores for the best triangle were very close. The reason that I had the top Williams Trophy Point Score was not that my triangle was bigger but that I flew it at a slightly faster average speed than Anders Hurtig and Jim Dingess. If I had taken seven hours to complete it (instead of 6:46 hours, Anders Hurtig would have won the Triangle Category ahead of Jim Dingess, and I would have ended in third place.
The lessons to take away here are:
  • Use the available time of 6 hours (at least) to make the greatest possible triangle.  As a rule of thumb it is a good idea to spend at least six full hours on the triangle.
  • If six hours have lapsed since takeoff, land quickly after completing the triangle to avoid that the triangle distance gets pro-rated down.  Both Anders and I successfully avoided penalization because we did not add empty miles beyond the 6 hours. Jim flew less than 6 hours, was not penalized, but did not make full use of the available time.
  • Flying longer than 6 hours to make a bigger triangle does not hurt one’s score, provided that the average triangle speed does not suffer as a result.  In fact, flying longer than 6 hours may be helpful because the “unproductive” time at the beginning (taking off and climbing out) and at the end (to descend and land) is on average the same for everyone, irrespective of the length of the flight overall.  Longer flights (more than six hours) may actually be advantageous because as a percentage of overall flight time, more of the time can be used “productively” (e.g. to make a bigger triangle).
Flight traces:
  • Clemens: https://www.onlinecontest.org/olc-3.0/gliding/flightinfo.html?dsId=10226389&f_map=
  • Anders: https://www.onlinecontest.org/olc-3.0/gliding/flightinfo.html?dsId=10227240&f_map=
  • Jim: https://www.onlinecontest.org/olc-3.0/gliding/flightinfo.html?dsId=10216164&f_map=

Distance Away from Home Category

On Day 10 of the meet, I succeeded in setting several new Utah State records with a declared 1001 km Out and Return flight from Parowan to Wyoming and Idaho and back to to Parowan.  (The furthest point from home was 510.9 km away and the six-leg OLC distance was 1090 km.)  Although this was a very long flight with a duration of 8:40 hours (and therefore heavily pro-rated), it still earned me the greatest distance score of the meet. My average O&R Speed was 117.9 kph calculated over the entire duration of the flight from takeoff to landing (510.9 * 2 / 8.667 hours).

My 511 distance kms were pro-rated to an Adjusted Distance score of 354 points (511 * 6/8.66).  As Distance Category Winner, this translated of course to 1000 Williams Trophy Points.

In second place was the duo of Bill Feiges and Michael Stieber (flying Bill’s Arcus M) who used the same day to fly 374 km away from home.  Their flight duration was 6:39 hours, which means the 374 km were adjusted to 337 points (374 * 6/6.65), which was good for 950 Williams Trophy Points.   Their average O&R Speed was 112.5 kph (using the same calculation methodology: from takeoff to landing).

It’s important to note that making a much longer flight than anyone else that day was not the reason as to why I was able to win the Distance Category.  Once the flight was 6 hours long, the only thing that mattered for the Williams Trophy was the greater average handicapped speed.

In third place that day was Chris Esselstyn with a 7:01 hour flight at an average O&R speed of 107.13 kph that took him 383 km from home. Pro-rated, this was good for 329 points (383 * 6/7.01)  and translated to 928 Williams Trophy Points.  This means, Bill & Michael scored more Williams Trophy Points that Chris despite flying a slightly shorter distance.  Why?  They did so at a higher average handicapped speed.

The lessons to take away here are:
  • For flights that last six hours or less, the winner is simply determined by who flies the greatest distance away from home.
  • However, as is also the case when flying triangles, once a flight is 6 hours long (or longer), flying a greater distance ceases to be an advantage.
  • One can still win the  Distance Category (or the Triangle Category) with flights that are much longer than 6 hours, but to do so one must achieve a greater average handicapped speed (over the course of the entire flight from takeoff to landing), not a greater distance!

Important Note: based on the current rules, the best distance score can easily be achieved by flying a straight out flight and landing far away from home (instead of returning back to Parowan).  Anyone who is willing to do this will not only score the greatest distance score but has a very good chance of winning the Williams Trophy outright!  The advantage obtained from the distance score alone could easily be 500 Williams Trophy Points (if flying at the same average handicapped speed as the best Out and Return Flight). It would be nearly impossible to make this up in the three other categories combined! I will get back to this oddity in my critique of the current rules.

Flight traces:
  • Clemens: https://www.onlinecontest.org/olc-3.0/gliding/flightinfo.html?dsId=10228268&f_map=
  • Bill/Micheal: https://www.onlinecontest.org/olc-3.0/gliding/flightinfo.html?dsId=10228147&f_map=
  • Chris: https://www.onlinecontest.org/olc-3.0/gliding/flightinfo.html?dsId=10228162&f_map=

OLC Plus Category

OLC Plus is a composite category.  It is made up of overall distance flown over six legs plus bonus points for Triangle Distance (30% of the FAI triangle distance) and Distance Away from Home Bonus (also 30% of the eligible distance away from home).
At this year’s event, the winner of the OLC Plus Category was Jim Dingess with his flight on Day 10 followed by myself for my flight on Day 9 and Bob Caldwell for his flight on Day 10. The results were close with the top three only 29 Williams Trophy Points apart.
As one should expect given the composite nature of the score, all three flights included not only a good distance flown at a good average handicapped speed, but also substantial triangles and a point that is relatively far away from home.
Jim’s flight lasted 6:09 hours during which he flew 831 km (per OLC’s 6-leg rule) at an average speed of 140 kph, including an 386 km FAI triangle, and a distance away from home of 259 km.  His total OLC+ score was 869 points.  This was pro-rated to 848 points (869x 6/6.13) and good for 1000 Williams Trophy Points.
My flight took slightly longer at 6:52 hours, covered 846km (per 6-leg rule) at a slower average speed of 129 kph, included a large 787km triangle and a distance away from home of 253 km for a total OLC Plus score of 949 points.  This was pro-rated down to 834 points (949 * 6/6.8), which translated to 984 Williams Trophy Points.
Bob Caldwell’s flight was 6:02 hours long, covered 722km at an average speed of 126 kph, included a 597 km triangle, and a distance away from home of 312 km. Bob’s total OLC Plus score was 828 points, which was minimally prorated to 823 points, and translated to 971 Williams Trophy Points.
Since all the three top flights lasted longer than 6 hours the Williams Trophy Point Score did not hinge on total flight distance but on average handicapped speed over the 6-OLC legs plus the bonus points achieved by each pilot for triangle and away-from-home distance.
You can readily see from the chart above that Jim had the smallest triangle but made up for it by flying the six OLC legs at a much higher average speed than either Bob or myself.  Bob had the greatest distance score and a better triangle than Jim, but the difference in bonus points gained was also insufficient to compensate for Jim’s superior speed over the six legs.
The lessons to take away here are:
  • The best tasks for an optimum OLC Plus score are in most cases the same as those for best FAI triangles.  Ideally, the triangle should be configured in a way to have a point that is particularly far away from home.  (I.e., it is best if the start/finish point is at one of the triangle’s corners and not along one of the legs.)
  • As with all other tasks, average speed becomes really important once the flight lasts longer than 6 hours.
  • Spending at least six hours on a good size triangle that can be flown fast will provide a great score.  Adding extra miles after closing the triangle pays off only if these extra miles are flown at a significantly greater speed than the earlier part of the flight (because they normally won’t earn extra triangle bonus points or extra distance away from home bonus points).
  • Out and Return tasks might also provide good overall OLC Plus scores but only if they make use of powerful energy lines that allow for especially fast flights. Jim successfully pursued a strategy of flying along the best energy lines to achieve such speeds, while still being able to generate a reasonably sized triangle.
Flight traces:
  • Jim: https://www.onlinecontest.org/olc-3.0/gliding/flightinfo.html?dsId=10228177&f_map=
  • Clemens: https://www.onlinecontest.org/olc-3.0/gliding/flightinfo.html?dsId=10227235&f_map=
  • Bob: https://www.onlinecontest.org/olc-3.0/gliding/flightinfo.html?dsId=10228110&f_map=

Overall Results

The overall results from the 2025 Williams Trophy Contest are shown below and the full results in each Category are reported here: Williams Trophy 2025 Day 8.

Overall Lessons

Pilots who follow the following recommendations will improve their chances of scoring well in competing for the Williams Trophy:

  1. Fly on the best days of the contest.  (You can take multiple rest days during the two weeks but don’t do so on days when conditions are particularly favorable to score highly in any of the 4 Categories).
  2. Each flight should be at least six hours long.  In fact, it is best if you spend the full six hours “on task” – either flying a long Out&Return Flight, or a long Triangle Flight.
  3. Out and Returns are best suited for scoring well in the Distance Category and in the 2-hour Speed Category. Use days with a substantial tail wind along the best energy lines to obtain a good speed score.  To do so, fly at least two full hours with the wind at your tail.
  4. Big triangles are best suited to score well in the Triangle and in the OLC+ Category.
  5. Land immediately after completing your task (i.e. your Out and Return Flight, or your Triangle) provided that you have been flying for at least 6 hours.  Adding extra miles after completing your task will rarely help and could even be very disadvantageous.  The only score it could possibly improve is the OLC Plus score, and only if these extra miles are flown substantially faster than the prior part of the flight (because they won’t receive additional bonus points for triangle or distance). Any Triangle score or Distance score will suffer because the longer you’re up flying the more they will get pro-rated.
  6. There is no inherent disadvantage in flying Out and Returns or Triangles that last longer than six hours provided that your average speed will not suffer.
  7. Do not launch so early that “getting up and out” will take a long time.  This is because the six hour flight time begins at takeoff and ends with the landing.  If you spend an hour climbing out this will hurt your score substantially.  Another way to put this is that the performance of every climb counts, even that of the very first climb after launch and before you are leaving on task.

Daily Task Setting

In 2025 we introduced an optional daily task intended to help pilots achieve good results for the Williams Trophy Contest.  Tasks used the AAT (assigned turn area) format and were usually either Out and Return or Triangle tasks, making use of the best weather of the day as forecast by Skysight. Task minimum time was typically 5 hours.  The minimum task distance was usually just under 500km so that lower performance gliders could make it around, and the maximum distance was typically in the range of 700-900 km so that high performance gliders would be able to spend 6 hours on task and not run out of space.  To support these tasks we used the Local Competition feature on WeGlide which automatically scored the flights.

Pilots reported that this was a fun addition to the contest.  Tasks were strictly optional.  I.e. pilots were able to design their own flight route without limitation if they thought that would help them do better than the suggested task. Most pilots made use of the task on at least some of the days.

Based on the analysis in this article, the task format for 2026 can be slightly adjusted based on the following guidelines:

  1. Weather permitting, increase the minimum task distance to 5:30 hours and/or slightly increase the required task distance.  This will help prevent early finishes and help pilots use the available time to achieve optimum Williams Trophy results. Pilots should be encouraged to spend at least 5:30 hours on task to minimize the need for “empty miles” at the end to fill up the 6 hours.
  2. Use only Out and Return and Triangle tasks unless the weather dictates otherwise.
  3. The best weather days should be used to declare triangle tasks.  Weather permitting, there should be more triangle tasks than O&R tasks.
  4. O&R tasks are best used on days with a good tail wind (normally on the outbound leg to the NNE as the prevailing winds at Parowan are from the SSW) and strong energy/convergence lines.  This will also help optimize the 2-hour speed score.  The turn point needs to be far enough away from home that even the highest performing gliders can fly more than 2 hours with a tail wind.
  5. Continue to set big turn areas, generally with the maximum possible 50km turn radius.  (The 50km max size limitation for turn areas on WeGlide is a bit problematic for O&R tasks because the difference between min and max task distance is only 200km.  The min distance may be somewhat long for low performance gliders and the max distance possibly too short for high performance ones.  For triangle tasks it is less of an issue because there are two turn areas to use for shortening/extending the flight. My wish here would be for WeGlide to allow turn rings with a maximum radius of 100 km as this would solve this problem for contests with very different glider handicaps:  e.g., at Parowan the handicap varied from 93 for the Carat to 122 for the Ventus 3 and JS3.)
  6. Keep the Start/Finish as a ring with a 10km radius around Valentine Peak.  This seems to work well and allows everyone to easily get a valid start and finish.

Review of the Williams Trophy Contest Format

The Williams Trophy is a unique contest format that I have not seen used anywhere else.  Parowan attendees enjoy it year after year.  The following characteristics make it particularly well suited for an extended social soaring meet.
Safety First
  1. The rule according to which flights of more than 6 hours are pro-rated is an effective tool to minimize pilot fatigue.  It means that pilots don’t have to fly longer than six hours to score well. The format prizes soaring skills over endurance ability. Initially I thought I would dislike this aspect but I have experienced its merits and think it is a really great rule for such a long event.
  2. The six hour rule also discourages flights in marginal conditions early or late in the day.  This is of particular relevance in Parowan because of very poor or non-existent land-out options in some parts of the task area.
  3. There is no pressure to fly every day or in marginal conditions because only the best 4 flights of each pilot count.   In fact, it is possible to win the event even if one flies on four days only.  Keith Essex proved this in 2018 when he only attended the event for a short time, flying exactly on four days, and winning the Williams Trophy.  Why go to a flying even and only fly when the weather is good?  Easy: the area around Parowan also offers tremendous sights to see on the ground: Zion National Park, Bryce Canyon National Park, Grand Canyon National Park, Capitol Reef National Park, Grand Escalante Staircase, Lake Powell, the Tushar Mountains, just to name a few.
Longer Flights Can Still Lead to Success

Some have criticized the six hour rule, arguing that it all but eliminates 1000km or other long flights.  This is not necessarily the case.  Here’s why:

  1. Flying more than six hours is not a disadvantage if the extra flight time is used wisely (e.g. to achieve a bigger triangle or a greater Out and Return distance) and provided that the pilot is able to maintain a good average speed throughout the flight.  E.g., if Pilot A flies a 1000km triangle and takes 8 hours to do so (from takeoff to landing), she will receive the same score as Pilot B who flies a 750km triangle in exactly six hours (also from takeoff to landing).
  2. Now assume that Pilots A and B each take 25 minutes to launch and climb before heading on task, and that each take 5 minutes to descend and land after completing their task.  For simplicity, assume that no scoring distance at all is flown during these 30 minutes of launching and landing (25+5).   This means Pilot A had 7:30 hours to fly the 1000km triangle, while Pilot B only had 5:30 hours to fly the 750 km triangle.  Now calculate the average speed required: Pilot A had to achieve an average speed of 133 kph (1000/7.5), but Pilot B had to fly slightly faster at and average speed of 136.4 kph (750/5.5).  Had Pilot A flown her triangle at the same average speed as Pilot B, she would have completed it 2.5% sooner, finishing the task in 7:19 hours instead of 7:30 hours and winning the day.  In other words: because launching and landing takes the same time irrespective of the time spent on task, flying longer tasks (more than 6 hours) can be a slight advantage because one can actually fly a little slower to achieve the same score.
  3. Of course the small advantage of flying longer tasks has its limits.  Starting or ending the flight in weaker conditions would quickly cause a disadvantage because the average attainable speed would quickly diminish.
The Quirks of Daily Optimizations

One peculiar and particular oddity of the Williams Trophy scoring format is the quirkiness of daily score-reruns due to optimizations.  This can be very entertaining even though there’s nothing unfair or otherwise inherently wrong with it.

But consider: your score can go down throughout the contest!  This is a logical consequence of the fact that only the best 4 days count, and that the best score in one category is determined by all flights flown during the entire event, and not just those flown on a particular contest day.

A simple example will illustrate this.  Say Pilot A wins on each of the first four contest days.  She will then have a preliminary score of 4000 Williams Trophy Points.  On Day 5 she does not fly at all and Pilot B scores 20% higher than the best score of Pilot A in one of the 4 categories.  Pilot A will lose 200 of her 1000 points for that category and will now only have 3800 points.

As you may expect, this feature of the scoring format leads to endless and often humorous discussions at daily pilot meetings, dinners, and breakfasts.  Consider that it’s possible that a pilot may improve in rank in the standings even on a day they did not fly, simply because the scores of some other pilots were knocked down more than his own! How and why this happens can be exceedingly difficult to understand, let alone explain.  It’s not wrong, it is just a consequence of the rules.

I see this as a fun albeit slightly peculiar feature of the contest format.  However, it would be nearly impossible to apply at a more competitive event where contestants would demand a detailed explanation of what is happening to their scores, day by day.

What About Straight Out Flights?

We have seen above that the current rules provide a powerful incentive to fly a straight out flight (landing someplace else) in order to maximize the Distance score.  Doing so would provide a tremendous advantage and could easily result in winning the contest outright.  The reason for this is that the entire outbound flight time would be used to maximize the distance score.  If the pilot flies at the same average speed as the best scoring Out and Return flight, the Outbound flight would earn 1000 Williams Trophy Points and the best Out and Return flight would only earn 500.  Days with a strong tailwind component on the outbound leg would amplify this advantage even further resulting in a possible point differential in this category of well over 500 points.  Such a difference would be nearly impossible to make up in all the other three categories combined.

From a contest perspective, the only disadvantage of pursuing this strategy is that the pilot would likely forego the opportunity to compete on the following day.  That’s because only flights that originate at Parowan count for the contest, and presumably the pilot would need (at least) the next day to return to Parowan.  However, since only the best four flights count for the overall results, it would be a small price to pay during a two week event. Of course the real prize is the inconvenience and actual costs involved in buying another hotel room etc.

In my opinion, this rule oddity could (and perhaps should) be eliminated by counting the distance score twice for successful O&R flights.  If the pilot would land elsewhere or use the engine to return back home, only the outbound leg would count.  I think that this would be more appropriate in the context of a social meet where pilots are encouraged to be back at home, but it is a policy decision and can be made either way.  At least pilots should know that this oddity currently exists.

The Real Limitations of the Williams Trophy Contest Format

Although attendees greatly enjoy the event there are some real issues associated with the scoring format, which would also not hold up in a more competitive setting.

  1. A better engine leads to a better score.  That’s because the 6-hour rule is measured from takeoff to landing.  If Glider A takes 15 minutes to launch and climb and Glider B only takes 10 minutes, this means that the pilot of Glider B has 5 extra minutes to score.  5 minutes does not sound like much, but it still amounts to 1.4% of the 6-hour time window (or 14 points on the daily 1000 point Williams Trophy Point scale).  (This advantage is irrelevant for the 2-hour speed category, so the total advantage would be 42/4000 Williams Trophy Points or about 1% for the entire contest.)
  2. A rapid descent and landing improves the score.  It doesn’t feel quite right that after finishing fast and high one must pull the spoilers and get on the ground quickly to avoid that one’s score gets discounted.  It can also be problematic when one is incentivized to land quickly while other gliders are trying to do the same.   The race really should be over when the finish line is reached and not continue throughout the landing procedure.  In practice I have not seen this being a major problem but that’s mainly because no one takes the contest serious enough to worry about losing what might be 0.5-1% of the daily score. However, in a more competitive setting this would be a real issue.

While these two issues are easy to recognize, they are unfortunately difficult to fix.  The data used for scoring the contest are directly taken from a spreadsheet that OLC reports for flights from from a specific location, in this case Parowan.

The OLC location spreadsheet only reports Total OLC Plus Points, km flown (based on 6 legs), FAI km flown in km, distance km flown in km, as well as start time and finish time of the flight. The scorer ensures that handicaps are applied to all scores (including Distance and Triangle distance where OLC currently only reports raw kms.)

To solve the two issues noted above, additional data would be needed. E.g., to avoid the distortion due to unequal engine performance, OLC could simply add a time stamp and altitude for engine shut off (or tow release in case of aero-tows) in its reporting spreadsheet.  Solving for the descent and landing issue is a little more  complicated.  Entry into a predefined – e.g. 5 km radius – finish cylinder around the airport below a certain altitude (say 3000 ft AGL to allow for a good safety margin to sort out the landing order even in problematic weather) might be a possible solution.  The data for this is readily  available but OLC would need to report it in spreadsheet format to avoid a lot of manual work for the scorer.

Using WeGlide instead of OLC as a data source currently does not solve this problem either.  However, if there is more interest in a time-capped contest format in general, perhaps WeGlide would be willing to make the required additional data more easily available.  Ideal would be a location-based spreadsheet that reports for each flight: date, name, total points for the flight, O&R distance, FAI triangle distance, 2-hour Sprint score, glider and glider handicap, engine shut-off time and altitude, and entry into the pre-defined finish cylinder below a pre-defined altitude.

Even better would it be for WeGlide to build on their Local Competition format and perhaps develop a new scoring format for a time-capped contest with multi-day automatic scoring that would eliminate any manual scoring requirements.  Just asking for a friend 😉

Socializing

The Williams Trophy Format is great for socializing.  The typical soaring day starts with a joint group breakfast at 7:30am followed by a pilot’s meeting at 9am.  Then pilots ready their gliders and typically launch around 11 am and normally return by 6pm.  Group dinner is normally at 7pm in the hangar and everyone has a chance to get enough sleep to go at it again the next day.

Days off are usually spent hiking or hanging out with your soaring friends.

The fact that there are far more pilots interested in joining the Parowan Camp than there is available space to accommodate them demonstrates the appeal and attractiveness of the format.  Pilots are experienced XC pilots who are looking for a great soaring experience with friends, rather than for 2 weeks of hard core racing.

Parowan is not a substitute for the competitive racing circuit but an excellent complement.  Many pilots I talked to wish that despite the quirks and current shortcomings of the Williams Trophy there would be more events like it.

The “Competitive” Advantage of a Motor Glider – My Adventurous First Season with the V3M

Most recently I explained why I chose a V3M as my first self-launching motor glider. This article explores what it means to me to fly one.  Everyone can readily see that motor gliders bring independence from tow planes: pilots can take off when they want and from where they want.  But does the impact go further than that.  My initial experience shows that, yes, it does.

The Psychology of Flying a Motor Glider

Motorized gliders have stirred emotions since they became a thing more than 50 years ago.   Although some 90% of new gliders are now equipped with engines, some purists still seem to consider them cheating machines that help the feeble-minded obtain an unfair advantage.  In response, defensive motor glider pilots have suggested that the greater fixed ballast and the necessarily higher decision altitude for land-outs might actually slow them down.

In my mind this squabbling is not only fruitless but it largely misses the point.  There are many differences among gliders (e.g. wing profile, wing loading, winglets, instrumentation, fuselage design, etc…) that can give a pilot a competitive advantage without igniting a philosophical debate.  And with all other things (including wing-loading) being held equal, it is difficult to see how the mere presence of a motor could make one glider go faster than another.

Nevertheless, after my first season in a real motor glider (the turbo sustainer in my prior V2cxT was of limited practical use at the lofty altitudes of Colorado), I can say that having a capable motor does in fact make a big difference.

No, it does not affect how fast I can go, but still, it is of great relevance to me.  The effect is psychological. Think of it this way: what if you had a pre-paid, dedicated, and selfless ground crew automatically following you around on every flight? And what if that ground crew also possessed a magic wand to instantly fix any damage that your glider might incur during a potential landout?

Neither the crew nor its magic wand would make your glider go any faster. However, its constant presence would certainly make you more willing to conduct flights that you would not attempt otherwise.  That’s what the presence of an engine does.  The effect is in your brain.

I should add a caveat:  since engines are still not working as reliably as we’d wish them to, you have to allow for the possibility that on some random occasion your crew and its wand would simply fail to show up even though you expect them to come along every single time.  This caveat is important because it forces motor glider pilots to always keep a safely landable field in glide just like any pilot of a pure glider.

Also, lest anyone gets carried away by their imagination, even the most reliable motor is not a “bail-out device” when conditions go south.  Sometimes I see comments on accidents reports such as “why didn’t the pilot use the engine?”  Usually there is a good reason for that.  E.g., in my V3M, one of the best climbing motor-gliders, the best climb rate is between 400 and 500 fpm.  Now imagine flying into an area of heavy sink.  Downwind of mountain ridges, in a microburst event, or in the sink zone of mountain wave, downdrafts routinely exceed 1000 fpm and can be as severe as 3000 fpm or even more.   What good would the engine do in such heavy sink? Attempting to use it would only make a bad situation worse because it dramatically limits your speed range, effectively forcing you to stay in sink much longer than otherwise necessary.  In my V3M, the best climb rate is attained at 54 kt.  Try to go faster and the engine will overspeed and you will no longer climb.  Go faster still and it may shut off altogether, turning a 55:1 glider into a 15:1 flying brick. The best thing to do in heavy sink is to keep the propeller tugged away, put the nose down, and fly out of the sink as fast as you can, near redline if necessary.  But do not look to your engine for help!

So, why then does the mere presence of a capable engine make so much difference?  Let’s consider some real examples.

Flights that Would Not Have Happened Without An Engine

In my first season with the V3M I can identify numerous flights that almost certainly would not have happened the same way if I did not have a motor glider.

Roundtrip to Utah – 1154 km

On June 13, 2024 I became the first pilot to fly from Boulder to Utah and back in a single flight.  My declared turn point was Mount Peale, the highest peak in the La Sal Mountains, just east of Moab.

On the first 300 km or so having a motor made no difference.  I was flying over familiar terrain, there were reasonable clouds and I was confident of a viable return. Things changed after I had gotten low near Montrose and with another 100 km to go to my turn point.

The Uncompahgre Plateau ahead was overdeveloping and I had to find a line between virga shafts to get to my turn point and back.  There was no way of knowing whether this would work or not.  I decided that continuing would not be unsafe because the cells were scattered and there was (yet) too little vertical development to create a risk of thunderstorms.  However, it was also far from certain that the weather would hold up long enough to also permit a safe return.

Just after crossing the Uncompahgre Plateau. Mt. Peale is the the snow-topped peak directly ahead. Hopkins Field is a few miles behind me.

Safety on the way out was assured by the proximity of Hopkins Field which I would be able to keep in glide at all times.  But I had to be mindful of the possibility that the weather would further deteriorate and force me to land.

What does this have to do with the engine?  Well, nothing or everything. It depends how you look at it.

Consider that there are no tow planes at Hopkins Field (or at any other airport in the area).  The shortest road distance between Boulder and Hopkins is 368 miles and it takes about eight hours to get there, perhaps more when pulling a glider trailer. One way.  If I were to land at Hopkins, I’d have to spend the night and the earliest someone might be able to come and get me would be in the afternoon on the next day.  Provided I could rally a volunteer to get on the road for 16+ hours.

Hopkins Field, like much of western Colorado, is in a pretty remote place. There are a few small private hangars at the airfield but otherwise no infrastructure. Definitely no rental cars.  The only restaurant is a three mile walk away to the village of Nucia, population 585. Nucia has no hotel and only one Bed and Breakfast place with 4 rooms.  These could easily be sold out.  Would my cell phone work on the ground?  Unlikely.

Now be honest with yourself: let’s say you estimate the odds of having to land at Hopkins Field at 50:50, would you continue on without an engine?  You might say, sure, that’s part of the adventure of soaring. In this case, having an engine really does not matter to you. And I greatly admire your attitude and spirit of adventure.

For me at least, the impact is profound. Thanks to the engine, my thought process went about like this: it’s quite possible that I sink out and have to divert to Hopkins.  In that case I’d start my engine over the airport and then look for a way around the virga cells to the north.  In all likelihood I will be able to reconnect with lift, stow the engine away and continue my flight, heading back home.  The risk of having to land and spend a night or two in Nucia would drop from 50% to perhaps 2 or 3%.  To me that’s a totally different equation which made it easy for me to continue with the flight.

Such thoughts helped me continue on and everything worked out just fine.  I made it through between the virga cells, I did not have to divert, I rounded my turn point, and I had a successful flight back to Boulder.  Towards the end I was even able to extend the flight into Wyoming and thereby became the first pilot to fly from Boulder into Utah and Wyoming in a single flight.  My 1154 km flight included a 928 km FAI triangle and was good for 1174 points on WeGlide.  It was the longest flight in the world on that particular day. All of this could have been accomplished without an engine and the flight would have been neither faster nor slower.  However, most likely I would not have done it at all.

You can find the flight trace and my post-flight report here: https://www.weglide.org/flight/417542

Across the Great Divide Basin – 864 km

On July 5, 2024 I became the first pilot to fly from Boulder across the Great Divide Basin to the foot of the Wind River Range and back to Boulder.  The scenery was absolutely spectacular.  Very few people are familiar with this area. Even most Coloradans have never been there.

The aptly named “Ferris Mountain” along the northern rim of the Great Divide Basin in Wyoming.

Prior to this flight you could search the entire flight history from Boulder on OLC and only find a handful of flights that ever even entered the Great Divide Basin of Wyoming. And not one of them went beyond glide range to Rawlins’ airport.

There are good reason for that: the Great Divide Basin is a dry, desolate, and windy place.  More than 10,000 square kilometer in size, it has a population of 203, concentrated in the only “town” of Wamsutter, essentially a refueling stop along Highway I-80.  Although it’s median elevation is 6500 ft MSL, the Basin is surrounded by higher terrain such that precipitation cannot flow to the sea.  If there was enough water, the Basin would be one big lake. But there isn’t and the Basin is a dry, dusty, desert.

The idea of perhaps having to land in the Basin is not exactly pleasant.  The terrain is undulating and scarred by drainages. The ground is rocky and sandy and mostly covered by sagebrush.  There are no people, no infrastructure, and the only roads are dirt tracks, most of which are only traversable by off-road vehicles.

Typical dirt track through the Great Divide Basin. Source:https://thetrek.co/continental-divide-trail/wyoming-great-divide-basin-july-13-16/

Putting a glider down in this terrain is unlikely to kill or seriously harm the pilot. The glider, however may not  get off so easily. Who knows if and when you’ll be able to use it again.  You might also be out there for a while.  In addition to a satellite communication device, you better bring sufficient water, food, and warm clothing. The nights in the desert can get cold, even in summer.

Like other desert regions (e.g. in Namibia, Morocco, Nevada, etc.), the Basin can be a great place for thermal soaring.  However, the wind can be a limiting factor for it often blows so hard that it rips the thermals apart.

Over the past few years, I have often thought about flights across this area. I even spent hours on Google Maps looking for areas where dirt tracks are straight enough, and the terrain flat enough, to limit the hazards if forced to land out.

But I didn’t actually do it until I had a capable motor glider. What made the difference?  Even on a good thermal day marked by cumulus, I was not comfortable that I could reduce the risk of a landout far enough to fly across this terrain.  For me, personally, even a 2 % risk of a landout (a 1 in 50 chance) is too great for a flight over such forbidding terrain.

How does the presence of a capable and relatively reliable engine (such as the one in my V3M) change this equation?  It’s important to realize that it cannot eliminate the risks.  Let’s say the risk of an engine failure is 1% (i.e. the engine won’t start in 1 out of 100 attempts), this reduces a 2% risk of a landout (a 1 in 50 chance) to a 0.02% risk (a 1 in 5000 chance).  In my subjective assessment this is low enough to be acceptable to me.

I respect anyone who draws different conclusions for themselves.  If you watch the (in)famous soaring movie “The Sunship Game” (which features competition flying over similar terrain in Texas), you’ll see that for some pilots a 2% risk of having to land somewhere where they might wreck their glider is clearly perfectly acceptable.  (If you’re one of them you also won’t need a motor glider.) Others will say that even a 0.02% risk is too high for them.

I’m not judging either the one or the other and I am certainly not saying that my own assessment is the one to adopt.  Ultimately everyone has to make their own risk assessment and be comfortable with it.  I would just remind everyone that soaring is a relatively dangerous sport where we can work to minimize the risks but we cannot possibly reduce them to zero.  We are likely to make better decisions if we do our best to understand them for what they are and remain honest with ourselves as to what’s acceptable (or not acceptable) to us.

You can find the flight trace and my post-flight report here: https://www.weglide.org/flight/430267

Pushing From First Lift Until Sunset – 1286 km

On July 12, 2024 I succeeded in surpassing the greatest 6-leg distance ever flown from Boulder with a 1286 km flight including a 928 km FAI triangle.  The flight was good for 1353 points on OLC and 1282 points on WeGlide.

During this flight I was always able to keep airports or landable fields in glide and there’s no question the same flight could have been safely done in a pure glider.  Still, I don’t believe that I would have done it if I didn’t have a motor glider.

I’ll illustrate this by highlighting three particular phases of the flight:

Phase 1: timing of the start.  The day was late to develop.  The wind was howling from the NNW.  There were no thermals yet, and my first climb of the day was in rotor lift over the lower foothills, just west of Boulder.  I could see the first thermal clouds far to the south, approx. 40-50 miles away.  Perhaps, I thought, my 14,000 ft altitude (~ 6,000-7000 ft above the foothill terrain) would be good enough to get there, thanks in part to the ~20 kt tailwind. But I could not be sure.

Should I start on task  immediately or should I wait another 30 minutes or so for the convergence to work and the wind to calm down a little?  If I wanted a chance at a record distance flight I could not waste a minute.  But what if I didn’t connect with the lift to the south before I would run out of altitude?  There are no airports in this direction and coming back into a 20 kt headwind would not be an option either.  In other words, in a pure glider I would have no choice but to land in one of the farm fields south of Chatfield Reservoir, or perhaps at the nearby RC airplane field as one of my friends had done the year before.  In either case, a great soaring day would be over before it had really begun.

Thanks to the engine of the V3M, my calculation was different.  There was the same risk that I would not connect with the lift to the south in time. But if that happened, instead of landing out, I would start the engine above one of the fields, motor to the clouds, and re-start my soaring flight from there.

Phase 2: flying into a poor airmass. After I had passed Crested Butte on my second leg, heading into the north-westerly wind, I could readily see that a murky airmass lay over the Colorado River Valley.  I had previously rounded my first turn point and was still hopeful that I could complete my declared 1050 km FAI triangle.  But to have a chance, I would need to fly into the murky, thermally unreliable air ahead.

I had no idea if it would work and the only way to find out was to try.  Garfield County airport at Rifle was in easy glide so there was no safety risk.  But would I have left the good air behind, had I been in a pure glider?  Chances are that I would have quit my attempt at a record flight and changed directions to stay in better air to not risk the considerable inconvenience of a ground retrieve for myself and for others.

At Crested Butte, heading NW. This is before the air turned murky (which happened at the horizon above in the distance).  When I entered the poor air near the Colorado River I was so busy flying that I didn’t even think about taking pictures…

Phase 3: pushing until sunset.  When I came back to Boulder on my fourth leg it was already past 6pm and I had been flying for 7 1/2 hours.  Should I continue to fly away from Boulder again to add another two legs just to see how far I could push it?

The convergence line to the south looked promising but how long would the lift last?  Without an engine, my practice in the past had been to stay within glide range of Boulder when extending my flights in the evening when there was a chance that the thermals would quit on me.  In a pure glider that’s the only practical way to eliminate the risk of having to land in some farm field right when the sun goes down, perhaps forcing me to spend the night in the cockpit.

Again, the equation is subtly different in a motor glider.  Thanks to having an engine I only needed to time my last turn such that I could still get back home under power before the sun would officially set.  On this particular flight this calculation allowed me to fly just a little further to the south – perhaps by 30 km or so – than I otherwise would have.  But those 30 km represent a 60 km roundtrip.  And without these 60km, my 1286 km flight would not have broken the prior 1254 km record for the greatest distance flown from Boulder.  The thermals lasted until the end and the same flight could have been achieved in a pure glider as well.  But somehow I doubt that I would have done it.

You can find the flight trace and my post-flight report here: https://www.weglide.org/flight/434838

Other Examples

So far we looked at three examples of flights that probably would not have happened this way without an engine. For those interested, there were at least three more that you can look up:

1026 km on August 3:  completion of the Colorado Border-to-Border Challenge via an unusual route along the Southern San Juan Mountains. Without engine I would likely not have continued to my first turn point.  https://www.weglide.org/flight/455212

Weak conditions near the southern border (7 road-hours away from Boulder) would have made me think twice about continuing without the backup of an engine.

856 km on August 16: perhaps my most difficult flight to date in very challenging conditions with low thermal tops, strong winds, and big stretches under blue skies without any thermal markers. This flight was very satisfying because I was trying things I hadn’t done before even though there was never even a remote chance of breaking any records.  I definitely would not have done it without engine. https://www.weglide.org/flight/467435

Low thermal tops and largely blue skies over the Flattops: flying here wasn’t unsafe but the risk of a landout far away from home was substantial.

709 km on Aug 27: this flight included an (ultimately unsuccessful) attempt to ridge-soar the Northern Sangres (which I would not have tried without an engine). https://www.weglide.org/flight/474491

What Do All These Flights Have in Common?

Reflecting back on all of the flights that “would not have happened this way” without an engine, there are essentially two reasons for that:

(1) Flights I would not have executed this way because of a significant land-out risk that would have resulted in great inconvenience.  This was the case in the vast majority of the examples provided.  All of these flights can happen just the same in a pure glider if the pilot’s motivation to complete them is so great that he or she is prepared to put up with the inconveniences in case of failure.  If you are willing to do them regardless (and I know there are pilots who readily will), you can feel free to judge me for my lower tolerance of inconveniences or my comparatively inferior ambition and motivation.

(2) Flights I would not have undertaken because they led across hostile terrain with very poor landout options.  The only flight that falls into this category is the one across the Great Divide Basin.  This one, too, could have happened with a pure glider, but failure here has greater consequences than mere inconvenience since it could easily result in damage to the aircraft.  Having a reasonably reliable motor reduces this risk by almost two orders of magnitude but it does not eliminate it. Whether to conduct such flights does not just require comparing your motivation against your convenience but also against your risk tolerance.

What About the Impact of the Engine on Speed?

In 2024 I also set three new state speed records:

Open Class 750km Speed Triangle in Utah: https://www.weglide.org/flight/422726

Open Class 500km Speed Triangle in Colorado: https://www.weglide.org/flight/476006

Open Class 750km Speed Triangle in Colorado: https://www.weglide.org/flight/478660

It’s a fair question to ask what role, if any, the engine played in these flights.

In the case of the 500 km speed triangle in Colorado, I think the presence of the engine had no impact whatsoever.  There were good thermals marked by clouds, bases were high, and I never perceived there to be a real land out risk.  There is no doubt in my mind that this flight would have happened just the same, with or without engine.

Excellent thermal conditions during my 500 km Speed Triangle run.

In the case of the 750 km speed triangle in Colorado, I am inclined to come to the same conclusion even though this flight was more challenging due to the lower cloud bases, which kept me below 16,000 ft for the first two thirds of the flight. Ultimately, however, I believe that my motivation was strong enough that even in a pure glider I would have overcome the relatively small doubt that I may have had about my ability to continue the flight to completion.

Relatively low bases, but plentiful thermals kept the landout risk very low and helped me achieve the 750 km Colorado triangle speed record.

The case of the 750 km speed triangle in Utah is a different matter.  The route led over very remote terrain in the Great Basin that I was not familiar with.  I had done my homework and knew where I could safely land. I was also careful to always keep a landable place in glide.  However, good stretches over the Great Basin were entirely blue. Without a crew, landing in the Great Basin would have been a major inconvenience.  So it is fair to assume that I would not have done this flight without an engine.

Good lift but completely blue skies over the inhospitable Great Basin on the border between Utah and Nevada.

Therefore, in my assessment, I think it is fair to say that the engine does provide an advantage in the sense that even some speed record flights would simply not have happened if the pilot had to fly a pure glider.

On the other hand, I still believe that that the presence of the engine has no real impact on the attainable speed.  Unquestionably, the glider does not fly faster because it has an engine. Plus, importantly, the presence of the motor did not make me press any harder on any of these flights than I would have done without it.

What About Other Benefits of Motor Gliders?

Of course motor gliders afford other benefits to their owners.  Most of them are obvious because the motor makes you independent of a tow plane.  This means you can fly from where you want and when you want. This sense of independence is the main reason why pilots are willing to shell out a lot of money for that noisy contraption behind the cockpit.

This article doesn’t attempt to list all benefits and disadvantages of motor gliders.  (And yes, the disadvantages exist, too.  Think much greater complexity, more involved maintenance, higher costs, etc.)  This article only explored the more subtle question whether motor gliders provide a competitive advantage.

Conclusion

Do motor gliders provide a competitive advantage over pure gliders?  In my view the answer depends on what you mean by “competitive advantage”.

Based on my first season with the V3M I am confident that the motor does not make me faster. If that’s your definition of competitive advantage, the answer is “no.”

However, the very presence of an engine has surely helped me undertake and complete flights that I would not have executed the same way with a pure glider.  To me this is a powerful benefit that makes me glad I spent all that extra money even though in Boulder we normally have easy access to a tow plane.

Could this advantage play a role in a contest?  I think it can.  Imagine a day where the land out risk is very high.  Some pilots may not decide to fly the task at all or return prematurely.  It would be easy to see that those would be the ones that neither have an engine nor a crew ready to bring them back.

Which brings me back to the beginning.  Having an engine is like having a crew that’s ready and willing to follow you around.  If having a crew in a contest is unfair, then having a motor is unfair, too.

Perhaps future seasons will allow me to form a more nuanced view. In the meantime, I’m curious about your perspective.  Please share it in the comments below.

Why Did I Buy a V3M? Plus: Was It the Right Choice?

Now that my Ventus 2cxT has found a new home, I’m ready to share the reasons that led me to buy a new Ventus 3M directly from the factory.  It’s not often in life that we get to splurge on a hobby like that so this was a carefully considered decision.  In this article I share what led me to this decision. Plus, now that my first season in the new ship is behind me, I have a better perspective on whether it was the right choice for me.

High speed low pass of my new V3M “CC” during its inaugural flight at Warner Springs, CA. Pilot on this flight was U.S. Schempp-Hirth dealer Garret Willat.

My Decision Criteria

    • XC Performance. I was very happy with my Ventus 2cxt.  However, at high speeds the V2 could not fully keep up with the latest generation of 18m and 21m gliders (JS3, JS1, AS33, V3) and I was hoping to be competitive should I decide fly in contests. Although it’s natural to focus on performance, it’s necessary to consider other criteria as well, some of which may actually be more critical, depending on the circumstances.
    • Self-launch from high-altitude airports, not just from Boulder but also after a possible landout at another airport. Boulder is at 5,300 ft, Salida at 7,500, Leadville at 10,000. The density altitude can be several thousand feet higher.  Boulder conditions often require long tows or motor runs with climbs to >11,000 ft under power to get out of the inverted airmass over the eastern plains and into the buoyant mountain air.  Plus, I wanted sufficient energy for self-retrieve when necessary, including the ability to climb to >13,000ft to cross high mountain passes.
    • Access to quality service and maintenance. I am neither a mechanic nor a “tinkerer” and rely on professionals.  For motorized gliders where your life depends on the engine running reliably, this is a major consideration.
    • Quality workmanship. New glider models and/or new engines often suffer from teething issues and its not until a substantial number of a particular model have been built, that these issues are worked out.
    • Easy rigging and ground handling. There are no hangars for gliders in Boulder and tie down space is limited.  Easy rigging is therefore a necessity, not just something that’s nice to have.  Heavy motor-gliders also need a steerable tailwheel to operate without assistance, e.g. after a landout at another airport. It took me a while to realize just how important this is.
    • Value retention. Quality gliders tend to retain their value remarkably well, especially if they meet the other criteria above.

Options

The considerations above narrowed my list to the following four options:

    • JS3 RES: 15/18m with electric self-launch engine

    • AS 33Me: 15/18m with electric self-launch engine

    • AS 35Mi: 18/20m with IAE 50R-AA Wankel 41 kW self-launch engine

    • V3M: 18m with Solo 2625 01i 45 kW two-stroke self-launch engine

Note: Neither the V3E nor the JS2 were announced at the time I made my decision (see below).

Decision Process

In my heart I was heavily drawn to electric self-launchers, which would have meant a choice between the JS3 RES (which was already available), or the AS 33ME (which had been announced but none had been built at the time).  The V3E had not yet been announced.  It would definitely have made it into my consideration set.

Electric engines are much simpler and require less maintenance, they produce lower noise than combustion engines, and are much more eco-friendly.  All of these greatly appealed to me.  The climb performance is also quite strong, at least for take off when the battery is fully charged and not too hot.  However, the more I researched, the more my heart had to yield to my brain: I came to the conclusion that electric gliders were not (yet) ready for my critical use cases. While they had sufficient energy for a self-launch, even to 11,000 ft,  they would then not have enough energy left for a second self-launch at another airport (following a possible landout). In addition, the chargers were too bulky to bring along in the cockpit.  Even taxiing needed to remain limited in order to conserve power and prevent the battery from overheating. (This may have been a reason why Schleicher does not even offer a steerable tailwheel for its electric self-launchers, the AS33Me and the AS34Me.)  Similarly, I was concerned that the energy remaining after a typical self-launch from Boulder would not suffice to cross one of the tall Colorado mountain passes in order to self-retrieve.  These had been real practical constraints that I experienced with my Ventus 2cxT with its sustainer engine that I was determined to get away from.

Once I had come to the important conclusion that electric gliders simply did not sufficiently address my use cases yet, my choice narrowed down to V3M and AS35Mi.

The AS35Mi will be the successor of the very successful AS31Mi.  The emphasis here is on will be because at the time I made my decision none had yet been built.  Two years on, I believe this is still the case.  In addition to timing I was also concerned about takeoff performance.  The AS35Mi will have the same Wankel engine as the AS31Mi and the AS32Mi (a two seat self-launcher).  While the engine is certainly adequate for the AS31Mi, in the heavier AS 32Mi it is at best marginal at Boulder’s field elevation.  (I had first hand experience from flying one with a friend.)  Given that the AS35Mi will be considerably heavier than the AS31Mi (at least at maximum takeoff weight), I became concerned about its takeoff and climb performance at high-altitude airfields such as Boulder. All that plus my aversion to buying a glider with a low serial number (because initial kinks are likely inevitable) made it easy to focus my attention on the V3M.

Evaluation

Now that I have flown the V3M for more than 200 hours, I have a good sense how it holds up to my criteria.

XC Performance.  Because the V3 has a slightly greater wing area than the JS3 or the AS 33, fully ballasted it may not run quite as fast.  (Although Simon Schröder’s 2nd place finish at the World Championships in Uvalde shows that the V3 can certainly keep up with the JS3 and AS33.)  However, even if there may be a small difference in booming conditions, days when full ballast is beneficial from morning to late are few and far between. I concluded that in practical terms this simply isn’t a significant issue.  I routinely fly the V3M about 5-10 kt faster that the V2 without noticing any degradation in glide performance.  This is a substantial improvement and is confirmed by the statistics:  my average XC speed in 2023 (flying the Ventus 2cxt) was 109 kph, whereas in 2024 (with the V3M) it was 118 kph.  While some of this may be due to continued pilot improvements, a more than 8% improvement is remarkable!  In thermals the V3M is even easier and more stable than the V2 (which requires more rudder to remain coordinated).

Self-launch from high altitude airports.  There’s nothing that can beat the V3M in climb performance except for highly powered airplanes without glider in tow.  The water-cooled and fuel-injected Solo engine runs great at our altitude.  I out-climb not just all other self-launchers at the field – especially the Wankel powered AS gliders – but even the 265hp Pawnees when they have a glider in tow.  My climb rate is typically in the range of 400-500 fpm and only drops to 300 fpm above 10,000 ft.  Even at 13,000 ft it still runs smoothly and continues to climb at rates around 200 fpm.

Access to quality maintenance.  While I wish that U.S. Schempp-Hirth dealer Garrett Willat wasn’t as far away as Southern California (a two-day drive from Boulder) I have to give him very high praise for responsiveness and quality of service.  There are now at least four Ventus 3Ms in Colorado and this may make it easier to coordinate maintenance in order to get work done in Colorado rather than having all of us trailer our gliders to California.

Quality workmanship.  I’m really happy to have a glider with a serial number >200 and Schempp-Hirth has been living up to its great reputation for finish quality.  So far, everything has been working as expected.  Talk to other motor glider owners to find out how unusual this can be.

Easy rigging and ground handling. All motor gliders are heavy and the V3M is no exception.  However, thanks to a high quality Cobra trailer, rigging is just as easy as for the Ventus 2.  A lifting aid is required to mount and remove the tail dolly which is a bit of a nuisance.  The steerable tailwheel turns out to be even more essential than I had imagined:  it allows me to get into the cockpit at my parking position and conduct all pre-flight checks before taxiing onto the runway for immediate takeoff.  Upon landing I can clear the runway and steer the glider right into its parking position before getting out of the cockpit, usually without having to start the engine at all.  At our busy airport these are real safety benefits and not mere conveniences.

Value Retention.  15/18 m gliders from Schempp-Hirth and Schleicher have both done very well at retaining their value and I am confident that this won’t be any different with the V3M.

What If I Were Deciding Today

There’s no question in my mind that I made the right decision when I sent off my order 2+ years ago.

Since then, two new options have become available:

    • V3E: 18m electric self-launch

    • JS2 18/21m with Solo 2625 02i 47 kW self-launch engine

I still think that electric self-launchers are premature for Boulder and my specific use cases.  However, if I were to consider an electric glider I would want to have the batteries in the fuselage (for easy charging and also to remove them during the very cold Colorado winter) and I would insist on a steerable tail wheel for taxiing.  These attributes would give the Ventus 3E an edge over the AS 33Me and the JS3 RES for my personal use cases. However, since electric gliders remain out for me, my choice would be between the V3M and the new JS2.

The JS2 18/21m is a brand new option that I would consider carefully against my criteria.  It is likely that it would score highly on performance (likely beating the V3M in 21m configuration) and I would enjoy that it provides the option of flying with 18 and 21 m wings as this would give me the option to realistically compete in Open Class as well as in 18m class.

With essentially the same Solo engine as the V3M it is likely just as powerful as the V3M on self-launch capability (Jonkers claims to get 2 additional kW out of it) .  Likewise, rigging and ground handling are likely similar in complexity.  I don’t have enough experience to speak to maintenance and local service capability and I would want to do my due diligence by talking to other JS owners to satisfy myself before taking the plunge.  There’s also less history to assess value retention over time but I suspect Jonkers gliders will do just as well as long as the company continues to prosper.

My main concern would be about buying a glider with a low serial number.  While the wings are proven from the JS1, the fuselage is new and my understanding is that Jonkers made additional modifications to the engine.  I’d definitely feel better if there were at least a few dozen gliders already in use with the same engine and the owners reported being satisfied with it.  Nevertheless, the glider is in my view the most viable alternative to a V3M and I would give it careful consideration.

My Advice

High performance gliders have never offered more performance and more convenience and safety features.

For anyone lucky enough to afford one of these beauties, my main advice is to be honest with yourself and carefully consider your specific use cases and their relative importance to you before you make a decision.  If winning the world championships is your ultimate objective and you’re willing to do what it takes to get there you may make a different decision than if your primary objective is to achieve great flights from wherever and whenever you want.

In any case, there are great choices to make.  Enjoy the process.  Be inspired and dream.  But also, be realistic. You’re not buying a car with an 8 or 9 digit serial number and a nearby dealership that can fix any potential issue within a few hours. Gliders are still hand made, and when you buy a low serial number machine you are essentially buying a prototype. Maybe that is exactly what you want. But maybe you’re like me and value the incremental reliability of a serial number greater than hundred more than the 0.1% performance improvement a retractable (but not steerable) tailwheel may afford.  If you rarely need more than a 2000 ft tow and have easy access to a hanger with electricity than an electric self-launcher may be perfect for you.  But maybe not.  Although all these gliders are amazing machines with similar performance, try to fully understand what you’re committing to when you put your name on that dotted line…

Whether you’re contemplating getting a new glider or have a different perspective or diverging decision criteria, please feel free to share your perspective in the comments.

Ventus 2cxT “V1” Now For Sale, Ready to Fly

Edit (November 2024): V1 has found a great new home and will continue to soar high above the American West. If you’re looking for a similar high performance glider, look at the classifieds on Wings and Wheels. You can also contact the various airplane dealers as they may know in advance of gliders that may come onto the market. Good Luck!

If you’ve been following me on Facebook, WeGlide, or OLC you’ll know that I have recently taken delivery of a new Ventus 3M.  This means that my trusted Ventus 2cxT, the glider I’ve flown in all my YouTube videos, is now for sale.

“V1” is an amazing sailplane.  Please click on the links below to learn more about it. The information provided should answer most of your questions. If you think you want to own this beautiful glider or if there’s something else you want to know first, please contact me at ChessInTheAir@gmail.com.

Adventures Await

Click on the images below to learn more about the glider, the instrumentation, and the trailer:

The Glider

https://chessintheair.com/the-ship/

Instrumentation

https://chessintheair.com/instrumentation/

The Trailer

https://chessintheair.com/the-trailer/

Contact

The glider is available for inspection and pickup at the airport (KBDU) in Boulder, Colorado, USA.

A refundable deposit check of $1,000 holds the glider for inspection or 10 days. If more time is needed for inspection please contact me to arrange as needed. A cashier check made payable to “Clemens Ceipek” closes the deal.

Asking price for the entire package (glider, trailer, instrumentation) as described is $124,500.

The glider and trailer are in very good condition – just as as described. The reason for selling is that I have recently taken delivery of a new Ventus 3M.

If you think you would like to own this beautiful glider please contact me at ChessInTheAir@gmail.com

Only serious enquiries, please.

Clemens Ceipek

Here are some of the beautiful places where this glider has been. Where will you take it?

You can find full details of my flights with V1 on WeGlide at: https://www.weglide.org/user/2037

My Soaring Goals for 2023

After another successful soaring season in 2022, here are my goals for 2023.

If you’re interested in setting your own soaring goals, you can find some tips towards the end of this article from last year.

1. Stay Safe by always heeding my own advice.

This goal remains unchanged.  Flying safely is essential and the pre-requisite for anything else.  Pilots often let their safety margins erode as they gain experience.  I now have more than 1000 hours in gliders and I know that I must not let that happen.  Here are the metrics I will  continue to use:

    • Zero accidents (no damage)
    • Zero near misses or other incidents (i.e., almost accidents)
    • Zero violations of personal minima and zero “99% safe” maneuvers (e.g. low safe attempt below personal minimum)
    • Zero flights where a safe outcome depends entirely on Plan A working as hoped (i.e. I must have a viable and safe Plan B/C at all times; the alternative plan must include a known safe place to land at all times)
    • Zero takeoffs without a clear pre-defined emergency plan specific to the airport and conditions of the day

2. Continue to Improve My Soaring Skills

I will continue to focus on the metrics that matter most to performance soaring: cruise and climb performance.   My objective is to make further improvements against my own performance in comparable conditions rather than to achieve specific absolute performance numbers or rankings.

    • Continue to improve my glide performance in cruise flight (performance goal)
      • The key to improving glide performance is to become even better at flying in rising air during cruise portions of the flight.  I believe I can continue to do so by building my habit of using S-turn explorations along energy lines to find and follow the best rising air, basing decision primarily on evidence of the day and less on perceived prior experience.
      • The best way to track progress is through the “netto” value.  Unfortunately this metric is usually not easily available.
      • I will use the following metric as a close proxy:  In 2022 my average glide ratio on legs 2, 3, 4, and 5 (excluding 1 and 6) was 81:1 while cruising at 178 kph.  An improvement would be either an improved glide ratio at the same speed, or a greater cruise speed while maintaining the same glide ratio.  Either one would mean that I am getting better at flying in lift.  I.e., I will measure my progress by tracking the product of these two numbers.  The 2022 benchmark is 81×178 = 14,418.  I would like the 2023 value to be 14,750 or greater.  E.g., this would mean increasing the cruise speed to 182 kph while maintaining the same glide ratio of 81:1 (or increasing the glide ratio to 83:1 at the same cruise speed.)
      • My flight analysis suggests that my inter-thermal cruise speed is well below that of other pilots flying similar gliders.  I will therefore try to primarily increase the cruise speed, without overly sacrificing glide ratio.
      • I will only use flights in Colorado to calculate this benchmark to avoid distortions.
    • Continue to improve climb performance (performance goal)
      • I will try to improve my thermalling performance by further tightening my turns with the goal to reach 39-41 degrees on average (the 2022 average was 37 degrees).  I will also try to improve my thermal exit: omit the unnecessary last circle near the top of the thermal (or airspace); and complete the last circle with steep bank, then accelerate (do not become sloppy in the last turn and begin to accelerate within the surrounding sink during the turn.)
      • I will measure overall progress by tracking my average achieved climb rate.  In 2022 it was 2.15 m/s during legs 2, 3, 4, and 5 (excluding legs 1 and 6) of all my flights.  I will seek to improve on this benchmark in 2023.
      • I will only use flights in Colorado to calculate this benchmark to avoid distortions.
    • Reduce thermaling attempts (performance goal)
      • Thermalling attempts during legs 2, 3, 4, and 5 (excluding legs 1 and 6) of all my flights accounted for 2.32% of my flight time.  The average climb rate during these attempts was 0.37 m/s.  I would like to reduce the time spent on thermalling attempts to less than 2% of the total flight time by being more selective when to turn.

3. Flight Achievement Goals

I will apply these skills towards attaining a set of specific flight achievement goals. I continue to be more interested in completing interesting and challenging flights than in competing in set competition tasks. However, I am considering to fly in one or two contests; this would also provide more comparative metrics on my performance.

Because specific flight objectives are necessarily subject to suitable weather conditions I will not limit myself to a few specific goals but continue to take a portfolio approach.  I.e.,  I will aim to accomplish five of the following objectives:

    • Distance Objectives:

      • Reach some of the San Juan 14ers and/or the Blanca Massif 14ers from Boulder; Stretch goal is to accomplish all 14er flights from Boulder.
      • Complete Border to Border Challenge (from Boulder to NM, WY, and return)
      • Reach another state line from Boulder (UT, SD, KS, OK, TX, AZ, MT)
      • Accomplish a one-way goal flight to a glider port in a neighboring state (e.g., Nephi, UT; Moriarty, NM; Hutchinson, KS, Driggs, ID)
      • One flight greater than 1100 km per OLC+ rules; my stretch goal is to break the Colorado state record of 1273 km
      • Top 20 in the global Barron Hilton Cup and/or top 10 in the US
      • Top 50 in global OLC+ Championship and/or top 25 in the US
      • Set another Colorado Distance Record (e.g., Goal Distance 340mi, 3TP distance 633 mi, declared O&R distance 489 mi, free O&R distance 578 mi)
    • Speed and Contest Objectives:

      • Set another Colorado speed record (e.g., 500 km Triangle Speed 81.45 mph; 300 km Triangle Speed 86.4 mph)
      • If flying in contests, finish among the top 33% in a regional contest; or among top 50% in a national contest.  (I am currently considering the Region 9 contest in El Tiro, AZ and the 18m Nationals in Uvalde, TX.  However, I have not yet decided whether to fly in any of them.)
      • When flying on Speed-League weekends from Boulder, score among the top 3 Boulder pilots 100% of the time.

4. Giving Back

Just like last year, I will continue to put energy towards inspiring others worldwide to join our sport, to develop, excel, and stay safe.  I will do this through:

      • Writing – follow me on ChessInTheAir.com and on Facebook
      • Presentations and Podcast Contributions – to local, national, and international audiences
      • Videos – subscribe to my ChessInTheAir YouTubeChannel, and
      • Serving for soaring organizations such as the Soaring Society of Boulder


Want to set your own soaring goals?  Take a look at the tips at the bottom of this article.

My Soaring Performance Review for 2022

A little later than planned, here’s a review of my progress against the soaring goals I had set myself for 2022.  Overall, I am pleased with my continued progress.

My 2022 Soaring Flights – the map shows the flights during the 2022 OLC season. Not shown are my three flights from Château-Arnoux-Saint-Auban in Provence, France where I did not have a suitable flight logger.

Goal #1 – Stay Safe by Heeding My Own Advice

I think I can give myself an “A” on this one.  In 2022, I flew more than 23,000 cross-country kilometers including 14,500 FAI triangle kilometers in 210 flight hours without accident or incident.  I also cannot recall a situation that was objectively dangerous or even subjectively scary.  I came close to landing out on two occasions but in both instances I had a suitable field picked out and within easy reach.  I want to keep it that way.

Goal #2 – Continue to Improve My Soaring Skills

This one gets a “B+”.  I flew 32 cross-country flights with an average flight distance per flight of 689 km.  I did not fly any contests last year which means that the magnitude of my improvement is a bit difficult to measure.  Among Boulder-based pilots I had the highest average cross-country speed at 116 kph for the year.  My average for the 2.5 hour Speed League Segments was 130 kph,  a major improvement over my 2021 average of 110 kph.  I think key contributions to my speed improvements were my focus on flying more precisely during cruise portions of the flight, and flying a bit lower along powerful lift lines to minimize situations where I had to destroy energy near the top of the permissible airspace.  This used to be a significant issue for me in prior years but only occurred rarely in 2022.

The table shows average values for my 32 cross-country flights in 2022

Of note is the glide performance for the entire year with an average achieved glide ratio of 64:1 across all flights while cruising at an average speed of 178 kph.  In still air, my glider’s glide ratio at this speed is 33:1 so I obviously did a reasonably good job at cruising in lift.  If I remove the first and the last leg of each flight (the first is usually focused on climbing out after tow release and the last one often destroys energy by returning high and descending with spoilers) my actual achieved glide ratio was even higher at 81:1 – definitely a key contributor to the good average speed.

My thermaling also got better.  I spent 22% of my flight time thermalling and another 2% in thermaling attempts.  My average climb rate for the entire year was 2.2 m/s (4.3 kt).  I still thermaled a bit more to the right than to the left but my comfort level with left hand turns improved considerably.  My average bank angle for all thermals throughout the entire year was 37 degrees, perhaps still a few degrees less from what many consider the “ideal” of 40 degrees.  My average thermalling speed adjusted to sea level was 102 kph, just ~3 kph above my glider’s stall speed at 37 degree bank and full wing loading (99 kph at sea level with flaps in neutral).   Considering that most thermalling is in flap position +2 (and not in neutral) I might still be going slightly too fast in the turns – but certainly not by much!

[Here’s the math for anyone interested: my actual average thermalling speed for the whole year was 134 kph at an average altitude of ~14,000 ft.  Adjusted to sea level this is ~102 kph depending on air temperature.  My glider’s stall speed in straight flight at max wing loading is 93 kph with flaps in neutral position.  At a bank angle of 37 degrees the load factor is 1.066 (1 divided by cos(37)), i.e. the turning stall speed with neutral flaps is 93 x 1.066 = 99 kph.  My actual altitude-adjusted speed of 102 kph is about 3 kph faster than stall speed with neutral flaps.  This is estimated 10 kph faster than stall speed with flaps in position +2.   The polar drops off sharply as stall speed is approached, so flying at 5-10 kph above stall speed in +2 flaps is probably ideal for circling so my average thermalling speed seemed to be about right.]

Some of my other specific performance goals turned out a bit hard to measure.   E.g., one important goal was to avoid weak thermals and measure this by calculating the time spent in weak thermals.  My specific target metric was to spend less than ~25% of thermalling time (after task start) in climbs that are less than 50% of the average climb rate for the day.

Unfortunately, I did not find an analysis tool that could easily calculate this. WeGlide provides the climb performance for each leg of each flight.  Looking at that, I could not find any glaring issues.  However, what would be needed is a tool that groups together the time spent in weak thermals and compare that weak thermal average to the thermal average of the day.  Perhaps a software provider could develop such a tool.  I would find it very insightful.

To get a better sense of the magnitude of my improvements I will need to fly more contests and obtain more direct comparisons with other pilots.

Goal #3 – Flight Achievement Goals

I can give myself an “A” in this category.  I had set the goal to achieve 5 of a portfolio of 12 ambitious achievement goals.  I accomplished 6 of them and overachieved on some of these goals:

The portfolio goals that I did not accomplish were:

  • Border to Border Challenge (Boulder to NM, WY and return) – tried and failed three times
  • Flight from Boulder to Nephi, UT or to Moriarty, NM – and returning the next day – never tried
  • In the OLC+ Championship worldwide I finished in position 68, missing my goal of getting into the top 50; in the US I finished in position 13, missing my goal of breaking into the top 10
  • In the OLC Speed Championship worldwide I finished in position 57, missing my goal of breaking into the top 50; and in the US I finished in position 20, accomplishing my target of breaking into the top 25.
  • I flew no contests in 2022.

My Speed League contribution was a bit mixed.  I only flew on 7 Speed League Weekends.  When I did, I managed to always score among the top three Boulder pilots, achieving my goal of scoring among the top 3 Boulder pilots at least 75% of the time.   Bob Faris made once again the biggest contribution to SSB’s Speed League result by flying on 12 weekends and scoring first 5 times.

Goal #4 – Giving Back

I would say this one gets an “A-“.  I did not write nearly as much as I had hoped but I was able to reach worldwide audiences with my presentations at Late Night Soaring and at the annual Austrian glider pilot’s convention.  I also presented to individual clubs and some of my articles were translated into French and Spanish.  In addition, a tremendous amount of work went into community work in Boulder to address local challenges as club president.

Coming Next: My Soaring Goals for 2023


Tow Plane Flies Too Slow – Glider Heavy with Water Ballast

A few weeks ago I had a scary situation when towing fully ballasted behind a Piper Pawnee.  I had my camera running and published a short instructional video about the incident. I hope that it helps others avoid similar situations in the future.  Here is the video:

The comments indicate that these incidents are relatively common and occur most frequently when the tow pilot is used to pulling very light gliders that only require a low tow speed. A clear and deliberate briefing of the tow pilot before the flight is essential. You can also find a similar incident in one of Bruno Vassel’s videos.

Moreover, Dave Nadler gave a safety briefing on this very topic a few years ago at a US Soaring contest.  In it he explains that the glider’s stall speed on tow is actually higher than it is in free flight.  And why the problem is exacerbated behind short-winged tow planes such as Pawnees.  Please take a few minutes to also watch Dave’s video.  You can find it here.

A few good questions came up in this context, which I would like to address here.

Why did you not release immediately?  Would you release if a similar situation were to happen again?

I’ve spent a lot of time thinking about this question.  At the moment I was too afraid that the glider might stall and drop hard to the ground if I pulled the release.

However, perhaps the safest response for everyone involved would have been the following:

    • Rather than trying to climb with the tow plane, I should have stayed in ground effect while communicating the request for a greater airspeed.  Staying in ground effect protects the glider from a stall because of lower induced drag.  It also reduces the consequences of a possible drop to the ground because of the very low altitude.
    • Hopefully the tow pilot would react before the glider reaches the “low tow” position.  (We don’t practice low tow in the US except when practicing “boxing the wake”. In some countries the low tow position is used more routinely for towing because it protects the tow pilot from a glider pulling the tow plane’s tail up and forcing the tow plane into the ground.)
    • Once the glider has reached the low tow position, and the tow plane continues to climb at an insufficient air speed, pull the release.  (Hanging on for longer would put the tow plane in danger.) Immediately release stick pressure and simultaneously move the flaps into landing configuration.  Land straight ahead and only extend the spoilers once the glider is on the ground.

This plan only works if there is enough runway left for landing straight ahead. In Boulder we definitely have enough space available.

My main concern with this strategy is whether staying in ground effect until the low tow position is reached could be pulling the tow plane’s tail down to the point where it becomes difficult for the tow plane to get its nose down and pick up speed.  However, considering that low tow is a normal tow position in some countries, I assume it should not be a problem, at least unless the tow plane itself is close to stall speed.

If you have additional thoughts on this subject, please add them in the comments below. I am especially interested to hear from glider pilots who normally fly in low tow position.

PS: Dave Nadler’s explanation is very compelling and illustrates that a glider’s stall speed is actually higher on tow than it is in free flight.  This gives me more confidence to release immediately in the future because releasing is unlikely to lead to an immediate stall because the stall speed comes back down.  So my plan is to release, release stick pressure while simultaneously moving the flaps into landing configuration, then land straight ahead with the spoilers closed (and only open them as soon as the glider is on the ground.)

“Faster, Faster, Faster” is not clear communication. It would be better to say “Up 5” or “Up 10” or “Up 15” or “Up 20” (which is what I needed).

Maybe.  The thing with urgent communications is that the best one to use is the one that is instantly understood.  I readily admit that “Faster!” is not precise and may sound unprofessional but I think it conveyed a sense of urgency that “Up 20” may not have.  I am also not certain that the tow pilot would have instantly understood and responded to “Up 20”.  The lesson here, at least in my mind, is that tow pilot and glider pilot should make communications part of the briefing so both parties are in synch on what language to use.  I’m curious what you think the best protocol should be when you need an instant reaction.

The communication should have included the call sign of the tow plane.

Yes.  In principle this is certainly true.  A clear and non-ambiguous communication would be something like “X-Ray Yankee Zulu, 10 more knots.” (And then ask for another 5-10 knots if necessary.)  However, in the stress of the situation I did not remember the call sign even though I had said it myself only two minutes earlier.  (We have 5 different tow planes at the field.  I’ll definitely try to remember it better the next time.)

Also, if you watch the video you’ll notice that I had to communicate in a fraction of a second while also considering all the other choices such as whether or not to release.  What mattered more than anything was a prompt ]reaction by the tow pilot. (Basically to level off or push the nose down and pick up speed).  Just saying the abbreviated three digit call sign takes an entire second and saying “X-Ray Yankee Zulu, 10 more knots” would have taken about two seconds which I didn’t really think I had.

What will you do differently going forward?

The main thing is to adjust my briefing to avoid such situations in the first place.  I don’t always know what the air speed units are in the specific tow plane ahead of me.  Therefore, I am now requesting a minimum tow speed in knots AND MPH.  E.g., I’m now saying “Towplane XYZ, behind you is glider Victor One, Fully Ballasted, Minimum Tow Speed 70 knots or 80 MPH.”

You can find a collection of my favorite soaring safety articles on this page.

Are Dry Microbursts Really An Invisible Trap? – Responding to Reactions

There’s been a lot of interest in my recent accident analysis “Invisible Trap Kills Glider Pilot – How To Avoid Microbursts.”  Within days it has been read by more than 5000 people, a significant number for our relatively small community.  I also received a lot of feedback and questions, some public, some private.  Most were quite insightful and thought provoking and I’d like to thank everyone for the engaging discussion.  It certainly helps to internalize the lessons we can learn from this.

Perfect capture of a microburst dust ring below wisps of virga in the Namib Desert. Many thanks to Avron Tal for sending me this picture.

In this post I would like to emphasize and respond to some of the comments and questions.

Be observant, patient, and wait!  Cold downdrafts created by virga displace warmer air near the surface creating updrafts glider pilots can, and should, use to avoid landing in downburst conditions. The very existence of virga indicates a soarable sky. Most western pilots have patiently worked such lift for an hour or more while waiting for conditions to improve near their destination airport. They made the decision to loiter long before descending to pattern altitude and sometimes miles away from the airport. The secret is to always be observant, patient and to take action to avoid dangerous conditions as early as possible.

Very well said!  If we can wait for the threat to pass this is clearly the best approach; especially when the virga is fairly isolated and the clouds are cycling.

The only caveat I would add is that waiting may not not always be the best strategy.  I have tried to wait out a storm only to watch a bigger and badder one to move in and the overall weather situation getting worse.  Through careful observation we must learn to anticipate what is likely to happen and make the best decision given the uncertainties involved.

Are dry microbursts really invisible? They occur below virga and generate dust rings.  Both of these are readily visible to an observant pilot. 

I completely agree that we must be observant and look for all possible warning signs.  However, I  would not count on microbursts always being readily visible ahead of time.

    • While microbursts probably occur mainly below virga there have been reported cases even when no virga was visible before the microburst occurred.  Also, while virga is visible, it is not readily apparent if there is a downdraft below.  In fact, having flown below virga many times, in most cases there was no major downdraft, or no downdraft at all.  Sometimes the air was even rising.  Unfortunately, such experiences can lead to complacency such that we underestimate the risk.
    • Dust rings only appear once the microburst has reached the ground.  Unfortunately, we can be unlucky with the timing and fly into a microburst in the landing pattern before any dust is visible.  This exact situation may have happened to Shmulik. The preliminary NTSB report states that at “about the time the glider [was] descending” [as filmed by the surveillance camera], “a dust cloud appears in the background travelling in the same direction as the glider.” The dust may not have been visible to Shmulik until he was on downwind and fully committed to landing.
    • A dust ring will also only be visible if the ground in the area is sufficiently dry.  That may not always be the case.

Dust isn’t the only indicator of microburst outflows.  We should also observe the ground for other markers such as the disturbed surface of lakes, wind rushing through crop fields, blowing smoke, etc.

Yes, great point!  We need to watch out for all markers of high surface winds.

We should make more pro-active use of our radios to warn other aviators of threatening weather.

Absolutely!  If you notice something, say something!

I don’t know when the pilots of the Challenger jet noticed the gust or whether they were even aware of the approaching glider (remember that Shmulik offered to delay his landing but did not get a response) but even if they were unaware it would have been prudent to immediately warn anyone who might be in the area of the gusting wind on the ground.

It’s impossible to say if such a warning would have alerted Shmulik in time to have the chance to take evasive action but we should all remember that we ought to warn other traffic immediately when we notice threatening conditions.

Considering the delay in the AWOS reporting,  it may also be helpful to proactively use the radio to ask anyone on the ground for the current winds (e.g. the local FBO).

Microbursts are not the only source of severe wind-shear close to the ground.

Yes!  This is another great point.  Sudden and very powerful surface winds can have various other causes.  They are also not limited to summer soaring weather.  Possible causes include:

    • Rotor turbulence, e.g. on wave days.  In Boulder, rotor, associated with wave aloft, is a frequent cause of severe ground level wind shear.  Sometimes the wind socks at both ends of the runway point in opposite directions!
    • Rapidly approaching cold fronts (or other fronts, e.g. sea breeze fronts). Here is an article and video of a pilot landing in cross winds set off by a cold front that arrived minutes earlier. In certain conditions blowing dust (a “haboob“) can make an approaching front easily visible.
    • Dust devils and other extreme lifting motions can also cause havoc near the surface.  Imagine being on final approach right when a  small-scale thermal breaks off the ground that can even send a 300 pound porta-potty flying high into the air.  (Btw – notice the blue sky in the video.) A more detailed assessment of such “rogue air currents” events can be found in this article in Soaring Magazine.

Shmulik was flying a motor-glider.  Why didn’t he start the engine?

There are wide-spread misconceptions about the capabilities of self-launching motor-gliders.  Once Shmulik was in the pattern the key thing that possibly could have helped him (besides a greater altitude) is a very high airspeed to get out of the sink and safeguard against the sudden tail wind.  This is not possible with an extended engine.  Extending the engine would have made the situation worse instead of better.

Here is why:

    • You actually have to slow down before you can extend the engine mast.  I don’t have a handbook for the Shark MS but similar gliders need to be flown well below 70 kt before the engine mast may be extended. (e.g. ASG 31Mi: 59 kts, Ventus 3M: 59kts)
    • The process of extending the mast and starting the engine is typically a multi-step process, not just the “flick of a switch”.  See the video below for an illustrative example.
    • With the engine running, the glider must be flown very slowly to generate a positive climb rate (usually around 55-65 kts).  Also, if you fly much faster, the engine will overspeed and may shut down.  If that happens, the propeller causes a lot of extra drag, comparable to half-extended airbrakes.
    • In still air, the climb rate under full power is likely in the range of 3-5 kts given the high density altitude environment at Rifle.  That does very little when you’re in 10-20 knot sink.

The engine could have been of help to sustain altitude at a safe distance from the airfield to wait until threatening weather has left the area.  However, had Shmulik wanted to wait 5-10 miles away he would not have needed the engine to do so because lift was readily available while he was on final glide.  But once he was in the pattern and experiencing the heavy sink it was already too late to try to deploy it.

The following video is a good illustration of a typical in-air engine start with a self-launching motor glider. (The procedure in Shmulik’s glider would probably have been a little (but not much) simpler than the one shown here given that his was a more modern design.)

As an aside, for anyone considering a motor glider, I highly recommend you review this article by Dave Nadler before you get carried away by your imagination. If you’d rather watch a YouTube video, here is one of Dave’s excellent presentations on this subject.

Why didn’t Shmulik fly straight ahead to a controlled-crash landing away from the airport instead of trying to make the runway?

It is definitely true that a controlled crash is statistically much more survivable than a “stall and spin” accident from about 200 ft.  That said, does anyone really think that this is the choice they would have made?  Here are some things to consider:

    • This option was only available before Shmulik attempted the turn to final, stalled, and spun in.  Once the glider stalled there was absolutely nothing he could have done to affect a different outcome.
    • Making such a radical decision would have required the foresight and conviction that reaching the runway is no longer possible and that a controlled crash is the only available option.
    • The possibility of a stall may not even have been on his mind: the ground speed of the glider before the stall was much higher than one normally experiences in the landing pattern – ADSB shows 92 knots.  This makes it unlikely that Shmulik even anticipated the possibility of a stall – let alone its imminent certainty – until it occurred.
    • Also consider the psychology: how do you rationally weigh – under extreme stress  and within very few seconds – the diminishing probability of a safe landing on a perfect runway against the probability of a certain crash with an uncertain outcome for your own survival?

Are you still confident that you would have instantly made the decision to fly a semi-controlled crash instead of trying to execute a safe landing on a 7000 ft runway?

Our energy is comprised of not just airspeed but airspeed and altitude together.  We need to manage both.

Yes, that is a critical insight.  That’s why I tried to lay out mitigation strategies for myself that account for both components if I must land in similar conditions (i.e., if I am unable to delay or divert).

    • Altitude:  I will enter the pattern high enough that I can be confident that I can complete the turn to final at about 1000 AGL even if I hit enormous sink. (In some situations this may require a pattern entry at 2000-3000 ft AGL).
    • Airspeed:  My baseline pattern speed in these situations will be 80 kt (20 kt above the yellow triangle speed) plus I will immediately add extra airspeed equivalent to any sink that I may encounter in the pattern.


Invisible Trap Kills Glider Pilot – How To Avoid Microbursts

It’s been a few weeks that our friend Shmulik Dimentstein died in a tragic crash of his HpH Shark just as he was about to land at his home airport Rifle in Garfield County, Colorado.

As I’ve written before, soaring is objectively dangerous.  Per activity hour, the risk of dying is about 40x greater than when driving a car.

However, we also know that it does not have to be so dangerous. About 90% of accidents could have been prevented by the pilot.  Most can be avoided by diligent pre-flight preparations; by paying attention to what’s happening around us; by staying disciplined and flying within one’s margins; and by avoiding basic piloting mistakes through regular practice.  The 10% of unavoidable accidents tend to be the result of particular mid-air collisions, medical problems, or – very rarely – equipment failure.

So when a pilot you personally knew to be all of these things – experienced, disciplined, diligent, observant, careful, as well as current – becomes the victim of a fatal crash while landing at their home airfield after a successful flight in typical summer soaring conditions, it gets your attention.

And when all signs point to a “stall and spin” during the final turn to land it really makes you wonder what happened.  “Stall and spin” accidents in the pattern, although quite common and often deadly, are usually easy to avoid.  Pilots just have to enter the pattern at a safe altitude and fly at a safe speed.  We all know about the yellow triangle and adding an extra margin for wind and gusts.  Could Shmulik have made such a basic mistake?  Having flown with Shmulik myself, I immediately found that implausible.

It turns out my instinct was right.  This accident was not the consequence of a simple mistake.  If you or I would have been in Shmulik’s position, I doubt we would have done anything different. If you find that disturbing you’re not alone.

As you will see, Shmulik was supremely unlucky.  He literally flew – or fell – into a microburst, an invisible, deadly, trap.  Which made me wonder: must we simply rely on luck to avoid the same outcome?

Well, after giving this a lot of thought, I don’t think so. Nor should we.  There are things we can and should do differently if we face similar conditions in the future.  As we probably will.

I will present them after a detailed analysis of what I believe happened to Shmulik.

A First Hand Account by Rick Roelke

I’d like to start by re-printing a very insightful write-up of the accident by Rick Roelke who was one of four glider pilots flying that day from Rifle.  John Good published Rick’s report on RAS. I will come back to Rick’s account throughout my analysis as it is essential to understanding what happened.

“Four gliders flew out of Rifle on June 9th 2022. We all launched around 11:00 and moved to the north side of the valley. It was tough to find that first good climb, but Shmulik found one, leaving the rest of us floundering low. Eventually we did get away. Long story short we all ended up going in different directions, all having great flights. They were not without challenges but nothing spooky, just enough work to be rewarding. In a flight of about 600 km, Shmulik made his goal of Duchesne UT, and was happy about that. We made plans to be on the ground at 6:00 and all converged on the Rifle area in time for that.  

There was virga in the area, and it got my attention as Shmulik had warned me on a previous trip to be careful with local virga. I was listening intently to the ASOS for wind or gusts, letting it repeat 5 or 6 times with the exact same report: 9 kts straight down the runway; no gusts. Later, as we got ready to land, the same benign report. OK I thought – the virga is clearly a non-issue. As we will learn, it was the whole issue. 

There was virga over the airport (elevation 5537 ft) and to the north of the valley, and northeast as well. None of the wisps extended below 11,000 ft (cloud base was approximately 19,000). Cloud cover was scattered. The clouds producing virga were not towering – they were perhaps a bit bigger than non-producing clouds, but not much. It was a point of interest to me as we don’t see a lot of it in the eastern US – I was wondering what drove the difference. 

Shmulik and I discussed the landing order: as he was a bit lower we agreed he would go first. After we decided this, we heard a Challenger jet announce “Taxiing to 26 for takeoff”. That was the runway we would use to land. 

Rifle has a moderate amount of bizjet traffic; not constant but present. We always try to accommodate and be polite citizens. Shmulik called the Challenger and offered to delay but got no reply. I was still high so it was no problem for me. He tried again, with no reply. It’s worth noting that Shmulik had a close call in the past: a jet pulled onto the runway in front of him with no radio call. This near miss was avoided only by the jet taking off immediately in front of him. I am sure he did not want to repeat that. I speculate that the Challenger was on a different frequency temporarily, perhaps the ASOS. 

As he descended, he called that he was in heavy sink and was going to make left traffic for Runway 26 (for which the normal traffic pattern is right). Shortly after this a call came from the Challenger that there was a glider crash.  

I was not sure I’d heard it correctly so I asked for clarification. “There has been a glider crash and we see no movement.” They truly had a front-row seat, as moments before they were hit by a gust so strong that they had rotated their jet to avoid a compressor stall. 

I then asked if the runway was clear, was told yes, then landed uneventfully into the 9 mph headwinds. I am not sure of the time between our landings – I would guess it was 5 min. The other glider pilots landed without problems, though all could see the wreckage of our friend’s aircraft which left no doubt as to the outcome. 

The last moments of the crash were recorded by an airport security camera. We were allowed to view the footage (but not record it). It showed Shmulik in a moderately steep turn, apparently carrying a lot of speed. In the background you can see dust and gravel being blown by the gust. Then at 90 deg to the runway and 150 to 200 ft you can see the inside wing start to drop and the nose go down. There was no opportunity to recover and it hit the ground hard, thankfully just out of camera view.  

The Rifle ASOS recorded a gust of 43 mph from the south: a 100-degree shift in direction, putting it right on his tail. 

My analysis and proposed scenario are as follows: 

The virga produced a microburst directly over Shmulik as he was waiting for the jet. He expedited his landing trying to fly out of what was likely epic sink. While his base leg was low it looked high enough to make the runway with plenty of energy to flare and roll out. But he then got hit from behind or descended into winds in excess of 40 kts and perhaps as much as 50, stalling the aircraft and removing any opportunity for control. 

One of the most difficult aspects of this accident is that, given the information available to the pilot, it is hard to picture what anyone would have done differently. This truly seems like the hand of God. There is discussion in another thread about the yellow triangle. Here is a case that would require 60 over stall speed to maintain even a narrow margin. How many people do you know that would plan to come over the numbers at 100+ on a day that is blowing steady 9 straight down the runway? 

As has been noted, Shmulik was a very experienced and skilled pilot. He had more flights and time in gliders from Rifle than anyone. We all want to learn from accidents, especially what were the pilot errors we might avoid. This is a hard one to gain insight from other than this: Some atmospheric events are bigger than our plastic airplanes. 

RR”

The Pilot

As Rick pointed out, Shmuel Dimentstein was one of the most experienced, competent, current, and safety conscious pilots anywhere.  In the 2021 soaring season he flew more than 35,000 cross-country kilometers, a distance almost equivalent to the circumference of the earth.  That year, according to OLC, only six pilots worldwide had done more cross-country flying than Shmulik.  Even in the current season he had already flown more than 100 hours.

Rifle, the location of the accident, was Shmulik’s home airport. He was intimately familiar with it and the surrounding terrain.  He frequently hosted visiting pilots, providing them with detailed briefings of the area and the weather.  He had owned his HpH 304MS Shark for several years and was completely accustomed to the aircraft. Shmulik was also a very safety-minded pilot: if you examine his flight traces you will see many long cross-country flights but you will be hard pressed to find any signs of inappropriate risk taking.

June 9, 2022

By all indications and consistent with Rick’s report, June 9, the day of the accident, was a good and typical early summer soaring day in western Colorado and eastern Utah, the main task area around Rifle.

Skysight forecasted abundant cumulus clouds with bases rising from 16,000 to about 19,000 ft.  There was a modest chance for some overdevelopment and isolated showers in the afternoon but nothing that looked concerning.  The CAPE index, a measure of convective energy and instability, was below 100 joules, indicating a very low probability of severe weather or thunderstorms.

Boundary layer winds were moderate at 10-20 kt out of the WNW.  Surface winds were forecasted to be even lighter. The surface temperature in the afternoon was likely to reach 100 degrees F over the western desert generating strong thermals in the 6-10 kt range as is typical for the area at this time of year.  Moderate wind shear in some areas could make some thermals somewhat difficult to work but that, too, is typical.  Some passing high clouds were unlikely to be a factor.  500 km flights were easily doable with a good chance for even longer flights.

As Rick reported, four glider pilots launched from Rifle that morning.  The flight traces of Shmulik’s three visitors, including that of Rick Roelke, were uploaded to OLC here, here, and here.  These traces show good soaring conditions consistent with the forecast with pilots repeatedly climbing above 17,000 ft and achieving flight distances in the 400-600 km range.

Shmulik’s Flight

Shmulik’s flight was recorded via his ADSB-out system and can be viewed on Flightaware.

The trace shows that Shmulik launched exactly at noon.  44 minutes later he had climbed to an altitude of 16,000 ft and began heading west on a cross-country flight.  His flight path took him deep into Utah.

At about 3:30pm he was about 10 miles NNE of Carbon County Airport near the town of Price, UT.  That put him at about 160 miles to the WNW of Rifle, and he decided to turn back east.  Most of his flight was at altitudes between 12,000 and 17,500 ft – a typical and safe altitude range when flying in this area.

At 5:12 pm, 5 hours and 12 minutes into the flight, Shmulik was 10 miles north of the airport of Meeker, CO at an altitude of 14,300 ft, when he decided to turn south, back towards Rifle, ~45 miles away.

Less than 20 minutes later he was about 9 miles north of Rifle at an altitude of 10,000 ft, continuing south and preparing to land.

Approaching Rifle

The last six minutes of Shmulik’s flight are plotted on the following map.  The data is from the publicly available ADSB tracklog. For each data point you can see the time stamp, the altitude MSL, the Ground Speed in kt, and the Vertical Velocity in feet per minute (fpm).

The ground elevation at Rifle airport is 5536 ft MSL.  The first datapoint of the trace is at the top left.  At 5:31:34 pm, Shmulik had 9.4 miles to go.  He was at an elevation of 10,025 ft MSL, i.e. 4,489 ft above the airport.  He only needed a glide ratio of 14:1 to reach the airfield to arrive at a typical pattern altitude of 1,000 ft AGL.

The next few miles towards the airfield show nothing unusual.  There were some patches of moderate lift and sink as would be expected on a normal summer soaring day.  Shmulik flew quite fast at ground speeds between 100 and 130 kt, carrying a lot of extra energy. Unsurprisingly, the actual glide ratio of his 49:1 glider was much better than the required 14:1 and he approached the airport relatively high.

At 5:34:04 pm, Shmulik was over the town of Rifle, just 2.1 miles ENE from the center of the runway, getting ready to land.  At this point he still had an altitude of 8,275 ft MSL, i.e. 2,739 ft AGL.  This is much higher than what most pilots would consider an adequate safety margin.

Reported Winds on the Ground

Shmulik likely checked the winds on the ground by tuning to the frequency of the local AWOS (Automatic Weather Observing Service).  Between 5:10 and 5:34 PM, Rifle’s AWOS system reported light winds out of the west in the range of 4 to 9 kts (see chart below) with no wind gusts.  This is consistent with Rick’s report, which referenced 9 knots of wind.

With light westerly winds, Shmulik was likely planning to land on Runway 26, directly into the wind. He may have expected an easy and uneventful landing.

Pattern Entry and the Challenger Complication

The normal landing pattern for Runway 26 at Rifle is north of the airport with right turns to base and final.   At 5:35:22 Shmulik could have immediately entered the downwind leg of the pattern.  At this point he was just NW of the runway at an altitude of 8000 ft MSL (2464 AGL).

However, we see from his trace that he continued south past the west end of the runway to the southwest side of the airfield.  It is possible that he still considered himself to be too high for an immediate pattern entry. After all, a pattern entry altitude of approx. 1000 AGL is customary and Shmulik was still more than twice as high at this point.  He may have planned to remain on the south side until mid-field, cross the runway to the north, and then enter the normal right traffic pattern to runway 26. This would have slightly extended the flight path, helping him fly off the extra altitude.

However, Rick’s report suggests that there is likely a different – or at least an additional – explanation for why he continued to the south side of the airport.

Shmulik and I discussed the landing order: as he was a bit lower we agreed he would go first. After we decided this, we heard a Challenger jet announce “Taxiing to 26 for takeoff”. That was the runway we would use to land. 

Rifle has a moderate amount of bizjet traffic; not constant but present. We always try to accommodate and be polite citizens. Shmulik called the Challenger and offered to delay but got no reply. I was still high so it was no problem for me. He tried again, with no reply. It’s worth noting that Shmulik had a close call in the past: a jet pulled onto the runway in front of him with no radio call. This near miss was avoided only by the jet taking off immediately in front of him. I am sure he did not want to repeat that. I speculate that the Challenger was on a different frequency temporarily, perhaps the ASOS.”

Based on this account it is likely that Shmulik continued to the south side of the airport to get a better look at the runway and observe the Challenger jet taking off – or at least to establish two-way radio contact to rule out the risk of a conflict.

Under normal circumstances Shmulik would have had sufficient altitude to delay the landing by several minutes:  his glider’s minimum descent rate in still air was just 100 fpm.  Even a more typical descent rate of 200 fpm would have allowed Shmulik to hold for about 5-7 minutes before he would have had to proceed with the landing.

Downwind Leg and Turn To Final

If Shmulik’s plan was to delay the landing this soon turned out to be impossible because he was not in still air at all.  As he continued to the south side of the runway he found himself in very strong sink of 700 – 1200 fpm and rapidly lost his altitude reserves.  Within one minute he lost a full 1000 feet.

However, at 5:36:23 he still had an altitude of 7025 ft MSL, i.e. a normally very “safe” pattern altitude of almost 1500 ft, and prudently began to head toward the east end of the runway.  At this point his ground speed was 81 kts, which – in still air – would reflect a normal pattern speed of approx. 65 kts IAS given the high density altitude.

16 seconds later, at 5:36:39 the sink rate diminished to 273 fpm.  Shmulik was now directly south of the west end of the runway.  The reduced sink rate must have been a relief.

However, 17 seconds later, at 5:36:56, Shmulik found himself once again in very strong sink of almost 1000 fpm.  Roughly at this time he must have decided to stay on the south side of the runway and fly a left hand pattern instead of crossing back to the north.  This would have shortened his approach, a seemingly prudent decision.  His altitude was 1339 AGL and his ground speed was 92 kts.  Had it not been for the strong sink he would have still been in a very conservative position for a normal landing.  Here is Rick’s report:

“As he descended, he called that he was in heavy sink and was going to make left traffic for Runway 26 (for which the normal traffic pattern is right).”

Another 18 seconds later, at 5:37:14, the sink rate doubled yet again, becoming extreme. Shmulik was directly south of midfield.  The ground came rushing closer at a rate of 1900 fpm.  Shmulik’s altitude had dropped by 625 ft in less than 20 seconds and he was now down at 714 ft AGL.  All of a sudden this had become an emergency situation.  His ground speed had dropped to 75 kt so he also had less kinetic energy reserve.  (Without knowing the horizontal wind direction and speed at this point it is impossible to say what his indicated airspeed was. It is quite likely that the air at that specific point was only streaming downwards with very little horizontal component.)

16 seconds later, at 5:37:30, he was still in very heavy sink of more than 1200 fpm and his altitude had dropped to only 264 ft AGL.  His ground speed was back up to 92 kts. Seconds thereafter he attempted to make a 180 degree turn to the left to line up with Runway 26.   Tragically, he only made it half-way through this final turn.  The last datapoint was recorded at 5:37:48 at an altitude of 14 ft, probably just a split second before impact.  Rick’s report describes it as follows:

“Shortly after this a call came from the Challenger that there was a glider crash.  

I was not sure I’d heard it correctly so I asked for clarification. “There has been a glider crash and we see no movement.” They truly had a front-row seat, as moments before they were hit by a gust so strong that they had rotated their jet to avoid a compressor stall. 

The last moments of the crash were recorded by an airport security camera. We were allowed to view the footage (but not record it). It showed Shmulik in a moderately steep turn, apparently carrying a lot of speed. In the background you can see dust and gravel being blown by the gust. Then at 90 deg to the runway and 150 to 200 ft you can see the inside wing start to drop and the nose go down. There was no opportunity to recover and it hit the ground hard, thankfully just out of camera view.

The Rifle ASOS recorded a gust of 43 kt from the south: a 100-degree shift in direction, putting it right on his tail.”

The wind gust could of course only be reported after it had been measured.  However, reporting it took longer than one might expect.  It wasn’t until 5:53 PM, 16 minutes after the crash, that AWOS reported that a 43 kt gust had occurred at 5:39 PM (one minute after the crash; 14 minutes earlier than it was reported).

Note that a 43 knot gust from a direction of 190 degrees was measured at 17:39, one minute after the accident (provided that the time stamp is accurate). However, the gust was not reported by AWOS until 17:53.  (Note: because the crash had occurred before the gust was even measured by AWOS, the reporting delay was not a contributing factor to the crash itself.  I speculate that the AWOS measurement unit may be located close to the ramp, perhaps a 3/4 mile away from the crash site. This would explain why the gust hit Shmulik before AWOS recorded it).

What Caused the Crash?

I believe Rick’s analysis is spot on. The deadly trap was a microburst.

“The virga produced a microburst directly over Shmulik as he was waiting for the jet. He expedited his landing trying to fly out of what was likely epic sink. While his base leg was low it looked high enough to make the runway with plenty of energy to flare and roll out. But he then got hit from behind or descended into winds in excess of 40 kts and perhaps as much as 50, stalling the aircraft and removing any opportunity for control.” 

As Shmulik began his final turn he faced two closely related problems that became impossible to overcome:

    1. Extreme sink of close to 2000 fpm, which had very quickly eroded his altitude reserves during the last part of his downwind leg.
    2. A sudden and very powerful wind gust from behind, which caused the airplane to stall and spin in just as he was in the midst of his final turn.

Just how quickly he lost altitude may be hard to imagine; especially for pilots from regions where 2000 fpm sink is very unusual.  Some basic math illustrates the magnitude:  a typical safe altitude at the end of the downwind leg (before turning base) is 500-600 ft AGL.  The typical time that it takes to turn from downwind to final is about 20-40 seconds (depending on how close the pilot flew the downwind leg parallel to the runway).   At a sink rate of 2000 fpm it only takes 15 seconds for the plane to lose 500 ft and reach the ground.  In other words: if you’re at 500 ft AGL and 20-30 seconds away from reaching the runway and you are in 2000 fpm sink it is mathematically and physically impossible to get there.

Now, you might say that the sink rate is likely to diminish as you get close to the ground.  This is of course true because the air cannot sink into the earth.  But that is where the second problem arises: the sudden tailwind.

Near the ground the rapidly down-streaming air is necessarily diverted into a very strong horizontal flow along the surface.  At the worst possible moment Shmulik descended into that strong horizontal outflow, which came directly from behind, at speeds exceeding 40 knots, maybe more.  The stall speed of Shmulik’s glider was approx. 40-43 kts in straight flight and 44-52 kts in the turn (depending on his bank angle).  A sudden gust of 50 knots would have caused a stall unless he had been flying at about 100 knots indicated.

The ADSB trace shows Shmulik’s ground speed of 92 kt as he began his final turn. At the high density altitude at Rifle a ground speed of 92 kt would have been equivalent to an indicated airspeed of less than 80 kt.  If this included a wind component of 50 kt from behind, his true airspeed would have suddenly dropped to 30 kt, i.e. well below stall speed.

Once the glider stalled (at an altitude of only 100-200 feet) there was nothing that Shmulik could have done to avert the crash.

As Rick pointed out, the root cause of the sink and of the subsequent tailwind was almost certainly a (dry) microburst.  To understand exactly what likely happened and what we may be able to do differently, we first have to learn more about microbursts.

What is a Microburst?

A microburst is defined as “a pattern of intense winds that descends from rain clouds, hits the ground, and fans out horizontally. Microbursts are short-lived, usually lasting from about 5 to 15 minutes, and they are relatively compact, usually affecting an area of 1 to 3 km (about 0.5 to 2 miles) in diameter. They are often but not always associated with thunderstorms or strong rains. By causing a sudden change in wind direction or speed—a condition known as wind shear—microbursts create a particular hazard for airplanes at takeoff and landing because the pilot is confronted with a rapid and unexpected shift from headwind to tailwind.”

Unlike tornadoes and other twisters, microbursts are straight-line winds. The air is streaming straight towards the earth.  Near the ground, it is deflected sideways in all directions. The following streamline diagram is from the November 2020 edition of Soaring Magazine which describes the Mayhem at Minden, NV when a powerful 56 kt microburst destroyed several gliders on the ground.

Wet vs Dry Microbursts

Meteorologists distinguish between wet and dry microbursts depending on whether they are associated with precipitation hitting the ground.  Wet microbursts can look very spectacular but this also makes them easy to see and avoid.  Dry microbursts are much more insidious because they tend to be invisible until the downburst reaches the ground.  And even then, the only visible sign may be blowing dust on the surface. This time-lapse video from the National Weather Service in Reno, NV captured a dry microburst with surface winds of 71 mph.  Note that you can’t see the downburst itself.  Only the blowing dust on the ground is visible.

Photo in Cross-Country Magazine from November 2015 depicting the outflow from a dry microburst in northern Nevada. The microburst would be invisible were it not for the dust getting kicked up on the ground.  If the surface were less dusty the remnants of the virga directly above the dust would be the only indicator.

The atmospheric conditions favoring dry microbursts are illustrated in the Skew-T chart below from the University Corporation for Atmospheric Research.  Note the very dry airmass near the surface and a more moist, sometimes saturated mid-level.  Cloud bases are high and precipitation evaporates in the dryer layer below.  This is visible as virga – streaks of rain or snow below the clouds.   This evaporation causes evaporative cooling, which accelerates the downward motion of the falling air.

Once the downdraft reaches the surface it spreads horizontally in all directions. The downdraft itself is invisible. Only a ring of dust on the ground below the virga may signify the presence of a dry microburst.

The Skew-T chart at Rifle at 5:30 pm on June 9 greatly resembles the Skew-T above.  Here, too, one can see the “inverted-V” shape at the bottom, signifying the very dry air near the surface and a more moist layer above.   Such conditions are of course very common during the summer soaring season in the western United States.

Skew-T centered on Rifle on June 9, 2022 at 5:30pm. Source: Skysight

Evaporative Cooling

As mentioned, a key factor in the development of microbursts is evaporative cooling.

What is it and how does it contribute to a microburst?  Everyone’s familiar with evaporative cooling: dip your hands into water on a hot dry day and feel how cool they become as the water evaporates.  Evaporative cooling systems work according to the same principle.

As glider pilots we know that cool air is heavier than warmer air.  So if falling rain evaporates (or falling snow sublimates), the air becomes cooler and heavier, thereby accelerating its downward momentum.

This is the exact opposite of the “cloud suck” effect that we enjoy when latent heat energy is released below cloud base, making air warmer, lighter, and more buoyant.

Virga Is a Warning Indicator

Evaporative cooling is happening by definition when virga can be observed:  Virga is the visible indicator that rain evaporates (or snow sublimates).

From experience we know that sometimes there is massive sink below virga and sometimes there isn’t.  Sometimes you fly through virga and you can even find yourself in lift.  I cannot explain why this is the case; I can only speculate that sometimes the lifting motion is so strong that even rain and evaporative cooling cannot overcome it: in these cases the evaporative cooling may slow down the rate of ascent but it is not causing a downburst.  However, if air is already sinking, evaporative cooling will accelerate the decent.

None of the pilots I asked about these phenomena claimed that they are able to reliably predict when there will be strong sink under virga and when there won’t be.  And since we don’t know, I think we must take away from this accident that we have to be extremely careful when we fly below virga; especially so when we are relatively close to the ground.

Airflow Near the Surface

The following graph illustrates the airflow near the surface once the downdraft has reached the ground. You can see the air spreading out sideways in all directions.  

Source: Microburst Presentation by John McCarthy

Size of Affected Area and Duration

Microbursts are usually short-lived events, lasting for only a few minutes.  They also tend to be confined to a relatively small area between 0.4 and 4 kilometers (2.5 miles) in diameter.

The following graph depicts a vertical cross-section of a microburst over time.  Note the scale in kilometers.  The microburst event begins a few minutes before the burst hits the ground and can last for about 10 minutes after the initial divergence begins at the surface.

Source: Wilson, Roberts, Kessinger, and McCarthy:  Microburst Wind Structure and Evaluation of Doppler Radar for Airport Wind Shear Detection, Journal of Applied Meteorology,   1984

Much more details about the structure, shape, and duration of microbursts can be found in this article by Mark R. Hjelmfelt from the National Center of Atmospheric Research in Boulder, CO.

How Common Are Microbursts?

On summer days with strong convection, microbursts are a frequent phenomenon, especially in the dry climate of the Western United States.

In the summer of 1982, the JAWS (Joint Airport Weather Studies) program was set up to detect and observe microbursts near Denver’s Stapleton International Airport.  Within 86 days a total of 186 microbursts were observed within a relatively small geographical area northeast of Denver.  Microbursts were detected on more than half of these days.  83% of the microbursts were dry.  (Source: Fujita/Wakimoto, JAWS Microbursts Revealed by Triple-Doppler Radar, Aircraft, and PAM Data)

99 of these microbursts were just within 10 nm of Stapleton International Airport. We can probably conclude from this that in the arid climate of the western United States microbursts are par for the course: They likely occur on almost every good summer soaring day.

How Does It Feel in the Cockpit When We Encounter A Microburst?

What we experience in the cockpit differs greatly depending on our altitude (and on the stage of the microburst’s development when we encounter it).

Microburst Encounters at Altitude

Imagine that you fly through the descending shaft of the microburst as illustrated below.

In this case, the only indication of a microburst may be very strong sink.  The onset of the sink could be quite sudden such that you bump your head on the canopy, or it can come about more gradually over a period of a few seconds.  In the western US, where we often fly 10,000 feet or more above the terrain we might not notice anything particularly unusual.  We have all have flown through patches of very strong sink lasting for about 30 to 90 seconds.  We might have been slightly annoyed that we just lost one or two thousand feet of altitude but that is likely all we noticed. Cruising at 80-100 kts we cover almost two miles per minute.  Normally, this is more than enough time to traverse through the confined area of most microbursts.

If we encounter the microburst a little earlier in its development, i.e. just when the air is beginning to drop past our flying altitude, we may also experience more turbulence and wind shear when entering and exiting the burst.  However, even then it seems rather unlikely that we would get in real trouble (provided that we are still at a safe altitude once we exit the sink).

Microburst Encounters Closer to the Ground

The encounter is quite different when we fly closer to the ground because we are now confronted with the horizontal outflows.  The lower we are, the more dangerous the situation. The above referenced study by Wilson, Roberts, Kessinger, and McCarthy suggest that the greatest danger is at altitudes below 1000 ft AGL.  The reason is that we first encounter a headwind followed by a tailwind as we fly through the outflow area near the surface.  The difference in speed between the headwind and the tailwind tends to be greatest at an altitude of about 200 ft AGL.  Consider the illustration below.

In this case we are likely to encounter a sudden headwind and therefore a surge in kinetic energy causing the glider to rise and accelerate, soon to be followed by a sudden tailwind and a rapid drop in airspeed that could force our glider to stall unless we were able to maintain a sufficient airspeed margin.


Avron Tal sent me this amazing picture of a microburst in Namibia. You can easily imagine that you’d hit very strong sink if you fly across the down shaft. You can also clearly see that the real danger would be near the surface – at the height of the outflow. Picture the headwind, followed by sink, and then a sudden and massive tailwind. It would be very difficult to escape once you get caught low.

The Greatest Danger is Below 1000 ft

The lefthand side of the following chart illustrates the differential in wind speed between the headwind and the tailwind at different altitudes for 12 different microbursts.  The solid line is the average.

You can readily see that the greatest wind speed differential, i.e. the greatest wind-shear is at altitudes below 0.2 km (i.e. ~600 ft) with the peak of the average at less than 0.1 km (about 200 ft). With increasing altitude the wind speed differential (and therefore the danger) decreases.  In some cases it can be measured up to about 0.6 km (~2000 ft).

Source: Structure and Life Cycle of Microburst Outflows Observed in Colorado. Mark R. Hjemfelt. Journal of Applied Meteorology and Climatology, 1988.


Reports in Soaring Magazine

Over the years, Soaring Magazine has reported on a number of such harrowing microburst encounters at low altitudes.  These were from pilots who were not quite as unlucky as Shmulik and lived to tell the tale.

Trish Durbin quotes Joe Carter in the September 1987 edition as he tells about his microburst encounter during a Region 9 contest in El Tiro near Tucson, AZ.

“There was an opening between [two storm cells]. I was doing about 80 knots and all of a sudden I hit this tremendous sink. I put the nose down 45 degrees to speed up and I was still doing about 80 knots. The controls became very sloppy, I just couldn’t figure out what was go­ing on. The ship wasn’t behaving the way it normally would. It was very sloppy as if it were ready to stall, but with 80 knots indicated air speed. The varios were pegged down; I finally got it to about 120 knots by putting it almost ver­tical and then started pulling out of the dive slowly because the ground was coming up fast. I was probably about 200 feet above the terrain.”  Joe got very lucky and landed safely in a field several miles away.

Bill Gawthrop writes about his crash in Truckee, CA in the September 2015 edition.

“I checked AWOS to get conditions prior to my landing approach, and heard winds 220 at 7 gusting to 15 knots. This was nearly straight down runway 20, the normal glider runway. I knew to be cautious because just north of runway 20 we often experience downdrafts as the runway drops off steeply, at about a 40-50% slope. I made a short pattern to minimize the time I spend in the down air. I turned final about 400 feet north of the runway about 180 feet above the runway.

Suddenly, I was dropping like a stone, being pushed into a left turn by the wind. I immediately pushed in the spoilers, hit hard right rudder, and hard right stick. The glider, after what felt like a freefall, started to respond to my inputs about the time I dropped below the runway. I could see I was too low to make it back up to the runway elevation.  … Witnesses said I had cartwheeled over the runway lip onto the taxiway, landing backwards but right side up. 

According to the weather records the winds had shifted suddenly to 260 gusting to over 20 knots about the time I arrived, lasting only a minute or two. The downdraft … struck at a much higher altitude than would be expected for a rotor off the trees and the descent was very rapid. I suspect that a small microburst that lasted only a short time forced the apparent downdraft that I experienced. 

The strong gust of wind was 60 degrees from my flight path.  My forward speed relative to the wind would have dropped significantly when I passed through the wind shear of this oncoming gust causing the wings to significantly lose lift. So rather than a down draft causing the violent drop it could have been caused by the wind shear. “

More insightful stories about powerful downdrafts as well as sudden updrafts can be found in the excellent article “Rogue Air Currents” by Bob Thompson in the October 2014 edition of Soaring.

Everything Fits

Now that we understand a lot more about microbursts we can readily see how all indicators fit together.

Shmulik was supremely unlucky because he flew directly through the center of the downdraft when he was on his downwind leg.  And then, just as he started to make the turn from base to final he was hit by the microburst outflow coming directly from behind.  At that point he had descended to an altitude of approx. 200 ft where the strength of the outflow is typically the strongest.

The following charts show radar images for 5:30 pm, 5:35 pm, and 5:40 pm. The purple circle shows the small cell from where the downburst most likely came from.

Source: Radar Data from NOAA (National Oceanic and Atmospheric Administration). I entered the location of the runway for better clarity.

AWOS reported the strength of the gust on the ground at 43 kts.  Based on the data from the research study referenced earlier it is likely that at 200 ft AGL the outflow speed was about 10-20% greater than near the ground.  I.e., 50 kt or slightly higher.  Shmulik would have needed to fly at an IAS of around 100 kt to avert a stall and have a chance of maintaining control.

The time duration of the event was very limited, just as would be expected.  After the gust had come through, AWOS went back to reporting light winds out of the west.

That’s when the other three glider pilots returned to the airport, just minutes later. Based on their flight traces, all three landings appear completely normal and uneventful.

Rick Roelke followed Shmulik, touching down at 5:45:36, i.e. less than 8 minutes after Shmulik’s crash.  Bill Feiges was next, landing at 5:47:38, followed by Sean Franke who landed at 5:50:51.

It is worth noting that Shmulik had started his landing pattern significantly higher (!) than any of these three pilots: the altitudes of these three pilots on downwind at midfield were between 875 and 1148 ft AGL, i.e. typical and normal pattern altitudes.  Shmulik had been at 1339 ft AGL at an equivalent position in his pattern.  This means Shmulik had the greatest safety margin of all of them.  Also, none of these three pilots flew at a higher speed in the pattern than Shmulik did.

Could The Accident Have Been Averted?

This is very hard to say.  Perhaps the most important questions is whether the amount and location of the virga should have been so concerning as to prompt a reasonable pilot to delay their landing and wait at a safe distance for the virga to dissolve or move away.

Should the Landing Have Been Delayed?

Without being able to see the sky like Shmulik did, this is of course impossible to say.  However, by all accounts none of the pilots operating at Rifle at this time were overly concerned about the extent of the virga.  Everyone’s behavior suggests that many if not most pilots would have proceeded with the landing just like Shmulik did.

    • Rick’s report stated, “There was virga over the airport (elevation 5537 ft) and to the north of the valley, and northeast as well. None of the wisps extended below 11,000 ft (cloud base was approximately 19,000). Cloud cover was scattered. The clouds producing virga were not towering – they were perhaps a bit bigger than non-producing clouds, but not much. It was a point of interest to me as we don’t see a lot of it in the eastern US – I was wondering what drove the difference. 
    • Bill Feiges, one of the other pilots flying that day, wrote, “I did not think there was enough virga in the area to catch my immediate attention.” Bill is quite familiar with the weather in this area as he normally flies out of Steamboat Springs, CO, just 80 miles to the NW of Rifle.
    • The pilots of the Challenger jet were clearly not overly concerned either, otherwise they would not have been taxiing to the runway for takeoff.
    • Plus, none of the three glider pilots thought it necessary to delay their landing even after Shmulik had already crashed.

Bad Luck

Unfortunately there was a tremendous amount of bad luck involved:

    • The occurrence of a microburst with extreme sink in the pattern just as Shmulik returned from his flight;
    • The delay caused by the intended Challenger launch, which likely prompted Shmulik to fly to the south side of the airport exposing him to more sink and the sudden tail wind (instead of a head wind) on the turn to final;
    • The lack of a radio response from the Challenger which may have hampered Shmulik in his decision making (e.g. preventing him from landing straight in on runway 08 when getting low); and
    • Encountering the tremendous tail wind just as Shmulik was making his turn to final, i.e. at the worst possible moment, and at the worst possible altitude.

If only one of these factors would have been different it is quite possible – perhaps likely – that the outcome would have been different as well.

It is hard to argue that Shmulik did not have sufficient altitude when he returned to the airport at almost 3000 ft AGL with only 2 miles to go.  Or that he flew unusually slowly in the pattern.  The three pilots returning after Shmulik were aware that there had been an accident.  They would have been exceptionally careful.  And yet, none of them returned to the airport with more safety margin than Shmulik did.  None flew faster in the pattern.

I believe that any of us – if put in Shmulik’s position – may have done exactly the same thing he did.  Any of us could have suffered the same outcome.  Indeed, it is tempting to conclude that this was indeed Shmulik’s fate.  That nothing could have been done differently; that none of us can do anything different.  Even, that nothing can be learned from this.

I sincerely hope that this is not true.  I am the first to admit that based on what I knew before doing this detailed analysis I would likely have acted just like Shmulik did.  But that is not the same as to say that I won’t change anything in my flying going forward.  I believe that there has to be, and that there is, something that I and others can learn from this.

Is There Anything To Learn?

I believe the answer is clearly “yes”.  The following summarizes my personal takeaways.  You may need to adjust these based on your flying environment, your experience and skills, and your glider.

Recognize the Potential for Microbursts

First, there are a few facts about microbursts that I will try to remember:

    1. Microbursts are a common  summer-day phenomenon. In the Western US they occur on practically any good summer soaring day.
    2. Microbursts do not just develop below towering cumulonimbus cells.  They can occur under any mature cumulus cloud that is starting to dissolve, especially if there are signs of precipitation below cloud base.
    3. Dry microbursts are invisible.  The only visible indicator may be a ring of dust on the ground emanating from the center of a downburst.  However, dust can obviously only be noticed after the microburst has already reached the ground. You may not be able to see it in time!
    4. Virga is an indicator that microbursts may be present because virga is a tell-tale sign of evaporative cooling, which accelerates any downward movement of the air.
    5. Microbursts can be extremely powerful and the sink alone can be overwhelming.
    6. Near the surface, strong sink from a microburst is typically followed by a sudden and powerful tailwind, no matter in which direction we’re heading.  This is a consequence of the fact that the down-streaming air is deflected outwards in all directions as it hits the ground.
    7. The greatest risk of sudden tailwinds exists below 1000 ft with a peak wind differential at around 200 ft AGL.  That’s why microbursts are so dangerous in the landing pattern.
    8. In addition, I will remember that AWOS reports are outdated.  Microbursts occur suddenly and the reported wind speed necessarily reflects what happened in the past, not what is currently happening. There can also be a substantial time delay in the reporting.

Anticipate and Avoid

Second, the best strategy to minimize the risk of getting caught in a microburst at low altitude is to anticipate and avoid it.  Practical strategies I will use going forward are:

    1. If there is any indication of overdevelopment or virga I will adjust my final glide approach such that I plan to arrive at the target airport with a minimum altitude of at least 3000 ft AGL. This will give me more time to assess the conditions and make alternative plans.
    2. If virga is present above or immediately next to my landing site I will attempt to delay my landing by staying in rising air at a safe distance and altitude and wait for the virga to move away or dissipate completely.  This usually only takes a few minutes.
    3. If this is not possible I will divert to a different airfield or landing site provided that the conditions look more favorable.

Modified Landing Pattern if Necessary

Third, as a last resort, if I must land despite the presence of virga above or next to the field I will modify my landing pattern as follows:

    1. I will enter the landing pattern much higher than usual.  This may be as high as 3000 ft AGL to allow for the possibility of massive sink on the downwind leg.  (I will also announce this unusual pattern on the radio so other traffic is not taken by surprise.)
    2. I will plan to maintain a substantial altitude safety margin throughout the pattern and complete my final turn while still at an altitude of approx. 1000 ft AGL, planning to fly a very steep final approach.  Completing the final turn around 1000ft will significantly reduce the risk of a sudden gust from behind, especially while turning.
    3. I will fly at a much higher pattern airspeed. This is especially important once I get below 1000 ft because that is where a gust from behind is most likely and also most dangerous.  If there is any virga in the vicinity I will fly at a minimum IAS of 80 kts (20kts above the yellow triangle speed).  If I encounter sink in the pattern I will immediately increase my airspeed further.  As a rule of thumb I will add extra airspeed equivalent to my sink rate.  E.g., if my sink rate is 10 kts (1000 fpm), I will add another 10 kts and fly at 90 kts IAS.  If my sink rate is 20 kts, I will fly at 100 kts IAS.  The stronger the downdraft, the stronger the potential tailwind once I get close to the ground.  I think this airspeed adjustment will better protect me against sudden tail gusts or descending into a sudden tail wind.

Communication and Training

  1. I realize that flying such an unusual pattern can in itself be a risk.  There are two concerns in particular:
    1. Other traffic may not anticipate it and be taken by surprise.
    2. I could misjudge my altitude and overshoot the runway.

With respect to the first concern, I will mitigate it by clearly announcing my intentions.  I would also hope that such a pattern is rarely necessary because I intend to avoid to land in such conditions whenever possible. This pattern is a last resort.

With respect to the second concern, it is something that I will deliberately practice when there is no other traffic in the vicinity.  It is clearly helpful to get accustomed to the sight picture of finishing the turn to final at 1000 ft AGL and making a spot landing at the normal aim point.  I am fortunate that my glider has very powerful airbrakes, which allow for a very steep descent if necessary.  This approach may not work for gliders with less effective spoilers.

Learning From My Own Mistakes

I looked through my own inflight videos and found the following one from a flight on June 7, 2021 that illustrates a broadly similar weather situation to the one Shmulik was likely facing.

I’ve Been There Before

I recommend you begin to watch at 31:54.  The similarities include:

    • Virga directly above and in the vicinity of the airport.
    • I was at a similar altitude as Shmulik when I had 10 miles to go.
    • I encountered extreme sink of 20 kts in the vicinity of the airport, directly below virga.  In retrospect, this was also likely the result of a microburst.  (I did not encounter a sudden tailwind when exiting the sink because I was still a few thousand feet above the ground where sudden tailwinds are not likely because the down-streaming air has not yet been deflected.)
    • There were signs on the ground of an approaching gust front suggesting strong wind shear in the area.
    • The flight was during dynamic summer soaring conditions in Colorado at the same time of year (June 9 vs June 7), albeit at different airports.
    • The field elevation at Boulder is 5288 ft which is similar to the elevation at Rifle at 5536ft.

Compared to Shmulik, I was simply more lucky at the end.  Before I entered the pattern, the severe sink stopped.  I also didn’t get hit by a gust from behind on my final turn. Plus, I wasn’t distracted by another aircraft trying to take off from the same runway.  If it weren’t for these key differences, the outcome could have been the same.

Relying on Luck Is Not A Strategy

However, in the future I don’t want to leave the differences to luck.  Based on what I learned from Shmulik’s crash there are several things I will do differently from what I did in the video:

    • I will maintain more altitude on days like this before approaching the airport.  Note how – in the video – CX came back several thousand feet higher than I did.  In conditions like these, altitude can be lost very fast!  In the video you hear me joke at 32:52 that CX is too high.  No, he wasn’t! He made a smarter decision by climbing up while on final glide.  This put him into a safer position with a lot more options!
    • I will seek to avoid a landing while there is virga directly above or next to the airfield and a gust front is approaching.  You can see in the video that I considered diverting to Longmont but then the extreme sink over Boulder forced my hand.  CX had the additional altitude he needed to either wait the situation out (which he did) or divert to nearby airports.  CX landed 12 minutes after me when the gust front had passed through and the winds had calmed down.
    • I will accelerate immediately when I hit extreme sink.  You can see that my airspeed fluctuates between 70-80 kts as I hit 20 kt sink (starting around 37:00).  I should have pushed the nose down immediately, accelerating to at least 100 kts, if only to fly out of the sink faster (I was at an altitude of about 3000 AGL and a sudden gust from behind is not likely until closer to the ground).
    • I was not much above 1000 ft AGL when crossing midfield to enter a right pattern to Runway 26.  As explained above, in similar situations I will enter the pattern much higher in the future to guard against potential sink on the downwind leg.  (And I will not waste time by flying in circles listening to AWOS which may be outdated anyway.  I should just focus ob observing the wind socks and the surface of the lakes.)
    • My target airspeed in the pattern was 75 kts and my actual airspeed fluctuated between 70 and 80 kts.  I believe this was too slow, especially during the turn to final that I started at an altitude of about 700 ft AGL.  It would have been better to fly that last turn 300-500 ft higher and faster (and a little further east of the runway).  I should have never been below 80 kts in the pattern.  This also includes the last portion on short final.  It is important to maintain the extra speed until I get into ground effect where the risk of descending into a sudden tail wind no longer exists.

Final Thoughts

Writing this article has been difficult.  However, I sincerely hope that it was worth it. Unfortunately it won’t help Shmulik.  But I know that it will help me and hope that you, too, find it valuable.  I am not a fatalist and I like to avoid leaving things to chance. I know that our sport is objectively dangerous.  But I also know that if we are willing to do the hard work that it takes to learn from the accidents of others it does not have to remain quite as dangerous. I hope this analysis is another step in that direction.

Disclaimer: this analysis is not intended to preempt or substitute the official NTSB accident investigation.  It is solely based on information that I had ready access to.  More information may come to light (e.g. by analyzing the more detailed igc trace rather than the ADSB trace).  My analysis also includes interpretations that are necessarily subjective.