
Many of us participate in activities and sports that are at least somewhat dangerous. However, most of us also do not have a full appreciation of how risky these activities really are, especially compared to other things that we could be doing instead.
We just love our favorite pastime and facing up to its risks can be stressful because we also want to be safe while having fun. Psychologists call this type of stress “cognitive dissonance”, and we intuitively look for ways to remove the discomfort of our conflicting emotions, often by downplaying the risks to ourselves and to others.
E.g., when I became a glider pilot some 35 years ago, my instructors used to proclaim that “the most dangerous aspect of the sport is the drive to the airport”. This was a widely held belief at the time even though it could not have been further from the truth. And while the slogan was famously debunked by the prominent German pilot Bruno Gantenbrink in his speech “Safety comes first“, our instinct to downplay the risks to ourselves (and to others) has of course remained.
Given our natural inclination to deceive ourselves, it is not surprising that good data about the factual risks of many activities can be difficult to come by. And even if data are reported, they are often accompanied by statements that soften, blur, or contradict the facts, frequently through the use of misleading comparisons.
Here is just one such example from scuba diving in which the author asserts that scuba diving is safer than driving a car. She does this by comparing the statistic that 1 in 5,555 people were killed in a car accident in 2008 with the statistic that only 1 out of 212,000 dives ended deadly. Did you catch the fundamental flaw? The comparison would be ok only if each driver would drive just once a year. In reality, each driver makes on average 2 trips per day, i.e. 730 car trips per year, which means that the 5,555 drivers drove in aggregate about 4 million times (5555*730). I.e., 1 in 4,000,000 drives ended deadly vs 1 in 212,000 dives. By this – still not perfect, but definitely more comparable – measure diving isn’t safer than driving but instead about 19x more dangerous! No matter the sport or activity, you’ll quickly find similar examples of apples to oranges comparisons and a conscious or subconscious attempt to downplay the risks.
When I looked for data on risky sports and activities, I also found the other extreme: a Google search will return plenty of articles listing “the most dangerous sports in the world,” almost all of which try to make most sports sound insanely dangerous. However, more often than not these articles are just click-bait to generate ad revenue and lack any serious effort to get to the facts. Even the most well-intentioned ones that actually quote their sources tend to suffer from one of two major problems: either they lack a common denominator and therefore compare stats that are just not comparable; or they use a denominator that isn’t all that meaningful such as the general population while ignoring the differences in participation rates among different sports.
I wanted to know the honest truth and so I set out to do the research myself. The most important decision that I had to make at the outset was to select the most appropriate basis of comparison and hence, what denominator to use. I concluded that the most meaningful datapoint to me is the risk of dying (and the risk of getting injured) per hour of participating in a particular activity. There are two reasons I picked this risk per participation hour as the most sensible base of comparison: First, it allows me to compare different choices for my spare time, e.g., the risk of spending an afternoon riding a mountain bike vs the risk of spending the same afternoon flying a sailplane. Second, it gives me a sense of how serious the risk really is and therefore how carefully I should prepare to mitigate it.
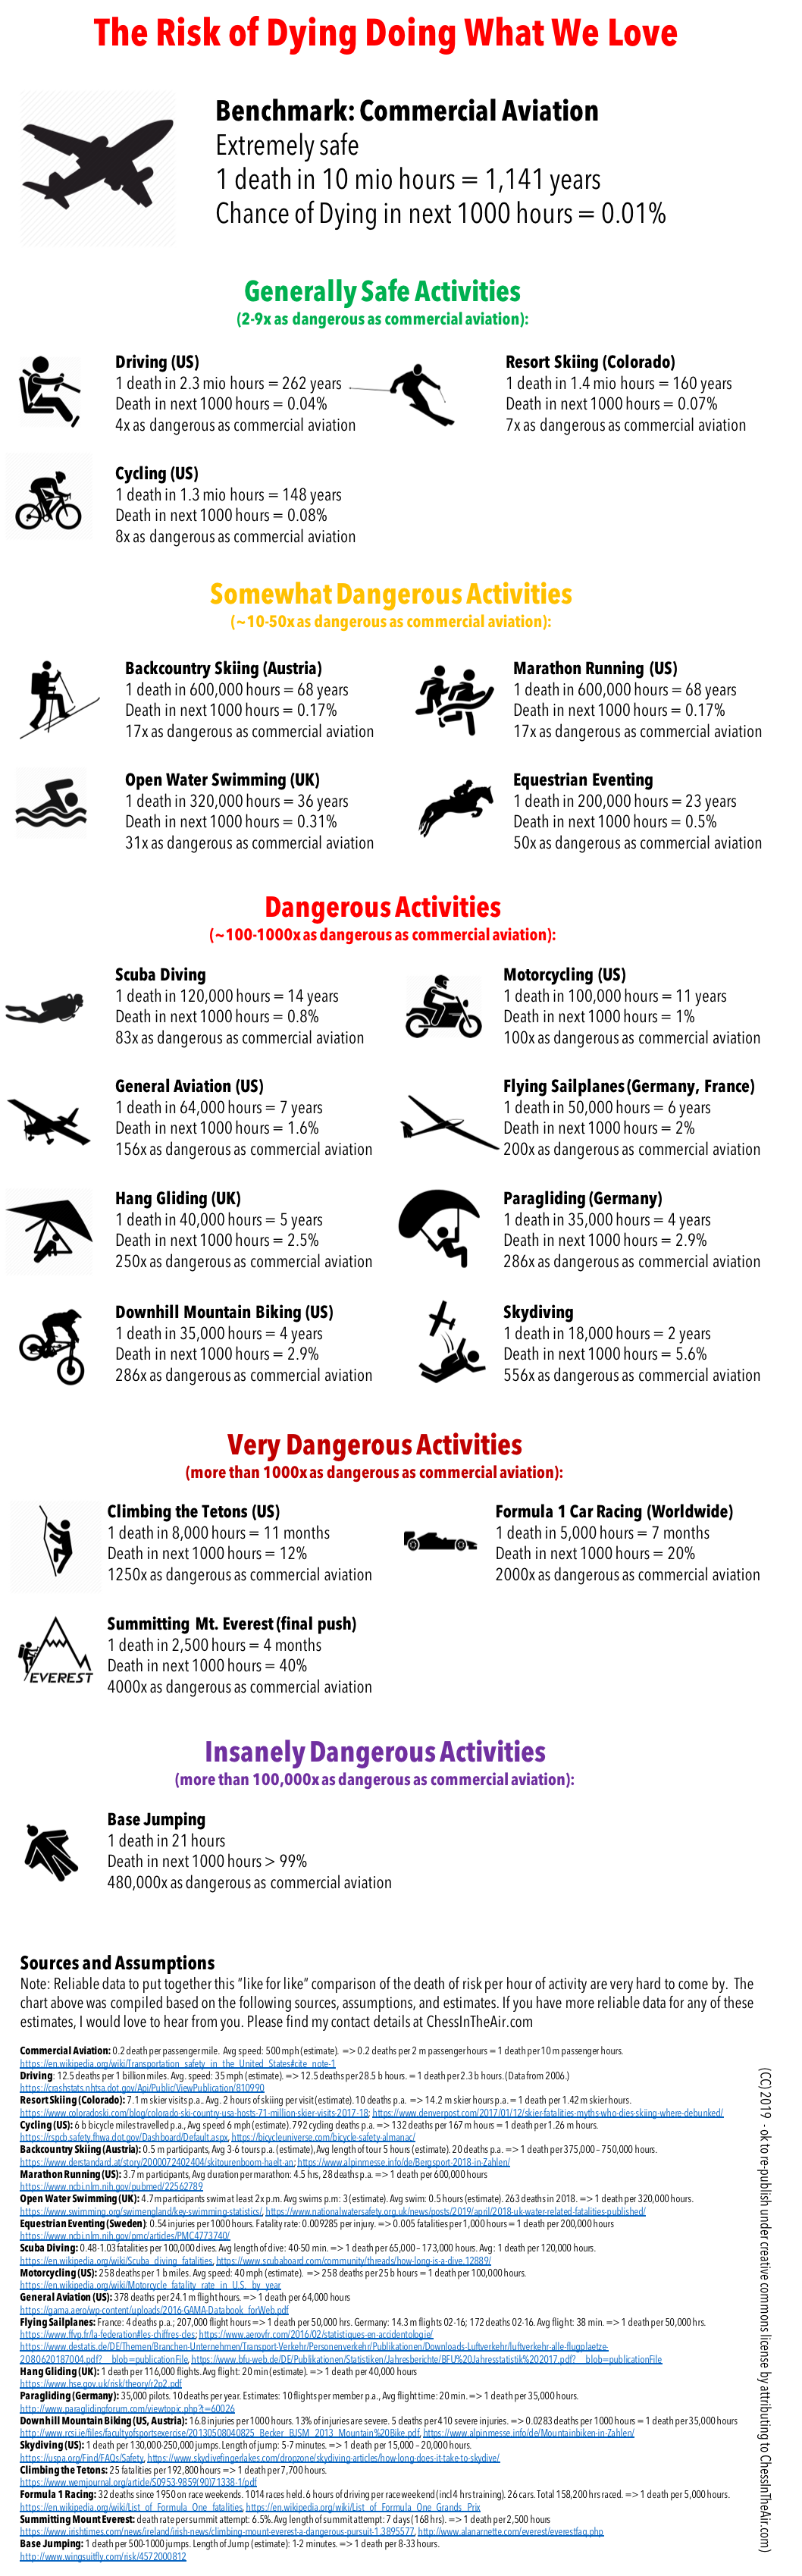
The graphic that we’ll get to below shows what I came up with. To facilitate the readability of the comparison, I benchmarked all activities against traveling on commercial airlines, which happens to be one of the safest things you can do when you leave your home: only once in 10 million passenger hours (i.e., once in 1,141 years) will a passenger die when traveling on a commercial airline. In other words, the chance of a person dying within their next 1,000 participation hours is only 0.01%.
Other activities that I participate in regularly such as driving, cycling, skiing (on and off piste), or marathon running aren’t nearly as safe as traveling on an airliner but they are still quite safe.
Unfortunately, my favorite sport, flying sailplanes, aka soaring, is one of the more dangerous activities. There are no reliable participation data available for the US but I found quite solid information for Germany and France where soaring is much more practiced than in the US. In both countries the sport has a fatality rate of 1 in 50,000 participation hours; i.e., the risk of dying within the next 1,000 hours of participation is 2%, about twice as high as the risk involved in riding motorcycles. It also means that an active pilot, who flies about 100 hours per season, has a 1 in 50 chance of dying in the sport within the next decade, and it makes soaring about 200 times more dangerous as traveling on a commercial jet. Other air sports tend to have similar risks: flying powered airplanes is just a little bit safer whereas hang-gliding and paragliding are somewhat more dangerous.
Some of the data surprised me. E.g., I found driving, skiing, and cycling to be safer that I expected, whereas climbing the Tetons and especially Mt Everest is actually much more dangerous than I anticipated. Not surprising to me was the insanely high risk involved in Base Jumping, which is shown to be 480,000 times more dangerous than commercial aviation, with an expected death per 21 hours of participation, and practically no chance at all to survive the next 1,000 hours of flying through the air. If you’re a Base Jumper you are likely to complain that my methodology of counting only the short duration of the jump (and, e.g., not the time you spend climbing up the mountain) puts your sport into an unfair light. To that I say feel free to count differently if you want to convince yourself that jumping is safer than it really is. As I pointed out above, you certainly won’t be alone in your desire to deceive yourself.
Unfortunately, all the information in the chart below only refers to the risk of death and does not account for the risk of injuries. The reason is simply the fact that data about injuries are extremely unreliable since the great majority of sport injuries are never reported and/or accounted as such. (The omission of injury information also means that activities that tend to have a relatively high injury to death ratio (e.g. skiing, equestrian eventing, marathon running, riding motorcycles, hang gliding, paragliding, downhill mountain biking) might look relatively safer than they really are, and activities that have a relatively low injury to death ratio (e.g. general aviation, soaring, skydiving) might appear relatively more dangerous than they really are.)
Without further ado, here is the chart:
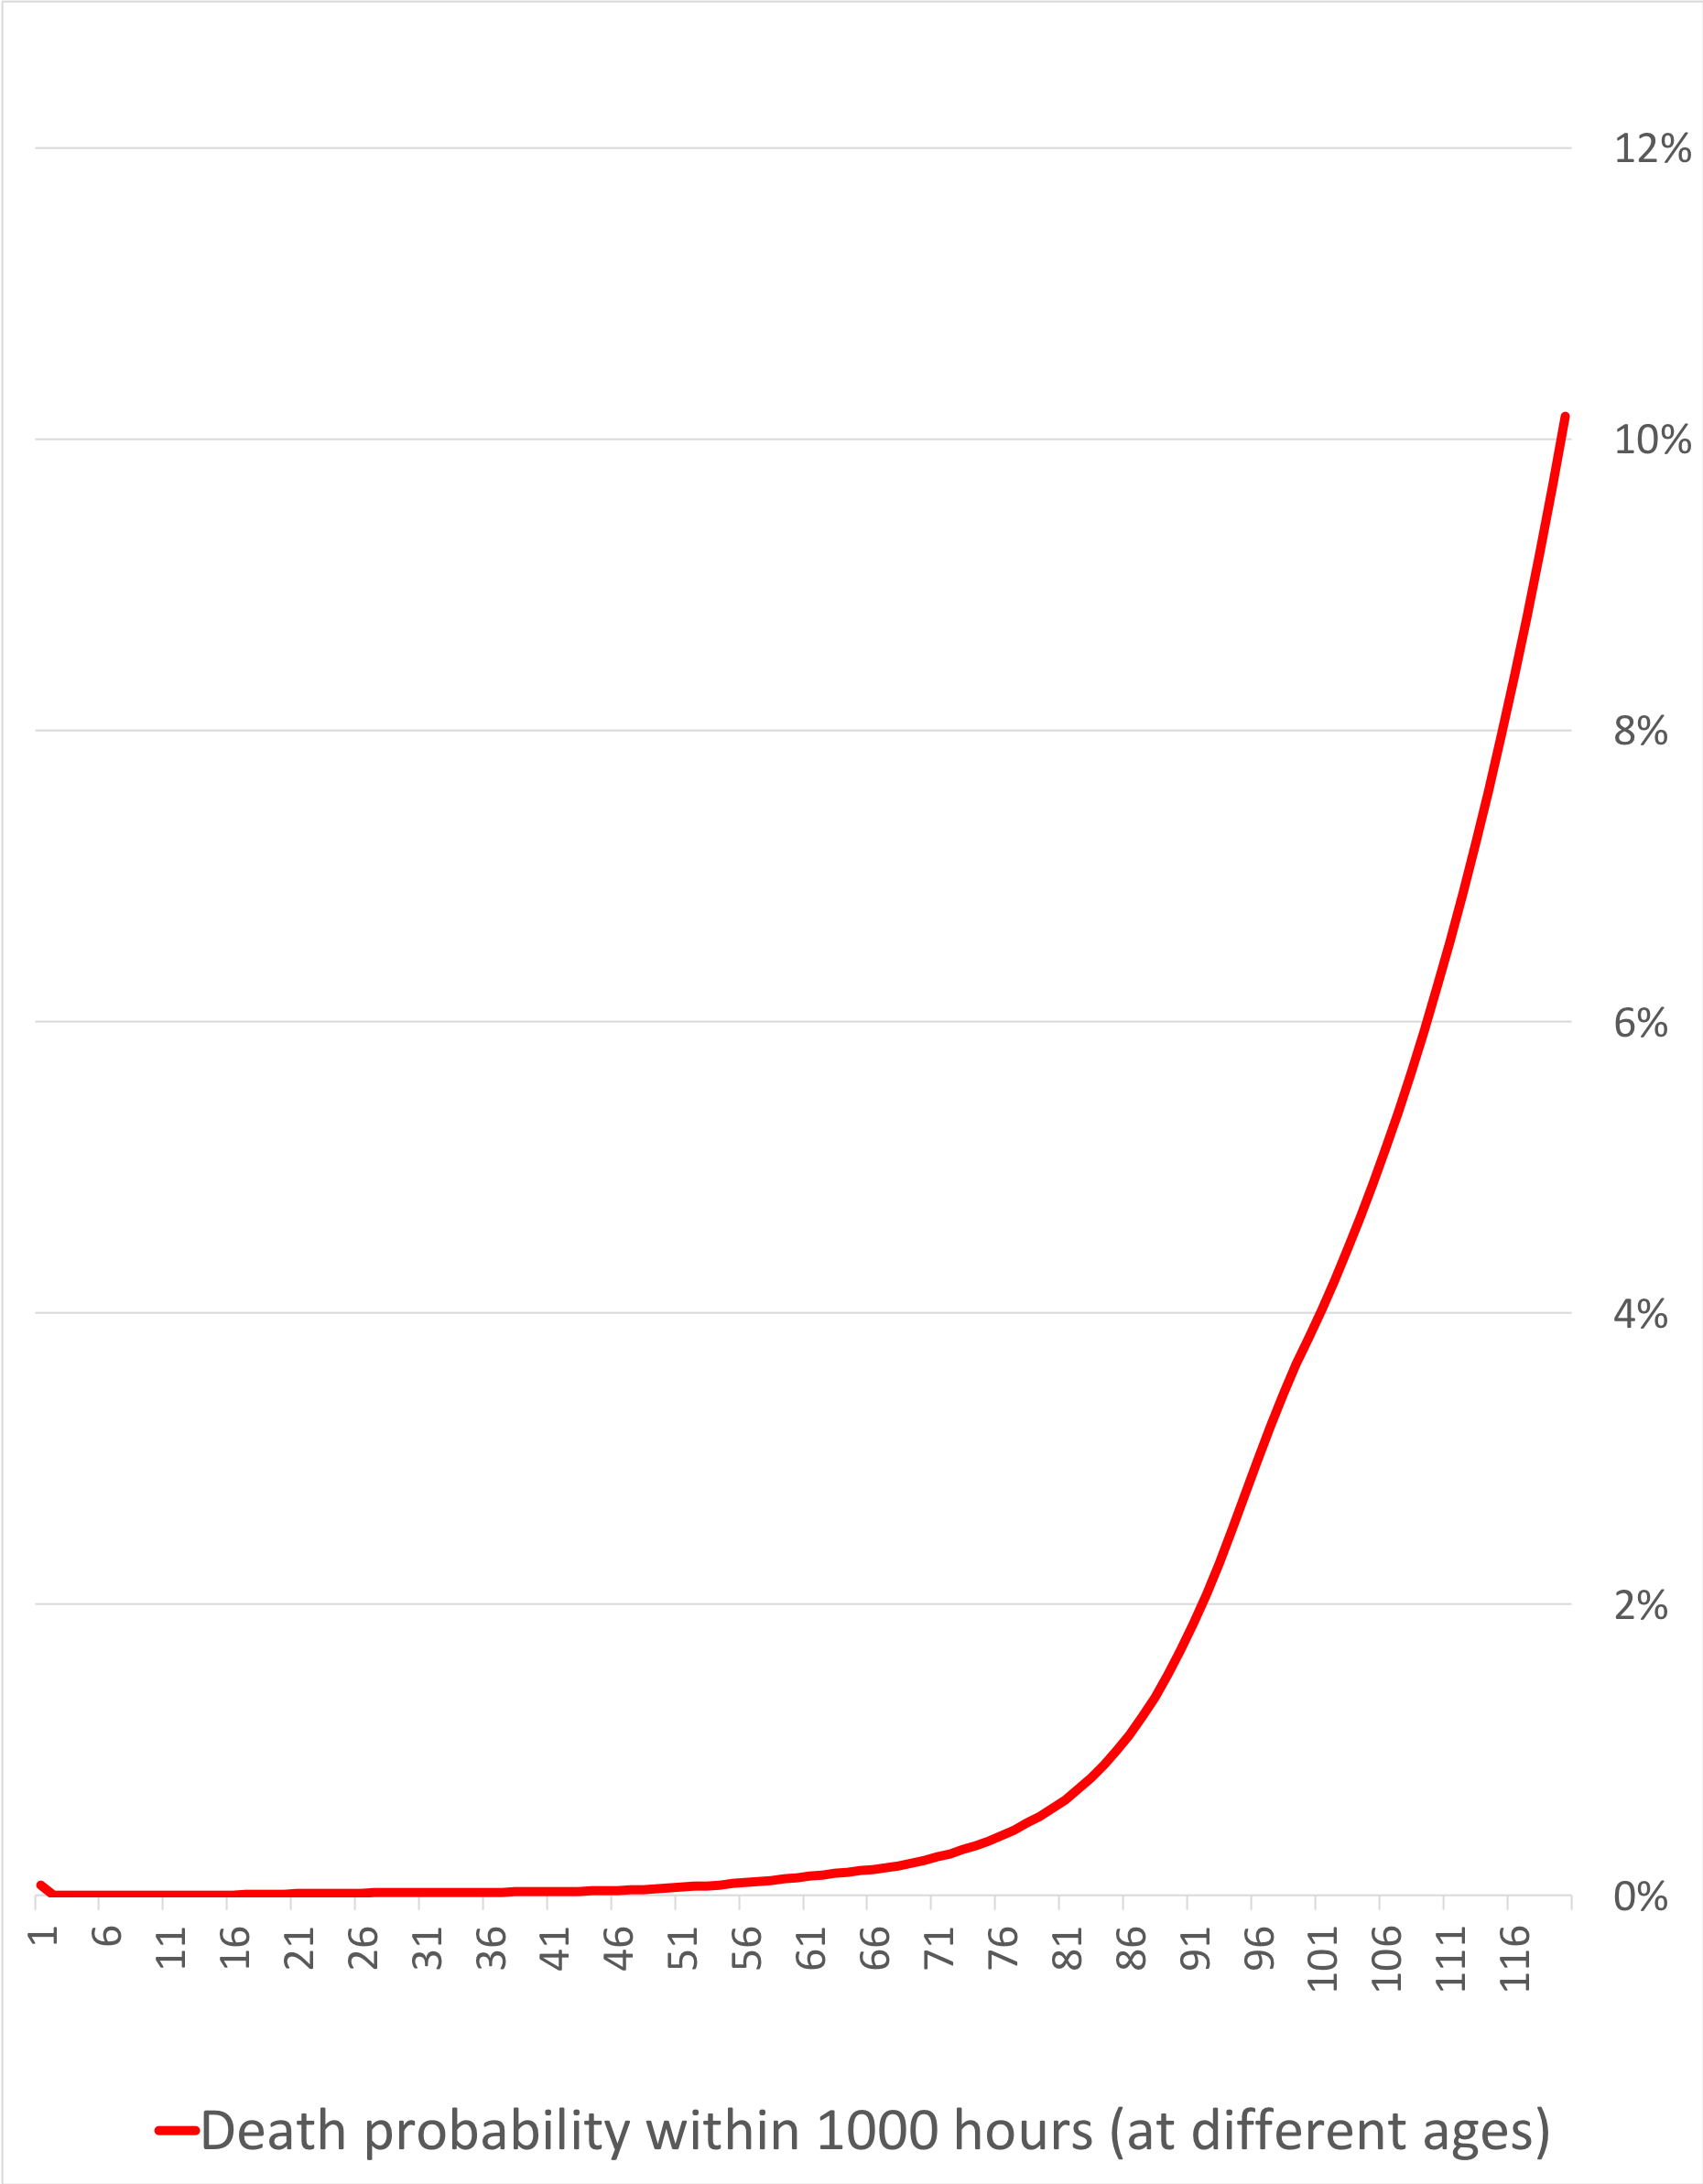
Another way to look at the same data is to compare them to the normal risk of dying (of any cause) at different life stages. Life insurance companies keep track of these risks as they seek to adjust their premiums based on the age of the insured. It should be intuitive that an 18 year old person has a much lower risk of dying within their next 1,000 life-hours than a 90 year old.
Below is a chart that shows how this normal risk of death increases as you get older. E.g, the odds that an average 18-year-old American male will die within their next 1,000 life-hours is about 0.01%. This happens to be exactly the same odds as traveling on a commercial airliner, once again illustrating how save commercial air travel has become. A 90-year-old male, by comparison, has a 1.9% chance of dying within their next 1,000 life hours. You can see how the slope of the curve remains fairly flat until the age of 50, and how it really steepens around 75. If someone manages to survive until the age of 119, their odds of dying within the next 1,000 life-hours will have risen to 10.2%.
(The source of this information is the US Social Security Administration. Note that they report the risk of dying within the next year, which I converted to the risk within the next 1,000 life hours, i.e. 41.7 days. Note also that the risk level tends to be slightly lower for females since their life expectancy is higher, but for our purposes the gender differences are negligible.)
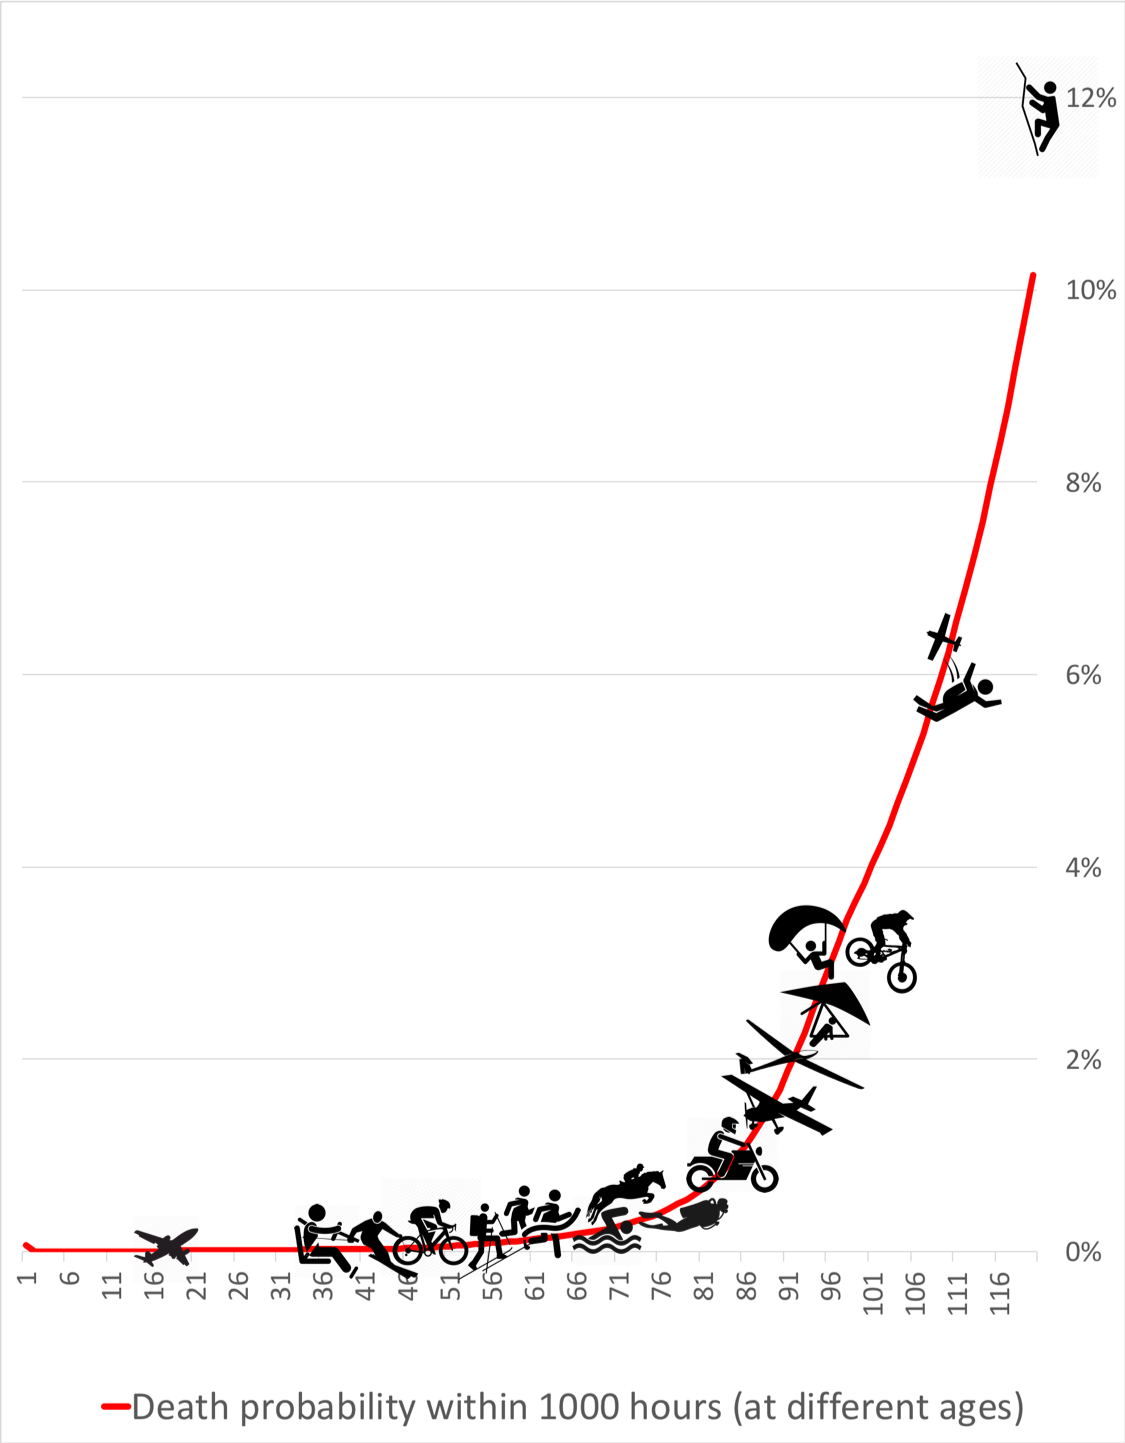
So how do the risks of the various activities compare relative to the normal day-to-day risk of dying at different ages?
To illustrate this, I placed the activity icons onto the same chart (see below). Once again, you see that commercial air travel is the safest of these activities. Driving, skiing, cycling, back-country skiing, and marathon running are all along the relatively flat part of the curve. The risk of dying per hour when swimming in open waters or while participating in equestrian eventing is about 0.3%, equivalent to the risk that an average 71 year-old person faces in their day-to-day life.
As you move right and up along the curve, the risk level increases much more noticeably. Scuba diving is about as dangerous as being 80 years old, and motorcycling corresponds to the normal risk of being 85. Several air sports come next: general aviation, flying sailplanes, hang gliding, and paragliding. Each of these is about as risky as the normal lives of people aged 88 to 95. Downhill mountain biking also falls into this category.
As you continue further up the slope you can see two outliers: skydiving is about as dangerous as the normal life of a 107 year-old and climbing the Tetons is about as dangerous as being 119 yeas of age.
Three activities from the initial graphic above are still missing: Formula 1 racing, Climbing Mt. Everest, and Base Jumping. The dangers of these three sports are so great they are literally off the chart because the Social Security Administration does not compute death risk statistics for anyone older than 119. (You probably don’t know anyone of that age either.) Since Formula 1 racing is about 2x as dangerous as Climbing the Tetons and Climbing Everest is another 2x as dangerous, you can roughly imagine how high up the risk curve you have to go. With Base Jumping even that becomes impossible: it is more than 100x more dangerous than climbing Mt. Everest!
Why put all this information together? I believe we should all be fully aware of the risks that we take, and that we should let our awareness of these risks be an incentive to take the appropriate preparations and precautions to reduce these risks as much as possible. Most of the fatal accidents in sports are at least in part the result of human error and could have been avoided. If we close our eyes to the risks (as we are naturally inclined to do in order to remove this pesky thing called cognitive dissonance), we are also unlikely to do what it takes to keep the risks contained.
Commercial aviation is a great example that risk mitigation really works. After the invention of powered flight in 1903, flying was certainly one of the most dangerous things humans could possibly do. Gradually and over time, this risk has been reduced to such an extent that commercial air travel is now one of the safest things we participate in.
The concrete risks and the strategies for risk mitigation are obviously quite specific to each of the different activities and discussing them is beyond the scope of this article. But risk mitigation strategies do exist for all activities and deploying them deliberately and consistently can be very effective (for some activities probably more so than for others). If you do something that is objectively dangerous (and now you know that it is), learning about these strategies and taking them seriously can truly help you stay alive.
Have fun and be safe!
It’s hard to believe the flying gliders is twice as dangerous as riding motorcycles.
I didn’t like to believe it either (remember we don’t want our sport to be unsafe) so I spent quite a bit on the data for both of these activities in particular. I’m fairly confident in accuracy of the sources. If you have better ones, I would be grateful if you could provide them.
I think this is an extremely useful article. Although it is open to challenges it is the principal and purpose that provides the value. As a paraglider pilot and club safety officer I struggle with communicating the risks to pilots without sounding like a nanny. Your data provides a solid base for an individual to make a personal safety assessment. For example: your data considers accidents based on time (in my case) flying. In reality, the majority of PG accidents occur on launch and landing, I.E. in close proximity to the ground. Hence pilots who fly many short flights or spend their time ridge soaring are at higher risk (calculated as accidents/time) than those who prefer and are able to fly high and far. I suspect that many of the ridge soarers think they are in the safer category. My point is not that your data is less valid, just the opposite. PG pilots need to understand the variety of hazards and adjust their flying accordingly. I shall put a link to this article on our club web site. On a personal note, as a pilot in his seventies I look forward to the point where the age/risk graphs intersect and I can relax in the knowledge that my flying is no more risky than waking up in the morning
Chris – thanks for your comments! It won’t surprise you that it the same for soaring, i.e. the majority of accidents happen when flying in close proximity to the ground, i.e. during takeoff, landing, or in mountainous terrain / along ridges.
Very good article! I’m very interested in comparing risks between fairly common activities, with a particular interest in safety data for ordinary (not gonzo downhill mountain) bicycling.
I’ll point out that one additional rabbit hole for analysis is the possibility of life _benefit_ from various activities. I’m aware of about five different studies that have all concluded that the benefits of bicycling greatly exceed its tiny risks, by ratios of anywhere from 7:1 to over 70:1. (Citations on request.) By that standard, bicycling is literally safer than NOT bicycling. I suspect the same benefits would appear in other aerobic activities, like running, walking, swimming, skiing, and many active sports.
Thanks for a great laugh Chris:-)
When you engage in more than one risky endeavor at the same time (e.g. just waking up at age 90, and base jumping at age 90), I assume that some of the risks are independent, and some are cumulative. Just being alive incurs the risk of death by disease, crime, or having a grand piano fall on your head. Base jumping incurs additional risks, such as, well you know, splat, but you *can* still die of a stroke while jumping off El Capitan. (But it’s probably less likely you will be squashed by a falling baby grand, I suppose).
So, I don’t think you can ever really say that your flying is “no more risky than just waking up in the morning”.
That being said, I apologize for being the sole obsessive-compulsive idiot to take your amusing comment too literally, thus missing the obvious humorous intent!
Would the waking up risk be accumulative to the flying risk? or would not waking up and flying lower it?
And does being killed by a falling baby grande on El’ Captain go into the climbing category or the grand category? Some sports have odd risks.
On a more serious note, a previous associate did do some analysis of paragliding crashes in NZ, as head of the paragliding association, and found there were accident peaks at milestones. Like the the 50th hours, 100th, 1000th etc (can’t remember the exact milestones). Meaning your risk isn’t stable, and your attitude and focus very much does influence your outcomes.
A thought provoking article. Please note a low airtime paraglider pilot is 20 hours pa. Good active pilot is 50+, 100+ common in Ireland with poor conditions.
You assume 200 minutes 3.33 hours rather than 20+.
Factor of 6-7 bringing paragliding down to danger of horse riding. Lower if you use active pilot who could fly 3 hours a day.
Use data estimates from each of the sports associations? The real risk is not being aware it is a risky sport and therefore not doing tailored training.
We do not support paraglide earth and such sites as any loon can post a flight even from illegal sites that are banned from being flown.
The error is in Choosing just some countries… It’s not an honest comparison, you should compare globally for all sports. While glider flying in the mountains is much more risk full then glider flying in flat lands like the netherlands.
Zendesigner – I agree it would be best to have global data but they are just not available. I’m pretty sure you are right that flat land flying is safer than mountain soaring, and therefore the risk in the Netherlands is likely to be lower than average. However, I think that Germany and France are quite representative for soaring overall. First, the two countries combined represent about 1\3 of all soaring globally, and second, both countries have a good mix of mountain and flatland flying.
I’d imagine that the vast majority of flown hours in Germany are non-Alpine, especially when looking at clubs over 100km from the southern border.
Online Contest (https://www.onlinecontest.org/olc-3.0/gliding/index.html?c=C0&sc=&st=olc&rt=olc) is probably the easiest sample source for flight data.
(A glider pilot’s wife who would love to keep believing that soaring is safer than the drive to the airfield, especially when he’s doing aerobatics)
Thanks Amanda. Yes, the majority of German soaring is in flat land areas. With respect to the risks, stats are only that: stats. Glider pilots have a lot of control over the level of risk they are prepared to take on. I don’t have data to show it but I have seen no indication that aerobatics is more dangerous as long as pilots take the necessary precautions, don’t get complacent, and keep good safety margins at all time. Aerobatic pilots are on average probably more skilled than others. Complacency would likely be their biggest threat.
I think that another important variable, and something that is found on most general surveys, is level of education. I’m not really sure how well pilots are trained in other parts of the world; i.e. product of a training mill? Subject to group biases due to bigger overall population of pilots in one place, giving false security to new pilots? SIV training attendance? These are just a few variables that should decrease risk. The overall point is well taken, and should prompt all of us to improve our safety standards. As a commercial instrument pilot, instructor, and tandem instructor, I often use ADM mitigation. This is free from the FAA and found in a google search as PDF under private pilot handbook. I recommend that everyone read that chapter.
Troy – I can only speak for flying sailplanes, and yes, there are big differences in training – from country to country, and also from airfield to airfield. However, I don’t know if there is enough data to find a correlation (let alone causation) between training and likelihood of accidents – anecdotal evidence might be all we have. I like the ADM framework. In addition, there is a lot we can learn from accident reports to help us become safer pilots. Based on my research, most glider accidents tend to be the cause of a) mistakes in airmanship, b) wrong decision making, or c) poor/negligent preparation. All of these require self-awareness of one’s limitations and propensity to get one self into trouble. Training can help with all three. Thanks for your comment!
I agree. After 55 years of Mountain soaring, mainly in the Austrian alps, I wrote the book “Faszination Gebirgssegelflug “, Motorbuchverlag. There you can read my opininion about the dangers of mountain soaring.
I also suspect the same as you. I agree that I would believe glidning in min mountainous Terrain to be safer than driving a motorcycle.
A more detailed analysis might show A difference in statistics between Germany and France, as for Flying in the alps only France Austria and italy might show this.
An issue might be competition flying that might show up in the statistics for Germany.
I’d like to know whether the statistic is for riding motorcycles on the road, or racing them too. We know quite a few gliding accidents are during competitions, it would be interesting to see the comparison of non-competitive gliding against motorcycle touring, and gliding competitions against accidents in the track
I’m pretty sure the source stats exclude motorcycle racing. And yes, they include glider contest flying. I’d also be interested seeing if there would be a difference if you would separate out glider racing. You would have to look at each glider fatality in Germany and France for the past 15 years and identify if a fatality occurred during a contest, provided that this is noted in the accident report (which it may or may not be). You would also have to make an estimate what percentage of gliding is done at contests. I’m not sure if you could really get to reliable data but you can try. I’d be curious what you find.
Any competition will increase risk. I noticed this when competing in hang gliding and motorcycle racing. Finding myself too competitive for my own sense of safety, I quit competing.
Nice article. I am paragliding pilot and you have to consider the fact about most accidents in the sports are caused of pilot errors due to hes lack of training and capability of taking high amounts of G-forces.
Every single accident I have looked at are cause of this reason.
Paragliding is high demanding both mentally and physically.
If you take out these rookies you will see among us professional pilots there are almost no fatal accidents.
Best regards and fly safe
Hi Björn. Interesting. I have not looked at the reasons for paragliding accidents specifically and can’t comment on that. Most (but not all) sailplane accidents are avoidable but a lot of accidents have involved very experienced pilots including multiple world champions. I’m a bit surprised that this is not true for paragliding but I don’t have data to claim otherwise.
Outstanding article, thank you so much for putting that up!
I was going to ask that, “lot of accidents have involved very experienced pilots including multiple world champions”, based on what you know, do you think that accidents on gliders happens more often to experienced people than to beginners?
Hi Wes, no, I wouldn’t say that. But experienced pilots tend to make different mistakes leading to accidents. I did a deep dive analysis of ~250 soaring accidents to try and determine the root causes. You can find it here: https://chessintheair.com/does-soaring-have-to-be-so-dangerous/
By the way Clemens, when you say x% chance of death in the next 1000 hours, does that mean
– the next 1000 hours air time
or
– the next 1000 hours of your life, assuming a certain rate of flying per day / week/ year.
I’m afraid Björn you are not looking hard enough: I know personally paraglider pilots that have died paragliding with 10s of hours, 100s of hours and 1000s of hours. This is exactly what Clemens is pointing out, that you need to be aware of the risks and not become complacent with thinking such things as “I am a very experienced professional pilot so won’t have an accident and die”. With 2000hrs airtime on paragliders (over 20 years) at 2.9% chance of dying per 1000hrs I hope to keep my mind focused enough to surveive another 5000, and fly on my 100th birthday. Or at least as Chris Field wrote (which is brilliant), at least to the age where flying is no more risky than waking up in the morning!
Bjorn, I’m sure you’re right that the incidence of accidents is higher among rookies. But I have heard of many experienced paragliding pilots having serious and even fatal accidents. I know, because this always worried me – it indicates the element of freak weather or equipment events.
By the way let’s not forget that death isn’t the only risk we run – among paragliders, breaking spines and ankles and other bones is probably more common than death – and can be very serious, life changing events. Would be interesting to see data on serious injuries too, if that’s available.
I would imagine that accidents for base jumpers and skydivers (and commercial air passengers) are more likely to be fatal, whereas motorcycles, horse riding, and even paragliding will have higher incidence of serious injury. Simply based on the force with which one hits the ground.
Great article by the way Clemens, this is amazing information which I tried to google a decade back. “just how much risk are we taking” was my question.
Stats shown are for DEATHS. Not injuries. Comparing injuries is an impossible morass. Death is a definitive distinctive comparison.
Clearly sports where you need wings have far more deaths than injuries compared to sports where your feet are on the ground or you can swim/paddle to safety such as white water kayaking
You can’t cherry pick statistics. That’s the point. It’s like saying I don’t plan on having an accident. “Accident”, by definition: An unplanned event. So saying no professional pilot has an accident is superfluous as you were once a novice! This means you and everyone else in the sport was subject and IS subject to accidents. It’s just the likeliness changes. Don’t kid yourself for one second about safety.
Maybe you can add boating/sailing to this list:
https://www.uscgboating.org/library/accident-statistics/Recreational-Boating-Statistics-2017.pdf
Thanks! Very detailed data on boating accidents. The one thing I didn’t see (but would need) is the total number of boating hours per year for the same area that the study covers, i.e., the entire US. There is detailed data on fatalities and also on how many registered vessels there, are but I don’t have a good sense how many hours on average a registered vessel is used in any year. (Some are used a lot, some not at all, I really can’t make a good guess.) I’d also need to know the average number of people in a boat.
Since 2009 I’ve fallen 3 times on my motorcycle.
Since 2007 I just had a sore heel from a hard landing while paragliding.
The conclusion from the above is none.
I think the risk of me having an accident is related to the tendency to take risk from all others around. Also, relates to my ability to maneuver, to practice safe strategies and to keep the reflexes current.
I feel safer while paragliding because I can better control my environment. I can relate the weather conditions, I determine my ability to handle them, I determine how many are flying, who are they and their ability to comply to the rules and keep safe distances.
On the road, I cannot predict who’s on the road with me, if there’s any slippery surface in the corner or other unpredictables.
Therefore, the risk calculation in this article is at best an honest attempt to average all the people who practice these activities. It tries to average all spectre of people, since the careful and calculist to the unprepared and/or prone to risk taking impacient person.
Hi Zak – thank you for sharing your thoughts! Yes, you are absolutely right that I only reported data and that the data reflect the results of everyone participating in these activities, i.e. the more skilled and the less skilled, the more careful and the less careful. It is also totally normal to feel safer in environments where you have the sense of having greater control. E.g., many people feel much safer driving their car (where they have a significant amount of control) than they feel when boarding a commercial flight (where they truly have no control at all). Feelings can be deceiving. That said, you are absolutely right that in paragliding you have a lot of ability to reduce your level of risk – you even listed several important ones. The majority of flying accidents are avoidable and if you continue to be diligent and work on your skills you can definitely make your personal odds much better than the average.
It’s probably much more dangerous than that, as the vast majority of motorcycle deaths are inexperienced, fearless young guys, while glider pilots have all received extensive training and tend to be a bit older
I don’t think that short thrills should be compared on the basis of participation hours, but on the basis of number of times that they are done per year. I do not have figures to support thus, but for instance: a long base jump is no more dangerous than a short one. And with paragliding I have the impression that the take-off and landing are the most dangerous phase of the flight.
These statistics are based on all else being equal, but I’m sure there’s a lot of variation based on experience, intelligence, and individual attitudes toward safety.
I’m not a glider pilot, but flew with a friend last week over the front range of Colorado. I felt safe because of his good attitude toward safety and experience as a pilot – not only a glider instructor pilot, but a retired Air Force test pilot, helicopter pilot, and numerous other ratings.
I have however, been riding motorcycles for almost 45 years, and attitudes toward safety apply the same. For example, in the vast majority of motorcycle deaths the rider never attended a motorcycle safety class and/or was not wearing proper safety gear (such as a helmet).
How long does it take to put in 1000 hours of gliding? How long does it take to put in 1000 hours of motorcycling. Many motorcyclists ride at least an hour a day, not to mention how many of them there are. So, we all hear about more motorcycle accidents because there are so many motorcycle hours being ridden.
I like the attempt at a fresh metric for comparing risk, and your analysis seems fairly rigorous, although I don’t think you do justice to how loose that estimate is for base jumping deaths… It’s pretty much a WAG, which includes data from the start of the sport, prior to many modern advances in parachute and wingsuit technology. This is not to say that there’s any hard evidence that these things have made the sport safer, in only pointing out that the number you picked is a complete WAG since noone has good data, and what data is available is typically limited to single exit points and I don’t think it’s possible to draw many fair and accurate conclusions from it. Also, you use a wingsuit graphic to represent base jumping in general, which I find misleading, because wingsuit base appears to be even more dangerous than non wingsuit base, and they are quite different activities, but I think anyone trying to pin an accurate number on the risks of these sports without a well funded, comprehensive study creating entirely new data sets with much better reliability is not going to be very productive.
Hi Josh, thanks for the thoughtful comment! I totally agree that Base Jumping stats were some of the hardest to come by and I realize the data is weak. And I appreciate the difference between with/without wing suit. Also, I had to make a guess as to the average duration of the jump. There are a lot of variables and the risk could be somewhat lower or even higher. Other activities are also very dangerous but have no data. E.g., extreme skiing/snowboarding or free climbing might get up there with Base Jumping but unsurprisingly there are no good data available for either of these either. Thanks again!
I like the attempt at a fresh metric for comparing risk, and your analysis seems fairly rigorous, although I don’t think you do justice to how loose that estimate is for base jumping deaths… It’s pretty much a WAG, which includes data from the start of the sport, prior to many modern advances in parachute and wingsuit technology. This is not to say that there’s any hard evidence that these things have made the sport safer, I’m only pointing out that the number you picked is a complete WAG (as noted in the website you sourced it from…) since noone has good data, and what data is available is typically limited to single exit points and I don’t think it’s possible to draw many fair and accurate conclusions from it. Also, you use a wingsuit graphic to represent base jumping in general, which I find misleading, because wingsuit base appears to be even more dangerous than non wingsuit base, and they are quite different activities, but I think anyone trying to pin an accurate number on the risks of these sports without a well funded, comprehensive study creating entirely new data sets with much better reliability is not going to be very productive. Either way, it’s still probably top of the list, but I look forward to the day where we can get FAA quality stats on it, and really start to improve the safety of it.
Any way to break out paragliding into regular and speed/mini wings? Speed flying appears to be *way* riskier, so it would be great to know the split!
Sorry, I didn’t see any data at all that would allow to do that.
Don’t think you’ll find that much data on speedflying. Speedflying is likely just as dangerous or more dangerous than base jumping(regular). Once you put on a wingsuit it’s likely more dangerous
Interesting comprehensive analysis. I think the Formula 1 could be revisited seeing as the stats date back to 1950’s where safety was non existent. Massive changes in safety since Senna’s death in 1992. If memory serves me correct there has only been 1 death since then.
Luke – yes, you are right, the risk in Formula 1 racing was even much higher in the early days and it has significantly decreased over the last decades, such that the average most likely overstates the current risk.
After Ayrton Senna’s death in 1994, safety on formula 1 was reformulated and brought to a new level.
Thanks! Yes, it’s a great example that even extreme sports can get much safer if we are willing to do something about it.
Agreed. There were years in the past where they would tragically have 4 deaths in one year. Now it is much much safer.
Good point and well put.
All of which makes me happy I survived 50+ years of flying powered aircraft and 40+ years of flying saillanes. The first 10 years of driving was probably riskier than all the flying combined, however, neural pathways that support self-preervation being under developed and all.
Your exposé makes me even more delighted that Condor 2 Soaring Simulator and Microsoft Flight Simulator are available.
Tom – thanks for your comment. I might see you at one of the Condor races. 🙂
Good point and well put.
All of which makes me happy I survived 50+ years of flying powered aircraft and 40+ years of flying saillanes. The first 10 years of driving was probably riskier than all the flying combined, however, neural pathways that support self-preservation being under-developed and all.
Your exposé makes me even more delighted that Condor 2 Soaring Simulator and Microsoft Flight Simulator are available.
This is a very misleading statistic on gliding because. (for example)
You would normally ride a motorcycle for three or four hours. Then do something else.
Where as you would turn up to a gliding site rig your glider, help around launch point, fly (for an average of an hour) then spend the rest of the day helping out and de rigging your glider.
In this case the motorcyclist would have had 3 hours of biking and the glider pilot 1 hour. Probably exposed themselves to the same danger. However if you calculate the risk as the glider pilot had a whole day at the gliding club his risk per hour would be much much less than the biker (per hour).
The same can be said for power pilots who tend not to spend all day at the airfield.
Ben – I don’t ride motorcycles and don’t want to make assumptions about how long a typical ride is. I picked participation per hour so everyone can apply the data for themselves. Hope this helps.
But the danger measure is for the risk of flying, not the risk of the other stuff you might enjoy, but isn’t flying.
Can you explain how you arrived at the SCUBA number?
The referenced Wiki article says “1.8 fatalities per million recreational dives” for the US reference population.
Conservatively estimating average diving to be 30 minutes (In my own experience it’s closer to 45), that’s 3.6 Fatalities per million hours, or 1 death every 280,000 hours, not every 120,000 hours.
I wonder when the most dangerous period of my hanggliding was/is. Before, when I flew every possible opportunity and competed and only stayed on the ground when I was really forced to – so when I was young, fit and current but flying in all kinds of conditions. Or now, that I’m physically not fit enough to fly much and only occasionally grab the opportunity, fly like an old lady (which I am), don’t fly anywhere just launch, make a few passes than land – so I’m not doing any kind of risky flying but I’m also not very fit or current. I find myself misjudging how well I am able to launch sometimes, forgetting that I no longer launch everywhere all the time.
H – thanks for sharing your experience.
Thanks so much for sharing this – great stuff!!
I wonder if it would be interesting to normalize risk on number of events (flights) rather than hours, since the prime danger of paragliding, for example, is during launch and landing. This probably also better handles the risk analysis of base-jumping.
While longer flights are usually possible because of thermic conditions and therefore may contain the increased risk of being in those conditions for longer time, the added altitude of the flight portions between launching and landing probably mitigate much of that risk by providing time to recover. Furthermore, non-recoverable incidents at altitude likely result in a reserve toss which reduces the likelihood of death if not injury. For those reasons, the risk of paragliding is heavily biased to the start and end of a flight and therefore do not escalate significantly with time in the air.
Contrast this to motorcycle riding, for example, where the risk is evenly distributed throughout the ride and therefore directly proportional to time on the bike.
So activities like paragliding, base-jumping, sky-diving, etc. are better normalized by activity count while activities like scuba, motorcycling, mountain biking, etc, are best normalized by hour count.
Just my $.02 – but a wonderful article – thanks for putting it out there!!
Dave, thanks for your comments. Yes, for some activities “per event” might be a better measure. All methodologies have pros and minuses. I explained why I used activity hour as the one that I felt most appropriate for me. That does not make other methods worse or less valid.
Great work!
Clemens, would you consider appending a data table to this blog? I do think your chosen metric makes the most sense if you can only have one–but I’d love to play around with others in a spreadsheet.
As an aside, I’m now imaging my 94-year grandfather perpetually paragliding, day and night. It gives me a sense of the precariousness of his life which I don’t intuit from his age alone. And a morbid solidarity when I’m flying 🙂
Josh – here is the basis for the estimate that I used for scuba diving: “fatality rate per dive is a better measure of exposure risk, A mean annual fatality rate of 0.48 deaths per 100,000 student dives per year and 0.54 deaths per 100,000 BSAC dives per year and 1.03 deaths per 100,000 non-BSAC dives per year during 2007.” Source: https://en.wikipedia.org/wiki/Scuba_diving_fatalities. I estimated the length of an average dive at between 40-50 minutes (based on an informal survey on a scuba blog – source: https://www.scubaboard.com/community/threads/how-long-is-a-dive.12889/). I arrived at an expected death rate in the range of once per 64,725-173,611 hours and took the average between the two, rounded to 120,000. I don’t know much about scuba diving and have never done it myself. If you have data that is more reliable, please let me know. As with all the data, many of the sources have big ranges so take the data as directional only, they are not accurate in a scientific sense.
After further thought:
One very unscientific measure of the risk of flying comes from 16 years of operating a “flightseeing” business using two 1920s biplanes, two WW2 aircraft, and two little tandem-seat single-engine birds we used for mock-dogfights. During that period we never scratched a soul, but 17 people no-showed for flights that we later learned were the result of a car accident or incident. Presumably and an unknown, arguably equal, number of people had problems driving home.
On the subject of estimating risk, I must recommend Stephen J, Gould’s “The Median Isn’t the Message.” https://journalofethics.ama-assn.org/article/median-isnt-message/2013-01
Tom – thanks for sharing that article! There’s a good point there: the variation in soaring fatalities is practically infinite, some die on their first flight and most die never during soaring at all. As pilots, we all want to beat the odds, just like the person who wrote the article did. I think knowledge of the stats can help to take the risks seriously. That’s the main reason for publishing them. Most soaring deaths can be avoided, not so much by being optimistic that nothing will happen, but by being mindful of the risks that exist and making decisions that minimize getting into situations where the risk becomes unmanageable. Your business might be a great example of managing these risks well. Congrats on operating is safely for so many years!
“Most soaring deaths can be avoided…by being mindful of the risks that exist and making decisions that minimize getting into situations where the risk becomes unmanageable….”
Absolutely, risk management is, after all, the point.
But you can’t fix stupid. And I just proved that minutes ago in an online Condor 2 soaring race. Did everything right in a lovely Diana 2 and was at the top of the list against 54 other pilots right up until 0.02 miles from the finish line.
The mark was on a steep downwind hillside and my final glide computer and precise flying put me right at zero feet when I arrived.
“Huge sink and trees, be damned, I can make this finish,” says I.
But reality bites. I didn’t stall and I didn’t spin, but I sure as hell flew into the trees literally feet from the finish line.
Until this second, while writing this, it never occurred to me that there was no reason to pass the mark to starboard on the uphill side, when the line was hundreds of feet wide and extended away from the mountain at least 300 meters above the valley floor. A last-second dolphin oop-dee-doo finish, well away from the mountain, would have been easy. Years of sailboat racing is the only excuse I can conjure.
Nope, you can’t fix stupid.
Great work. A refreshing take. Thanks for trying to normalize the data for comparison. It always bugged me how risk data has been presented in the past. This is a big upgrade.
Very nice article. I rock climb and fly gliders. Was there a reason for only picking climbing in the Tetons? I’m assuming no good data? I’d be curious as to the comparison of rock climbing overall and flying gliders.
Andrew – Yes, I could find fairly good data from a study specifically about climbing the Tetons, but nothing overall.
Hmmm. The American Alpine Club might have some. Of course, similarly to the potential differences in mountain vs flatland soaring mentioned above, there would be differences between bouldering, sport and trad rock climbing. I’ll let you know if I find some data. Thanks for the quick reply.
Great article and refreshing to see an analysis done by someone with at least a basic understanding of statistics (unlike most journalists). But I wonder how good the data is. I, for example, hang glide and scuba dive, but I don’t report how many hours I do these activities, so while I’m sure my death while undertaking these activities would be recorded somewhere, how would they know how many hours I had anticipated in the activity? And even if that were investigated, that only records how often people who die flew or dove before dying, whereas there may be many who dive (or fly) thousands of hours, but don’t die from it, and their successful avoidance of killing themselves is never reflected in the statistics because it’s never recorded. Finally, I’m sure the per hour danger of a (probably new) hang glider pilot who flies only a few hours a year is much higher than the per hour danger of a (necessarily, more experienced) hang glider pilot flying, say, 100 hours per year. Nevertheless, the analysis made the most of the data we have and I found it very informative.
Edward – thanks for your comments. You are absolutely right that good quality stats about many of the activities are difficult to find and that the information is directional and cannot be considered accurate. I noted that in the article and on the chart as well. For paragliding I used data from Germany about the number of pilots and then I searched for surveys of pilots to estimate the average flight hours per year per pilot. The numbers are obviously just directional. For hang gliding, the UK government published a datapoint for fatalities per flight although I don’t know how they determined that. I then estimated an average duration per flight. For scuba diving I found data that estimated the fatality rate per number of dives and estimated an average duration of a dive once again by looking at surveys in the scuba diving community. It’s the best I could find and I think at least the order of magnitude will be right for most activities. Ideally I would have quoted range estimates or provided a standard deviation / error range. If anyone has better data, I’d like to know. For soaring (flying sailplanes), which I was most interested in personally, I was lucky to find reasonably good data for France and for Germany, which together account for about 1/3 of all glider flights globally and which I consider quite representative overall. – Hope this helps.
I’d love to see the climbing broken down. Mountaineering is very different from sport and Trad climbing. You can do all 3 in the Tetons. There’s a famous route up the Grand Teton that people do without ropes. Is that it? Or is it Trad multipitch with ropes and gear? I doubt there are many deaths from sport climbing but I’m curious
Sean – I don’t know enough about the various types of rock climbing. I found a study that was specific to the Tetons that looked to me fairly well researched and that’s what I based the number on. You can find the source quoted at the bottom of the chart.
The source for climbing in the Tetons cites data from 1986. Climbing best practices and safety protocols have improved a lot since then.
Book Published EVERY YEAR: Climbing Accidents of North America or Accidents in North America has this listed out in appendix Tables. https://www.google.com/books/edition/Accidents_in_North_American_Climbing_202/o6AQEAAAQBAJ?hl=en&gbpv=1
Vast Majority of deaths are from 4 categories:
1) Fall slip on rock divided 60% ascending and 40% descending from unroped, AKA getting TO/FROM the climb class 3~4
2) Fall slip on ice/snow non belayed to your death usually
First 2 are majority of deaths…
3) Falling rock snow(almost killed my brother and myself with this category twice)
4) Avalanche(includes mostly skiers and snowmobilers but some climbers as well especially in Alaska/Alberta/BC
#1 Cause leading to these problems? Exceeding capabilities.
#2 Cause Ignorance Clothing/protection
#1/#2 are really the same thing and contribute ~75% of all deaths
#3 Cause at way way lower than first 2: Weather–> Mostly big climbs in Alaska
Bottom Line: Ignorance, hubris(not roping up placing pro) leads to VAST super majority of deaths in Mountain/Rock/Ice climbing in North America.
Hope this helps:
Brian Foote
This is probably the best analysis of this type I’ve seen. One assumption that I disagree with is skydiving. The assumption you cite is 5-7min per skydive. While this is true that the free fall and canopy portion of the skydive is only about 5min, the skydiver will then spend about 20min packing their parachute and 20min riding back up in the airplane before being able to make another jump. And that’s assuming the manifest is moving quick enough to get them on a plane as soon as they are ready without further waiting. On a good day, skydivers make about 1 jump per hour and will do 3-5 jumps per day of jumping. Whereas say a paraglider pilot might have to hike up to launch, but will then fly for the average 20min continuously which is equivalent action time to doing 4 skydives. I would argue that the data shows paragliding is significantly more dangerous than skydiving (I am active in both sports and actually prefer paragliding). Similar issues may exist with other sports as well.
That said I think it is missing one more piece to bring it more apples to apples. I like how you show the data on the “per usage hour” denominator basis. This allows each person to customize their own risk assessments based on the number of hours that they personally would spend participating in the sports. However, stopping the analysis there leads to misleading conclusions because the average usage hours of each sport can vary substantially. I think it would be prudent to take an estimate of the total usage hours that the average recreational participant has in each sport per year. Then normalize the numbers based on the odds of dying per year in the sport. The existing work you have published is still critical because it allows people to adjust the numbers based on how many hours they will actually spend per year on each sport. But let’s be honest, most people won’t read anything and jump to the money chart to draw conclusions. The conclusions will be misleading because the usage hours per year differ dramatically between the sports. I think it would be useful to have an additional final chart that does some sort of normalization based on usage hours per year.
This would also help normalize BASE a bit more since it is very difficult to crank out multiple BASE jumps in a short time period and most jumpers don’t try to unless at an event such as Bridge Day or KL Tower. Sadly, even normalized in this way I’m sure the data would still show the risk level of the sport being insane.
Rob – thanks for commenting. I’ve explained in the article why I picked the methodology I used. There are definitely also other valid ways to look at the data. They all would tell you something different. They are not better or worse per se, just different. It really depends what you want to know.
Bruno’s talk is available in English: https://www.dg-flugzeugbau.de/en/library/safety-comes-first
Other soaring safety articles are on this page of my website: https://ee.stanford.edu/~hellman/soaring/safety.html
Martin – awesome, thanks for sharing!
Very interesting article! As a paraglider pilot it is valuable to see this in as black and white as this even if there are endless things that complicates the comparison. Using time as a key metric I wonder how you define where it starts and stop. For sky diving I’m guessing you don’t only count the handful of minutes the jump takes but also the time the activities that surrounds the jump takes (packing, waiting, flying etc.). Where do you draw the boundaries?
Jens – In general, I tried to count only the time from jump until landing, not the preparation surrounding it (because it is not dangerous per se, and as you rightly suggest, drawing a line somewhere else would be totally arbitrary. If you look at the bottom of the chart you can see the sources and assumptions (I.e. estimates) that I used.
Thanks!
Very nice. I did a similar thing back when I got my motorcycle license, and it yielded some interesting results, too: SCUBA diving and horseback riding are both more dangerous than riding a motorcycle per activity hour, contrary to what seems like common perception. Also interesting to note is that in 26% of US motorcycle fatalities, the rider wasn’t even licensed; in 28% alcohol was involved. It’s a bit harder to hop into a glider sauced or unlicensed!! These nuances make a big difference in thinking about the relative risks of activities.
https://www.dropbox.com/s/drf6z5j0xj726fh/Motorcycles%20%26%20Risk.pdf?dl=0
The thing is, this stuff is all dangerous. There is always some risk. People like to think there isn’t, but there always is. I’ve seen a pedestrian hit by a bus, one of the most violent things I’ve seen. Who knew wearing a hoodie (and limiting your peripheral vision) while you cross the street was dangerous!?
Another thought, for the benefit of people like us attracted to the exciting things in life: it is really difficult to come to an accurate conclusion *in the moment* just how much danger you are in. That’s the scary thing with a lot of this stuff. But if you adopt a humble, patient attitude of playing it safe, you will not only eventually accumulate a wise knowledge base and an impressive skillset, but you will also still be alive. In EACH of my three near-fatal accidents (jetski, paragliding, motorcycle), I convinced myself I was being responsible at the time. In hindsight I was obviously being a fool, and in each of the cases I held the attitude of “push it!! how else can I improve!? how else can I achieve!!?” Don’t. Be patient. Keep calm, keep humble. In those moments of terror as an accident is unfolding, your supposedly compelling reasons for doing whatever stupid thing you were doing will evaporate into absolute worthlessness.
Hi Mark, thank you very much for the thoughtful and thought-provoking reply. There’s a lot of wisdom in there. Thanks also for sharing your prior research. I was sure I wasn’t the only one who had that idea – I just could not find anything. I can tell you did a lot of work on this and I hope it has helped you make smart decisions. Thanks again!!
Would it be possible to more general stats for climbing rather than extreme mountains? Perhaps you could use starts for sport climbing (bolted) ? I imagine it’s not easy which is why you went for the Tetons and Everest but these are very very extreme singular locations from the climbing world…
Matthew – thanks for your interest. It might be possible but I don’t have the data to do so. And yes, I used the Tetons and Everest because there are reasonably good data available.
If you exclude ridge soaring ,collision and alpine flying then gliding risk should be calculated per flight not per hour; likewise for other
flying sports. If you put UK gliding into the mix, things will look much better; in the last two years , as reported in the S and G
magazine there have been NO fatalities and vary few serious
accidents. In 4500 hrs gliding (60 years) I have only had
two near collisions and three landing accidents (two force majeure, outside my control)
John F ( five international contests.)
Hi John – risk by flight is definitely another valid metric, it just measures something different and makes it more difficult to compare flying to other activities. Every methodology has pluses and minuses. I do not know why I would want to exclude ridge soaring, collision risks, and alpine/mountain flying though. These are part of the risks of the sport. I’m glad your near misses were just that and that you’re here to tell the story. I’m also glad that there were no fatal accidents in the UK in the last two years, let’s hope it stays this way. All the best!
Intuitively I still believe that driving home is more dangerous that climbing or paragliding because we are tired after a long day. As a scientist I like your methodology. Most practical decisions require sound judgment based on a mix of statistical numbers and assessment of a specific situation including objective and subjective factors. It would be great if you could help to come up with simple rules for our sport to help to assess a situation similar to the methods developed for avalanche risk assessment.
Thanks Clemens for a great article. Risk analysis is a passion both in my personal life (paragliding, drinking..living) and professional life (financial risk analysis academic). Your article and all the comments that flowed shows that risk (in your definition the risk of death) as certainly a slippery variable to measure and interpret. Throw into the mix individual decisions, skills and psychological biases all which can dramatically alter probabilities and perception of probabilities of death (and injury). I have had risk averse paragliding friends die of cancer while risk seeking ones continually survive (up to now anyway), drinking, smoking and doing crazy shit. Its a funny world. I guess we gotta just make the best decisions we can and live life to the fullest. Again thanks for a great article and thanks to all the others who have made comments. Its certainly a great topic of discussion. There is no absolute right answer to the question what is riskier…the only thing that isn’t risky is death itself…although the way genetic engineering is going it may be that death itself isn’t 100% certain anymore…
Hi Barry – thanks for your thoughtful comments! Yes, there’s no doubt that some of the most risk averse people will die anyway and some of the biggest risk seekers will live a very long life. As you know very well, stats can never predict what will happen to any one individual, especially on something that has a binary outcome (you’re either 100% alive or you’re 100% dead). I’m convinced that – all other things equal – risk seekers have a higher probability of dying before any given age than risk averse people. But of course this doesn’t mean that one is necessarily happier than the other. Discussing the relationship between risk-seeking/risk-aversion and happiness or “living life to the fullest” was beyond my intent with this article and quickly gets into the realm of ethics and philosophy. These questions are worth pondering but as you say they do not have a right or wrong answer. So: have fun and stay safe! 😉
I’m curious what the fatality rate is for cross-country (i.e. non-downhill) mountain biking. On one hand it could be lower than that of general cycling since unlike cycling on the road, mountain bikers don’t have to contend with cars and other large, fast-moving vehicles. On the other hand, even non-downhill mountain biking involves uneven terrain the occasional accidents — so perhaps the risk of cross-country mountain biking is somewhere in the middle of general cycling and downhill mountain biking?
I searched for fatality statistics on non-downhill mountain biking and couldn’t find any. Let me know if you know of a good source.
Thanks for the article, great perspective!
Typo — “uneven terrain the occasional accidents” should read “uneven terrain and the occasional accident.” 🙂
Hi Brennan – I was looking for stats on XC mountain biking as well and could not find anything either. My sense is that the injury rate is likely to be fairly high but the fatality rate not so much because the speeds are much lower than in downhill MTB. But as I said I have no data to show that. I did some XC MTB racing a decade ago and have had some crashes and injuries – mostly by clipping trees when going too closely around tight corners.
Great work, thanks for putting the time and effort into this!
Sad to see you did not look at canoe, kayak, and whitewater rafting.
The FHWA’s 6 mph estimated average for cycling seems low to me. Even on streets with traffic signals, which i obey, I average 8 to 10 mph, and I am not a fast cyclist. Only in congested traffic (and particularly on crowded bikeways and shared-use paths) is my average speed much slower than that. If the average speed is higher, then cycling is even safer than you rate it. but also, the number hours spent in the activity is notoriously difficult to measure for cycling.
Great research! Thanks for putting time into creating this Clemens!
Thank you for sharing your research with us!
This is excellent research. Well studied, well communicated. Well done.
My only concern is that I think you have overstated the risk of your base metric, and therefore the risk of, say driving, vs flying in an US airliner is distorted. The Wikipedia citation for passenger miles is calculated at .2 deaths per 2 billion passenger miles (per your graphic), but the statistic on Wikipedia is .2 deaths per 10 billion passenger miles (2000-2010).
However, wikipedia appears to be citing Bureau of Statistics numbers that include General Aviation, as the page linked is showing hundreds of passenger deaths in all of aviation (numerator) over “Air carrier, certificated, domestic, all services” (denominator). They should be looking at either FAA or NTSB statistics on Part 121 passenger fatalities divided by passenger miles. The citation is also for old data, as it looks at 2000-2010, which had hundreds of passenger fatalities, rather than the last decade which had all of 2 (two). In that time period, US domestic airlines flew over 6 trillion passenger miles, so the current fatality rate would be 1 per 3 trillion passenger miles.
This is nitpicking, but an average of 500mph seems really fast. Airliners are restricted to 250 knots below 10,000′ so takeoff, climbout, the instrument approach, etc. would all lower that average speed. And that doesn’t even account for boarding, taxi and deplaning, all of which would be included in the numerator (passenger fatalities) per NTSB definitions (49 cfr 830).
To get a more reasonable estimate of a passenger’s fatality risk per participant hot, you’d need to look at a sample of scheduled route arrival and departure times vs distance between airports. It will be much lower than 500mph.
Of course, when only 2 passengers died in over 6 trillion passenger miles over the course of the last decade, it doesn’t make a huge difference.
All that to say, commercial aviation safety is incredibly safe, and as a result, your graphic is a little skewed.
Hi A Walton – thanks for taking the time to write such thoughtful and detailed comments. You’re making very good points with respect to the time period and the average speed that I used. Based on what you’re saying, if you just look at the last decade and at the US only, commercial air travel is indeed much safer than indicated – in fact, it is so safe that probably pretty much any activity will seem risky by comparison, maybe even getting out of bed or walking through the front door of your home… My only caveat would be that it would be problematic to use a period with only 2 deaths – even if it was an entire decade. At some point – hopefully later than sooner – there will be another accident with many more deaths, which could then suddenly change the risk by a factor of hundred from one day to the next. So you’re right, it has gotten so safe that it’s become almost meaningless to even use it as a baseline for such a comparison. One way to address this would be to use global data instead of US data and there we would see a very different picture, not just 2 deaths over a decade. In any case, the overall idea of my chart is of course to compare the risks of various activities in relation to each other, and that works just the same, even if the baseline data isn’t quite what it’s stated as. Thanks again for taking the time to comment!
Hi Clemens,
Thanks for the quick, thoughtful response.
I agree, domestic airlines fatality rate is almost meaningless as a base metric, and there is certainly variability. Global data for jet transports is published by Boeing in an annual “statsum”, and shows that there has been a pretty big improvement in this decade vs the previous one. It excludes turboprops and Russian built aircraft but would give you numbers you could use.
It is a complex issue. An acquaintance is about to publish a book with a whole chapter on aviation safety statistics. Trying to compare across modes is a challenge for which there isn’t a standard answer.
Alternatively, IIHS data comparing cars, pickups and SUVs shows that new SUVs are about 4 times safer than new cars, so you could use something like that and your logarithmic scale (which is really awesome, by the way).
Does the relative risk of cars vs commercial airlines matter in any sense practically? It’s does in one way. There is a debate about whether lap infants should be allowed on aircraft. The FAA has argued that domestic airlines flights are so much safer than cars that increasing the travel cost for a young family to fly over the holidays (vs driving) could result in some families deciding to drive which would be far more dangerous than carrying a lap infant. The car seat community and recently the NTSB argue that parents should purchase an extra place ticket and keep their infants in a car seat during all flights, because that would be somewhat safer than the infant being held in a lap. I’m usually a huge fan of the NTSB, but in this case I agree with the FAA. Riding in a car is the leading risk to my children according to CDC numbers. There will likely be 30,000 Americans killed on the road next year. There will probably be no one killed on a passenger jet. It would be far better for families to save $300 on a plane trip and use that money to either a) upgrade their child’s car seat or b) get a bigger, heavier rental car while on vacation.
Thanks again! Excellent points! Your baby seat example makes perfect rationale sense – it would certainly be safer for infants to travel on a plane in someone’s lap vs taking the car. Unfortunately, policy makers aren’t always rational, and often that’s because the public that they are trying to please or placate, isn’t; no policy maker wants to be responsible for the lap sitting baby that one day will get hurt during a turbulent flight and the tragic story makes TV headlines. The fact that it was still safer for the baby to travel this way than to go by car would sadly be lost on almost everyone.
As a general aviation pilot, I am deeply concerned about safety in the field, and am a consumer of accident statistics.
Over at https://www.faa.gov/news/fact_sheets/news_story.cfm?newsId=21274 under the heading “Previous eight-year GA fatal accident rates and numbers”, there is a notation that in FY2016, there were 0.89 fatal accidents per 100,000 flight hours. To use that number as the basis for the calculations would have a risk rate of half of what you showed (0.89% vs 1.6% per thousand hours, or 0.0089 vs 0.016 accidents per thousand hours).
However, here we get to a complicating factor: flight hours and accident rates are per-plane, not per-person.
I’m not sure precisely where you got your figures, but on page 50 of the document linked, they show 376 fatalities and 20,576,000 flight hours. 376 / 20576000 * 1000 * 100 = about 1.82% per 1000 hours – close to your figures. However, here we have a bigger data problem because the flight hours apply per plane and the accident counts apply per person (there are often more than 1 person in a plane). To make the comparison proper, we’d need to multiply the 20,576,000 by the number of people flying to get a count of person-flight hours, THEN do the calculation. I’m not aware of a source of passenger statistics for General Aviation, but I can promise you that many (most?) GA flights have more than one person aboard. The resulting statistics would show it to be considerably safer than you’re showing there.
Hi John, you’re making a very good point about there being on average more than 1 person in a GA aircraft. I should have accounted for this as you say but I overlooked this. I just tried to find a good datapoint to use but a quick search did not reveal a good source. However, according to the source you quoted there were 411 fatalities in 219 fatal accidents. That means there were 1.88 people killed per fatal accident, i.e. there were at a minimum 1.88 people in the aircraft on average (ignoring the fact that occasionally fatalities can also occur on the ground). Since not all people die in a fatal accident, the average number on board was likely higher. A reasonable guess therefore might be that the average number of people on board of GA aircraft would be in the range of 2-4. That would then imply that GA is indeed safer by a factor of 2-4 than what I have shown. This is an important distinction although it does not change the order of magnitude. It does mean, however, that GA is somewhat less dangerous than motorcycling and perhaps about as dangerous as scuba diving. It remains a dangerous activity and is still about 10x more dangerous than driving a car. (Btw – my source for the number of flight hours was this report: https://gama.aero/wp-content/uploads/2016-GAMA-Databook_forWeb.pdf, see page 24 at the bottom right corner where it adds up all flight hours for the US. This was from 2015. The number of fatalities for 2015 was 384 per https://www.faa.gov/news/fact_sheets/news_story.cfm?newsId=21274. I had mistyped this to be 387. The difference is obviously negligible and both numbers vary somewhat from year to year. In short: you are right, GA is probably about 2-4x safer than what I have shown. Thanks for the comment!
John has a great point here.
The .89 fatal accidents per hundred thousand GA hours is the correct number by FAA GAJSC calculations. This number has been fairly stable and slowly declining over the last decade. This is calculated by dividing total fatal accidents (NTSB database) by the estimate of GA flight hours in the FAAs annual GA activity survey.
The activity survey only captures total flight hours, not occupant flight hours, so this is an example of numerator/denominator mismatch, comparable to an editor on Wikipedia dividing all passenger fatalities by air (airline+GA) by all airline flight hours.
Indeed. I just replied to John. I agree, you are both right.
Dear Clemens
After 48 years of Flying Sailplanes, Single Engine Plane, Skiing On and Off Piste, Skydiving, Paragliding, Scuba Diving, Motor Cycling, Car Driving, Mountain Biking, Climbing, Horse Riding and so on and on I ask myself how I survived until know.
Some of that activities i did professional like Flying and Skiing as an instructor. I loved to cross the Alps with my glider, aerobatics and cloud flying. I still enjoy the freedom of Paragliding and Climbing the Mountains with my skis.
My list of incidents is long, very long, but I did never get hurt at all. The bruises in Paragliding I don’t count. What I never would do is Base Jumping, because there is no plan B and a twist happens so often. I love my live and it is the most valuable present given to me. To risk it would be like to despise it and to show all the other how worthless it is for me. To risk it and to feel alive afterwards has nothing to do with courage, rather then having a normal live filled with futility.
So how I survived! I think it’s a combination of live setting, understanding the cause and effect, a lot of luck, experience, respect, to act carefully and listen to the stomach feeling. So everybody can influence his personal risk to a great extent and this should be the key to decide to go on or to stop.
Of course some activities has a smaller green zone of safety like weather and launch condition. A paraglider pilot is much more required than a jet pilot before a take off knowing all the parameters and limits of his plane and runway. A paraglider needs a high level of the ability to assess the relation between the requirement and the own skills. Courage and mental troubles are not helpful to decide.
A glider pilot should know in every moment from the ground up to 200 m how to act and where to land safe, when the connection to the towing plane brakes away. Do you now it? Also first time on a new strip?
Good luck everybody
The numbers for climbing don’t represent rock climbing overall, but rather specifically for climbing in the Tetons which I can state from experience is rather gnarly high alpine rock climbing/mountaineering and would likely include people dying from weather, avalanches, ice climbing etc. The numbers you use are more like a mountaineering statistic, which is much more dangerous than rock climbing. Rock climbing at the local “crag” would have a much lower overall mortality rate.
This won’t be clear to the non climber or even climber who has never alpine climbed.
In climbing terms it would be almost like including base jumping with skydiving numbers.
Hi Nick, thanks for your comment. If you have numbers for “rock climbing overall” please point me to the source. I used the only data I could find. It is very likely that these are particularly dangerous areas.
Hi,
very interesting analysis and point of view. I think the final comparison despite correctly correlated has one flaw. I assume the average parajump takes about 10 minutes and the average number of jumps per year may be 100. Which means you will on average spend about 17 hours a year in the risk zone. GA and gliding averages may be somewhere about 30-50 hours. Driving though may be somewhere in the 1000 hour range. That means given an identical risk, driving would offer a 50x higher chance of dying than paragliding per year. Putting your risk profile together with this estimation makes parajumping still slightly more risk, than driving but GA and gliding are suddenly more safe.
It would really be great if you could include whitewater kayaking in this chart. I love the chart, and the idea generally of having such a chart for a large number of adventure sports is appealing. As a kayaker myself it would be much appreciated to see that data too. Maybe you can do a followup post and include regular rock climbing that I see many readers are also interested in?
I remember I looked for data on whitewater rafting as well but could not find data that I found to be reliable to include it. If you have any, please let me know. Enjoy your sport and be safe!
I actually had this post sent to me as an argument for me to stop climbing, and it looks like the climbing data is narrowly focused on one specific form of climbing in one specific particularly-dangerous area, without really explaining that it’s not representative of climbing in general. It’s probably not as clear to the average reader that this data isn’t representative of the average climbing spot, at least to the same extent that a reader would recognize that Everest is not representative of random mountains that the general public may visit.
Hi A. My chart says specifically “Climbing the Tetons” and “Climbing Everest” – I don’t know how I could have possibly been more clear. Also, I wasn’t looking for specifically risky areas to climb in – these were just the only areas where I could find reasonably reliable data to use. If you have reliable data about rock climbing in general it would be great if you could point me to the source. If you read through the comments, no-one wants “their activity” to be unsafe. Whether it’s motorcycling, rock climbing, or even wing-suit flying… I expected this because as humans we do not like to confront the risks of our chosen activities (whatever the activity is). Confronting the risks creates “cognitive dissonance” and the easiest way to resolve it is to deny the relevance or accuracy of the data. This is unfortunate because for most activities we have a lot of control over the level of risk that we are willing to take and I am convinced that we will only take the precautions seriously enough if we first admit to ourselves that the risks are real and that the precautions are therefore warranted. I obviously don’t know you and have no idea whether those thoughts apply to you. I am also not trying to dissuade you or anyone else from continuing to undertake their chosen sport. (I am a glider pilot and I am still flying… I just have spent a lot of time trying to understand the specific risks and how I can mitigate them to the extent that this is possible). Have fun and climb safe!
Great article. I’ve often thought about the risk distribution within chosen activities, in my case, motorcycling. If the fatalities are allocated further into the attributes of age, experience, vehicle type, etc. you can get a clearer picture of one’s specific risk, which may be helpful to see (in the case of motorcycles, riding a 1000cc sport bike carries considerably more risk than a 250cc motorcycle). I wonder if the sport of gliding could be granularized similarly
I once did a similar calculation to characterize the risk of soaring. I used the average number of soaring deaths per year and the number of active SSA members for the numbers of participants. I came up with a yearly chance of dying of about 1 in 1500 for soaring in the United States. I think it easily could range from 1 in 1000 to 1 in 2000. I would of liked to calculate it by an hourly or on a per flight basis but I really couldn’t find good data to do this at the time. However, I suspect the risk is high on a per hour basis if your not flying enough to be proficient, then drops as your proficiency moves from adequate to really good and then levels off at some point.
Clemens,
This is an excellent article. My wife has been interested in getting her private pilot’s license, however I have been very concerned about risk. I am not a pilot. I have a few friends who are, and of that small number of people (perhaps ten), two have died in plane accidents. One of which I visited at the hospital to see his last hours alive. I contrast this to driving, where I know lots and lots of people that drive and also two that have died. I “figured” gliding would be safer than private planes and your article certainly shows my assumption incorrect.
I recognize all the other uncontrolled variables at play which are simply a consequence of the limitations of the data set you have to work with. In addition, one could argue with normalizing by hour for comparison between activities. However, you’ve made these limitations and the rationale for your normalization choice clear in the article.
In terms of risk, BASE jumping and wingsuit BASE jumping are two different sports. Unlike skydiving, where wearing a wingsuit makes no appreciable difference to injury/fatality stats, with BASE jumping, wearing a wingsuit is much more dangerous than not wearing one.
Do the paragliding fatality statistics in speed flying? I’m looking for a safer sport than BASE and speed flying seems interesting. Thank you for the article, it was helpful. I’ve always felt like multi-pitch rock climbing felt more dangerous than skydiving, so it feels validating to see these stats. Tell that to a skydiver who doesn’t climb and it’ll hurt their ego though lol.
Note that if the BASE stats are from Europe, they may be a bit high since many proximity flyers go there to fly big wingsuits in the mountains
There is absolutely a difference in fatality stats between jumping in BASE jumping in a wingsuit and BASE jumping “slick” (street clothes etc). The wingsuit version deserves its place as the most dangerous sport per unit of time, while your average BASE jump belongs somewhere else on the list, although I am not sure where.
“Andrew – Yes, I could find fairly good data from a study specifically about climbing the Tetons, but nothing overall.”
First off, climbing is dangerous. Most climbers are not in denial. But I question the value of the data you are looking at and its application to today’s climbers.
So how do you calculate risk for the Tetons? I have seen every study. Most using old data. All clueless as to the number of climbers in the Tetons today using today’s gear and training. Unlike Everest with extensive permits, it is impossible to know how many people or man hours are spent climbing in the Tetons these days. Every mountain has different routes with different times based on the speed of climbers and the length. There is no one counting all climbers. Thousands summit without camping. Thousands are out of sight of park staff.
Additionally, if you separate mountaineering over snow/ice vs climbing on dry rock and approaches, you might find very different stastics. Just like the difference between swimming in shark infested waters vs swimming in open water with very few sharks. Since more people choose dry rock, the accidents over snow may skew the danger for people climbing over dry rock. I get the idea that it is a general drastic but there is no way you can accurately calculate the risk when you know so little about today’s climbers and the average times on route.
Of course, some deaths are not happening while climbing but while hiking. Do you put those in a climbing category? You say not, but many deaths in the studies include those deaths.
Thanks for the post. Fun to read but not sure I trust your data.
Hi Bruce, sounds like you know much more about climbing the Tetons than I do and I trust that you make valid points. As I mentioned it was very hard to come by good data about mountain climbing. I have cited my sources but I obviously cannot verify that they are accurate with respect to the nominator and denominator. If there are indeed a lot more people climbing than the study says, then the denominator would be understated, and consequently the risk overstated. As a glider pilot I obviously focused more on verifying and stress-testing my sources for aviation and gliding specifically than I could do about all the other sports. I’m glad to hear that you think the quality of the Everest data is more reliable, and this definitely sounds plausible given the stricter permitting requirements. Thanks for your comment!
I am curious the tupe of accidents PG vs Sailplane.. I am surprised that an aircraft with a spar is can be in a similar category as something like a bag of full of air with strings attached. I would guess many sailplane accidents are not from turbulent/active air but rather takeoff and landing events, towing mishaps or perhaps aerobatics over stress of airframe etc.
Hi Marcus, thanks for being curious. Most sailplane accidents are due to pilot mistakes. It is very rare that equipment failure is involved. I have done a very detailed analysis of the root causes of accidents. You can find it here is interested: https://chessintheair.com/does-soaring-have-to-be-so-dangerous/
I’m researching about hang gliding. Many thanks for this as it helps a lot. You did a very honest study and solid comparisons. It’s amazing that everywhere I looked so far (and statistics) show that skydiving is much safer than hang glider e.g. I think the absolute cause is: It shows how poor is the data in the subject, no world’s general realiable statistics exist and all we can find are poor approaches and lack of information. Cheers.
NO!!! I feel very inconfortable reading your comment.
Skydiving IS less dangerous than hang gliding, every serious study lead to this result. The opposite conclusion from this article is only due to its extremely biaised methodology. So be carefull before using that to make life choices or to influence others.
Basically in this paper the risk is measured “per minute” of activity. In this case, yes, sky-diving is more risky. But you spend much less time actually sky-diving (actual fly time) than you do soaring or hang-gliding. In terms of risk “per year” of activity of an average practitionner hang-gliding is more risky than sky diving, that’s a fact.
Hi Rodrigo, I understand that you don’t like the methodology I used and would prefer another one. Feel free to publish your own study using whatever method you think is most appropriate for your needs and interests. I don’t think there is a “right” or “wrong” methodology and I have explained why I chose the one I used. I have found from the many comments that most everyone prefers a methodology that makes their own favorite activity look less risky, just as I had expected. There is this pesky cognitive dissonance thing that we all want to avoid, and you are obviously no exception.
If you do a 2 minute base jump, your next 2 minutes will objectively be extremely dangerous. I’m not telling you not to base jump. Everyone is responsible for their own actions. However, rather than negating the risks, I would suggest that it would be wise to be fully aware of the risks and make proportional efforts to reduce them accordingly.
I would be interested in seeing the studies that show that soaring, hang gliding, and paragliding are less risky than motorcycling. Can you please provide some references to them?
Thanks for your interest in the subject! Clemens
The problem with “risk per year” is that it assumes that every practitioner participates roughly the same amount in a particular activity. This is obviously not true. Someone does only one skydive in a year, someone else does hundreds. The one who does hundreds has obviously a much higher risk. The same goes for any other activity. Take my case, soaring. I am not so interested in my annual risk based on the “average soaring pilot” who might only fly 5-15 hours per year when I fly 200-300 hours per year. I am interested in the risk per hour. One can argue that the risk per hour is getting incrementally smaller the more hours I fly because I have more currency and experience, but that is a different subject and even more complicated. E.g., frequent participants are usually also prone to “risk compensation”, ie they increasingly take more risk the more experienced they get. That is definitely true for soaring and I am fairly confident that it is also true for skydiving and most other risky activities.
I am glad you are thinking about the subject. Acknowledging the fact that one participates in a high risk sport is a prerequisite for taking appropriate actions to mitigate the risks.
Have fun and jump safely! Cheers, Clemens
Thanks for your answer. I get your point about different kind of practitionners but we can reasonably assume the average involvement of all practitionners is similar in different activities. You will always have some casual hobbyists, a top of distribution with a lot of people spending a significant part of their free time on it, and a long tail of die hard fanatics.
If you compare fatalities “per year”, in practice you compare their dangerosity for the average practitionner in each activity which, in my opinion, makes sense, because these average practitionners probably have, to some extent, similar profile and involvement.
Of course that does not work for Everst summiting…
If you compare skydiving and glider piloting, at equal personnal involvement I guess you will have similar number of jump/launch in both activity (roughly speaking). But not at all the same time in the air. So in this case maybe the right metrics could be the number of jump/launch, which would lead to skydiving being much less dangerous than glider piloting or hang gliding.
BTW, I might have appeared a little rough in my answer, sorry about that, because of this comment of this guy being happy to see some “proof” that hang gliding is not so dangerous, whereas in my opinion it is. So I just wanted him to reconsider his view in order to avoid misinformed choices.
Very enlightening comparison. I avoid downhill mountain biking because I anecdotally know it’s risky, but didn’t think it was THAT risky (or that alpine, even backcountry, skiing was that safe). You addressed the brevity of skydiving and base jumping. Let’s say the average skydive from exit to landing is 5 minutes. That means it’d take about 12,500 jumps to reach 1000 hours of that activity. The average USPA member jumps 91 times per year, so that’d be 137 years of average participation in the sport per fatality. For base jumping, it’s difficult to come up with an average time, comparing hop & pops to wingsuit flights, but let’s call it 2 minutes, which would be a death for every 720 jumps. No way to tell average jumps per year, but it has to be less than skydivers.
It seems you are aware that your comparison makes no sense at all because you explain yourself why. You make the right argument but that does not prevent you from discarding it and publishing wrong conclusions. This is puzzling.
The dangerosity of one base jump should be compared to the dangerosity of one commercial flight. Whether one last 10 hours and the other 2 minutes is compeltely irrelevant.
If you were considering the risk for an average practitionner, instead of the risk “per minute” of the activity, you would get largely different output. Confirmed by other studies, skydiving and, to a lesser extent, soaring, hang-gliding or paragliding, are way less dangerous that motorcycling.
Nice research piece ut should be pulished in general
But in the same time you focus point negating the pilot’s world famous quote ” a competitor piloto flying c class glider who is flying less than 50 hours per year is at risk he must down grade his glider to class B or so.” More importantly this argument is equally supported by paraglider menufactrur and EN safety authority. What is right thing to do? And you comparing risk on participants
there must be some otherway to assess risk. As comercial air traveling become more safe after accidents and experiences. Stoping is not the solution but R&D.
Hi Engr, thanks for the comment! In this article I focus on the (statistical) risks of all these activities, not on prevention strategies. I know too little about most activities to propose specific risk mitigation measures. I have specifically covered this topic for flying sailplanes in my article “Does Soaring Have to Be So Dangerous?” You can easily find it. But it focuses on sailplane pilots, not paragliders. I have heard that high performance paragliders are more difficult to fly and less suited for less active pilots. The same does not necessarily hold for sailplanes. The second generation of high performance sailplanes (e.g. Discus 2, Ventus 2, ASG 29) are actually among the easiest and safest to fly gliders. (The latest generation is somewhat reversing this trend, however. A JS3 is probably not the most suitable glider unless someone flies very regularly.) As I said all this does not apply to paragliders. Re: your comparison with commercial aviation: I think the learnings from commercial aviation are somewhat limited. Commercial aviation has become so safe because every aspect of it is regulated and controlled and someone is always looking over your shoulders. Pilots have very limited freedom to make their own decisions and safety is everything. I think a similar level of control and supervision is neither practical nor desirable for sporting and recreational flying activities. Therefore, it is incumbent on the pilot to take full responsibility for their own safety and to fly accordingly. For sailplanes the passive safety of gliders is already extremely high and it is very rare that a glider accident happens due to malfunctioning equipment.
Hi Clemens,
Thank you for putting this post together. I found some better sources of data for mountain biking. The injury rates for non-competitive recreational bikers are probably more relevant to the general public
https://lermagazine.com/cover_story/how-mountain-biking-is-reshaping-the-landscape-of-cycling-injury
A study by Gaulrapp et al3 of more than 3800 mountain bikers, most of whom were noncompetitive recreational bikers, cited a very low rate of significant injury: 1 injury for every 1000 hours of riding, with 75% of injuries considered minor. In contrast, Kronisch et al4 looked at competitive mountain bikers and cited an injury rate of 3.7 injuries for every 1000 hours of racing in cross-country biking and 43.4 injuries for every 1000 hours in downhill racing.
(The stats on cross country vs downhill support the gut-check that racing downhill is 10x more dangerous than racing cross country)
Thanks for this. In 2008 I broke my back paragliding (Golden, British Columbia). My instructor later said it was a freak accident, but also mentioned that he had broken his back a decade earlier. I’ve wondered about the risk level since as I had no way to assess the level of risk other than antidotes. Today (Oct 23, 2022) I came across an article about another death in BC and wondered if I notice these stories because of my own experience or because it’s more common than I want to think about.
Hi Graham, paragliding is definitely a dangerous sport and back injuries are very common. And about every 35,000 gliding hours, a pilot dies (on average). I’m not paraglider pilot myself but I listen regularly to the “Cloudbase Mayhem” podcast from Gavin McGlurg. I highly recommend it. In addition to being fun and very educational even for me as a sailplane pilot it will give you a very good sense about the dangers involved.
Hello, this post was linked in a YouTube video I watched on the Pure Glide channel. I’m not a glider enthusiast but I just wanted to compliment you on all the work and careful analysis. This is a really great post and especially interesting chart.
Hello! Great article, I’m not pointing out any flaws, just trying to add up to the conversation:
Another factor that is highly important, is the activities people engage in within these sports.
For example: regular skydiving. There are some statistics out there making the argument that most skydiving fatalities occur when skydivers engage in complex manoeuvres (low openings with risky and quick descents for example)
The number of fatalities in skydiving reduces dramatically when we only look at, tandem skydivers for example, or people who do a more than average jump out of a plane and open at the appropriate altitude without attempting crazy shenanigans.
Motorcycling comes to mind too, and I wonder how many of those fatalities registered are sporty speed bikes zooming at 150 kmph vs how many happened to chill “slow riding” people in their cruiser Harleys that can barely keep up with the speed of a car.
How much of commercial aviation’s safety is due to the fact that they limit their flights to only going from point A to point B in the most efficient way at the highest altitudes?
If there was such thing as “Airbus racing” or “Boeing Aerobatic” competitions, I’d bet commercial aviation would be at the bottom of the safety list.
Thoughts on this? maybe picking the activities you do within your sports fall under your category of “risk mitigation actions” you mention.
Or maybe I’m another example of cognitive dissonance? xD
Hi Gabriel, you probably have a point. I wasn’t able to differentiate within all the different activities between deliberately risky vs conservative behavior and the implications on stats. It’s hard enough to find good data as it is. I can say that for glider flying where I am intimately familiar with the types of accidents, that the accidents are not primarily driven by particularly risky activities. Rather, most accidents happen in fairly standard situations and there is no evidence that the accident pilots were seeking to engage in particularly risky activities. E.g. the most common root cause of accidents is a pilot’s delayed landing decision. Not because they are thrill seekers but just because they continue to look for lift, don’t find any, and then they find themselves too low to fly a safe regular landing pattern. If you’re interested you can more info about this here: https://chessintheair.com/does-soaring-have-to-be-so-dangerous/. I suspect that in motorcycle accidents we may find a similar pattern but I don’t have the data to prove or disprove it. Likewise, I don’t know enough about skydiving to provide more insight.
Good points. I study paddlesports accidents. I’ve found that a helpful way of looking at close calls and fatalities is to try and discern “margin for error”. If someone makes a mistake or something goes wrong, is it simply inconvenient or likely to be fatal. It’s a calculus that can be applied with good effect to most “adventure sports”. For example, in open-water (non-whitewater) kayaking, a capsize while paddling on 40F water without a properly-fitted lifejacket and the protection of a wetsuit or drysuit is almost always fatal. In other words, it’s exceptionally unusual for a paddler to survive a capsize under those circumstances.
Thank you for all the effort you put into this fascinating article and to draw comparisons between different activities. I agree with you that these are very difficult comparisons to make. The lack of data and the variables involve in each particular activity further complicate matters. Riding a motorcycle at night in rain on a curvy mountain road while intoxicated is obviously far more dangerous than riding the same road in daylight while sober – however, the fatality statistics seldom allow us to parse such information. I study paddling fatalities and the range of variables is huge, the statistics fuzzy or non-existent. Still, I believe there is a lot of value in making rough comparisons and for working to assess the relative risk that our sports present in as clear-eyed a manner as possible. You did a good job of citing cognitive dissonance; it’s a very common heuristic trap – one of many. We humans are not very rational creatures, but we appear to have an innate ability to rationalize, justify, and dismiss evidence that we should pay attention to. Moulton Avery, Founder and Director, National Center for Cold Water Safety.
I enjoy foot racing. When I run fast, I sometimes think about dying. I think it is an expression of fear that stems from anoxia.
I prefer to reduce the risks of the activities I engage in without ceasing the activities entirely. Often I would point out the dangers of some activity and ways to reduce the risks. Many times people would say, don’t worry about that, it won’t happen. As a firefighter rare were the days when when people weren’t getting hurt or killed. Nobody ever plans on seeing firefighters and paramedics. “It won’t happen”
Thank you for your article. I appreciate risk management.
Hi Clemens, thanks a bunch for this superbe analysis! As a social science student I love your approach and as a passionate whitewater kayaker, I am missing my sport in your list. If you are interested, there is a super-well done statistic in the US with a lot of filters to apply. So you can choose the difficulty and the boat type to sort out all not-educated boaters: https://www.americanwhitewater.org/content/Accident/view/
In any case, thank you so much for your well done article so far!
Cheers, Martin.
How many jumps you have to do to acumulate 1000 hours of flying?
I have been sitting on this information for about 10 months and there are a couple of things that I can’t quite scratch away.
I am going to attempt to explain here:
It seems like this article is heavily constructed from an aviation worldview and a pilot’s mindset. After all, Clemens did this for a personal motive of finding the risks of flying his glider, and as a GA pilot, I can relate.
But this affects the outcome of the method utilized in 2 potential areas: Using Commercial Aviation as the “benchmark” of safety, and calculating the risk for all activities in terms of hours (like flight hours we pilots write in our logbooks).
1) Using aviation as the benchmark for safety:
There’s nothing wrong with this, as long as we take a second to process just how INSANELY SAFE commercial aviation is, as the introduction of this article correctly states: “One of the safest things you can do when you leave home”.
For reference, the risk of sitting under a coconut tree and dying from a coconut falling on your head is 1 in 10.5 million hours. Sitting under a coconut tree is just slightly safer than taking a commercial flight.
Since commercial aviation is virtually as safe as staying in your house, using this as a “benchmark” to determine “somewhat dangerous” “dangerous” and “very dangerous” activities is naturally going to result in some things appearing more dangerous.
Here’s an example for context:
getting your wisdom teeth removed with surgery at the dentist’s office has a chance of 1 death per 350,000 surgeries. Given an estimate of 1 hour per surgery, that is 1 death in 350,000 hours, putting wisdom tooth extraction in the “somewhat dangerous activities” category in this list. 10 to 50 times more dangerous than commercial flying.
2) Meassuring everything in “flight hours”:
What I love about this article is the attempt to calculate the dangers of CHOICE OF ACTIVITY. As the introduction says: “the risk of spending the afternoon riding a mountain bike vs flying a sailplane”.
I think this hits the mark perfectly because that’s truly what we all adventurers would like to know. “How likely am I to die if I choose to jump off a plane tomorrow vs if I choose to ride my bike”. However, I think calculating with a pilot logbook mindset of “risk per participation hour” doesn’t properly do justice to some of the activities on the list.
As someone else pointed out in the comments, there is something off about comparing “short thrills” vs longer activities, and it’s not, as the introduction says, “the base jumper wanting to count in the time he spends hiking and climbing the mountain as activity-participation-time to make base jumping look safer”.
Let’s rather use the example of regular skydiving, which is 60 seconds of freefall plus 5 to 7 minutes of floating around in your parachute. Let’s round it to 10 minutes (forget about the time getting in the plane, climbing up to altitude, prepping your chute etc. we’re just using the actual time spent actually skydiving).
This equals to 6 theoretical times a guy CHOOSES to jump off an airplane vs 1 hour of a guy choosing to fly a Cessna. Or flip it around to understand it better, it’s like equalizing 6 flight hours of a Cessna to 1 single 10-minute skydive jump. Of course, in that case, general aviation would appear severely more dangerous than skydiving.
Jumpers log in their jumps just as we pilots do, but they log in “jumps” for a reason, not “hours spent falling from the air” because then logging a single hour of skydiving would take 6+ jumps.
I hope this information helps to put some things into perspective, and I hope that I’m not falling for the “Cognitive dissonance” the article correctly explains. After all, complacency is the #1 killer in aviation, and reading articles like these help us all stay vigilant and stick to safety protocols.
I only write this not to criticise or underplay the AMAZING work put in by Clemens, but rather to put some perspective so that someone reading this doesn’t get discouraged from following their dream of becoming a pilot or a skydive jumper =)
Many thanks for this very thoughtful comment! I really like your added perspective. Thank you for taking the time!
Maybe someone can enlighten me on this, but what interests me are sub-divisions of risk within a sport. For example, surfing can mean riding 1 metre waves at a gentle sandy beach, 4 metre barrels over a shallow reef, or monster waves at Nazaré. All “surfing”, but different sports to be honest, and most people doing the former would never consider the latter two. Similarly, “motorcycling” includes little old ladies commuting by moped on quiet country lanes as much as it does 21 year olds on superbikes going mad an twisty A roads. Again, with not much commonality.
So my question about gliding, as a non-pilot interested in the sport, is what’s this division like in gliding?
Clemens, thanks again for an excellent, and much needed piece of research.
I wonder how the risk of paramotoring or ultralight flying compares with unmotored paragliding and handgliding. I always assumed paramotoring was safer as you’re not as dependent on thermal lift and sink. But I realise the greater weight introduces a different risk.
Did you see any stats on this? Does anyone have an opinion on this?
Dear Clemens,
I appreciate your article deeply. and I’ve contributed to the comments several times already. I must admit, however, that it keeps me up at night!
I love flying. I got my private pilot’s license (General Aviation) in 2016 and continued flying until 2022-ish when I let my license expire in order to pursue other life goals.
I sadly cannot afford to be a general aviation pilot anymore (at least at this point in my life). Since then, I’ve tried to “fill the hole” in my heart with other adventure activities such as sailing, but so far I feel like it doesn’t quite make me feel whole. I feel like I belong in the sky.
This year I’ve been looking into paragliding. (the most affordable of all aerial sports I’ve heard). I’ve always loved parachute-shaped crafts and the fact that the activity still qualifies as “aviation” and allows you to call yourself a “pilot” is quite exciting and wholesome to me.
That being said, every time I look at this article I feel like staying home and installing padding on the walls. (ok, the padding was an exaggeration, but you get the idea) I want to feel like I’m doing something that makes me feel worthy of calling myself an aviator again, but I don’t want to trade my life for it!
I apologize if the request seems childish, but do you have any words of encouragement to go along with your article?
Perhaps expanding on what you wrote in one of the comments:
“The majority of flying accidents are avoidable and if you continue to be diligent and work on your skills you can make your personal odds much better than the average.”
I’ve always considered myself a safety-first guy (perhaps for my background as a pilot) and I’d like to think I’d be a safe PG pilot, knowing me I’m the type that chooses to fly a straight path on a sunny day and land, rather than engaging in aerobatics and crazy proximity flying tricks, etc. The thrill of being up in the air is thrill enough for me.
Hi Gabe, thanks so much for your kind words and your continued interest. My intent is not to discourage anyone, after all, I don’t want to discourage myself either. If I didn’t think that I can manage the risks to an acceptable level, I could not justify to keep flying either.
I have not flown paragliders but I know many who do. I am also an enthusiatic follower to the Cloudbase Mayhem podcast from Gavin McClurg. I highly recommend it if you’re not already familiar with it.
My impression is that the risks in paragliding are just as manageable as in gliding or power flying. But each of these have risks that are unique to the activity and must be well understood to be managed. One of these unique aspects with paragliding is the collapsible nature of the wing which essentially makes strong winds a formidable foe. You also can’t fly fast so staying away from storm cells is even more important than in gliding. On the other hand, you can land paragliders almost anywhere whereas that is a major complication for gliders if we fly over inhospitable terrain (e.g. in the Rocky Mountains).
Don’t let yourself be stopped if you are drawn to it. Paragliding sounds wonderful and I am amazed what can be achieved in a paraglider. Good luck!
Hey Clemens, thank you so much for your encouraging reply and for the pointers!
I suppose it is easy to get carried away and forget that the author of the article is an active glider pilot who loves his sport, after all 🙂
I will try Base jump, nessesery