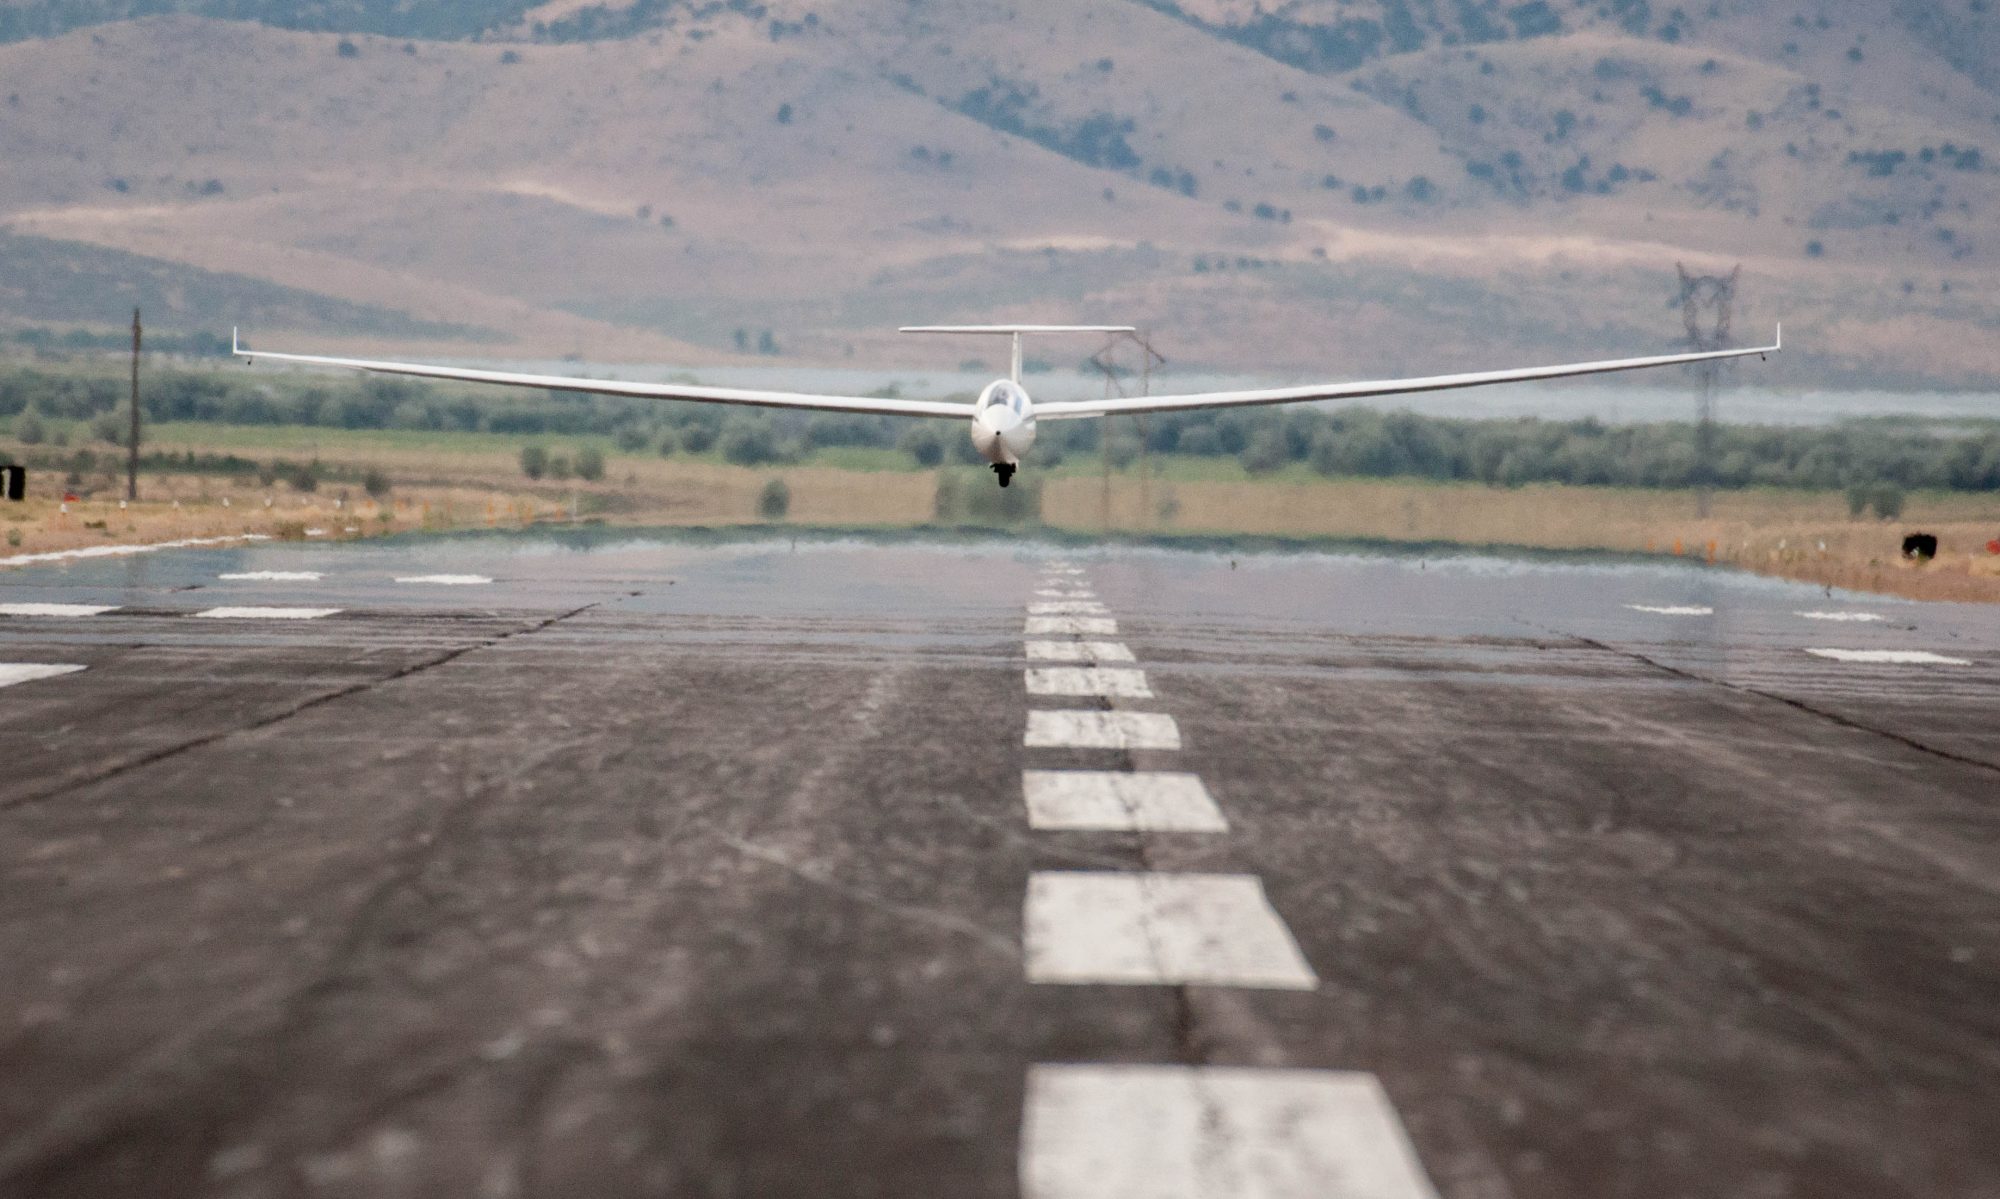

Ten days ago, on Aug 1, 2026, Zach (YA – Nimbus 4) and I (CC – Ventus 3M) flew the first declared 1000+km “Quadrilateral” task in Colorado. YA finished the task 26 minutes sooner. His task speed was a very impressive 152.3 kph. I was 6.3% slower at 142.8 kph. What will I need to do differently to keep up with him? Is it even possible?
The two flights can be found here: Zach (YA), Clemens (CC)
Apples and Oranges?
When you look at the two gliders, the apples and oranges comparison seems apt. No one could possibly mistake one for the other. Zach’s Nimbus 4 was designed in the 1980s (it first flew in 1990). It has a 26.5 meter wing-span and a wing area of 17.8 square meters. My Ventus 3M (a 2016 design) is outright tiny in comparison: its 18 m wing span is 1/3 shorter and its 10.84 square meter wing area is 40% smaller.
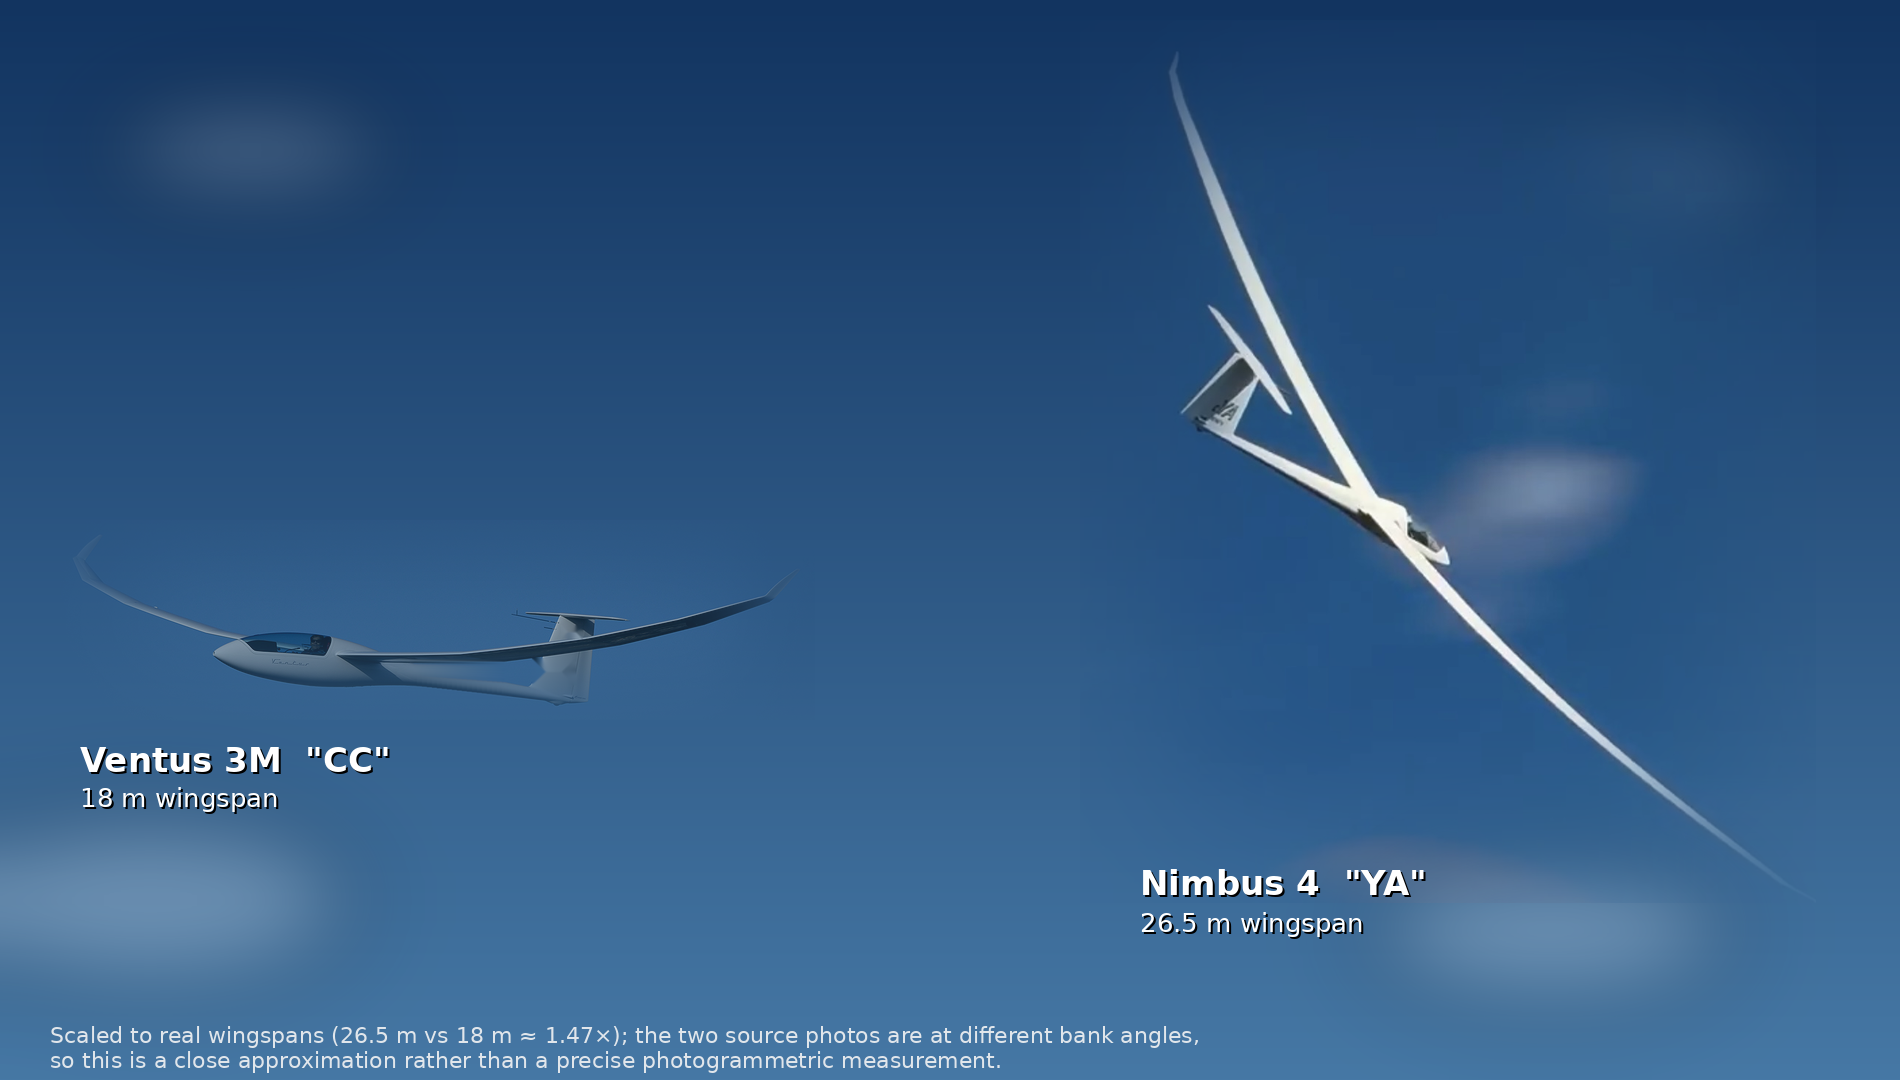
The Nimbus 4 excels in weak conditions. It has an impressive best glide ratio of 60:1 compared to about 50:1 for the Ventus 3M and its minimum sink rate is just 0.38 m/s (!). The equivalent number for the Ventus 3M is 0.58 m/s – more that 50% worse – it almost falls out of the sky by comparison. When thermals are weak and you have to milk the final glide, there is no keeping up with a Nimbus. It will win any time.
Luckily for us, Colorado conditions aren’t exactly weak. Average climb rates in thermals tend to be around 2.5 to 3 m/s (500-600 fpm). On strong days we often see more than 5 m/s (1000 fpm) – especially during mid afternoon hours. When conditions are so strong, the minimum sink rate and the best L/D are no longer the critical factors. What matters much more is glide performance at high speeds.
Since the wing profile of both gliders was designed for optimal performance in top-level glider competitions (thin slippery wings optimized for a high L/D over a wide speed range) we can assume that both wings are similarly efficient (admittedly a broad assumption to avoid having to make wing design the subject of this article).
As long as that assumption broadly holds, the most important factor by far determining high speed performance is wing loading (the total mass of the glider divided by the wing area). It may seem counterintuitive but heavier gliders with smaller wings (i.e. gliders with high wing loading) have a much better glide ratio at high speeds than light gliders with bigger wings (i.e. gliders with low wing loading).
Once you focus on wing loading and the fact that is can be adjusted by adding water ballast, the two very different gliders don’t look so different anymore. In fact, on the day of our flight, Zach added hundreds of liters of water to make his Nimbus 4 as heavy as allowed: 850 kg, a wing loading of 51.2 kg/sqm (10.5 lbs/sqft). I only added a little water to my Ventus 3 and flew at a wing loading of 49.3 kg/sqm (10.1 lbs/sqft). Apples and oranges no more. (If I had added a little more water to equalize the wing loading completely, they’d probably be more akin to Honeycrisp and Granny Smith.)
Anyway, for the rest of the analysis I will simply assume that the difference in glider performance on a strong day is negligible. In other words: my Ventus 3 didn’t lose against Zach’s Nimbus 4; instead, I lost against Zach. So why and how did I end up 9.5 kph (6.3%) slower?
Both Are (Pretty Good) Apples. So What Could It Be?
It’s worth to recap: for two equally performing gliders, there are only four factors that ultimately determine the average speed around the same task flown on the same day and at the same time (i.e. in overall identical weather conditions). These are:
(1) Achieved cruise performance, largely driven by the pilot’s ability to fly in “good air.” The most frequently used metric for this is L/D. However, L/D is heavily influenced by cruise speed. The better metric to look at is “Netto” – the vertical movement of the airmass the glider passes through during cruise flight. Since “Netto” just measures what the air is doing it is not distorted by the the pilot’s choice of flying speed. And yes, flying reasonably close to the optimum cruise speed (based on McCready theory) plays a role too, but for many practical reasons modest deviations from McCready theory have only a minor effect. (It only pays to investigate McCready as a potentially significant factor if you notice a major difference in flying style – e.g. a pilot who flies consistently and substantially faster or slower than other pilots with a similar glider and similar wing loading).
(2) Achieved climb rates when thermalling. This is self evident: climbing slowly takes more time than climbing fast. Important: the effect on performance is MUCH more pronounced in weak conditions. (e.g. climbing at 100 fpm vs climbing at 200 fpm is far worse than climbing at 300 fpm vs climbing at 600 fpm. This is counterintuitive but do the math: when you must gain 3000 feet, the difference between climbing at 100 fpm and 200 fpm is a whopping 15 minutes: 30 instead of 15. The difference between climbing at 300 fpm and 600 fpm is only 5 minutes: 10 instead of 5.)
(3) Course length flown (often measured as deviation percentage). This, too is self evident. If you’re going off course for no reason you’ll fly farther, take more time, and lose more altitude that you have to regain.
(4) Average altitude flown. This is often overlooked: gliders that fly in higher (thinner) air have an advantage because the difference between TAS and IAS gets greater the higher you fly. In pure thermal conditions this effect tends to be minor because most pilots fly at similar altitudes. But it can be quite significant if the choice is between flying low along the ridges, or high up in wave.
A lot of tactical decisions contribute to these four figures but all factors can be fully captured with these four numbers. For most flights, the first two – cruise performance and climb performance – are by far the most important.
Why Did Zach Better?
Well, I ran the numbers and the numerical analysis had a surprisingly simple answer:
Zach and I flew at almost the exact same speed (each of us averaged 212 kph ground speed and 168 kph indicated airspeed). The difference in course deviations was very minor and actually slightly in my favor (11.7% vs 11.3%). With air speed and deviations being almost the same it follows that we also spent almost exactly the same time in cruise flight: Zach 5:18 hours, and I 5:17 hours. Yet, as we already know, it took me overall 26 minutes longer to get around the course.
All that extra time was spent circling. Here are the numbers:
Zach’s flight: 6:36:18 total − 5:18:21 straight = 1:17:57 circling
Clemens’ flight: 7:02:45 total − 5:17:15 straight = 1:45:30 circling
That’s 27.5 more minutes circling — almost exactly matching the ~26.5-minute gap in total duration.
So does this mean that Zach climbed better? Only by a bit. Zach’s average climb rate was 5.6 kts, while mine was 5.2 kts. That difference in climb rate accounted for 5.8 minutes of the 26.5 minute total delta. That’s significant but over a 7 hour flight not decisive.
So why then did I have to spend so much more time in the climbs? The answer is that Zach simply flew better lines, finding better air to fly in and staying in it for longer. You can see this numerically in the netto value. Zach’s average netto value in cruise flight around the whole task was 2.8 kts, while mine was only 1.2 kts. Flying in substantially better air meant that Zach lost about 15,000 feet less altitude during the cruise segments of the flight than I did. I then had to make up the extra lost altitude by spending more time circling (i.e. not moving forward on course) while Zach could use that time to make progress around the task.
This difference is also reflected in the total altitude gained in thermals: Zach climbed 50,610 ft in total, whereas I had to climb 64,990 ft (28% more) to make up for my poorer cruise performance. Climbing this extra altitude of 14,380 ft at my 5.2 kt climb rate took me 21.8 minutes – 83% of the total difference of 26.5 minutes.
So the performance difference overall is simply explained by these two factors:
1 – Poorer cruise performance (netto of 1.2 vs. 2.8 kts), which cost me 21.8 minutes in extra climbing time.
2 – Poorer climb performance(climb rate of 5.2 kts vs. 5.6 kts), which cost me 5.8 minutes.
What about the other two possible factors mentioned above (course deviations and flight altitude)? The differences here were so small to be negligible overall. My course deviations were actually slightly less (4.3 km) and this worked out 1.2 minutes in my favor. The average flight altitude was almost the same (15,664 ft for Zach vs 15,339 ft for myself) which explains about 0.5% of the speed difference and works out to be about 1.6 minutes in Zach’s favor. These two factors also netted each other out so that the combined effect was only about 0.4 minutes in Zach’s favor.
But Why and How Was Zach Able to Cruise and Climb Better?
The simple answer is that he might just be the better pilot. However, that’s not very satisfying. There’s more to learn by analyzing the performance for each of the flight’s four legs and by reflecting on key decisions that led to these outcomes.
The 26.5-minute gap is not evenly spread across the flight at all.
Time lost/gained per leg (CC vs YA):
| Leg | Total gap | Circling gap | Straight gap |
|---|---|---|---|
| 1: Niwot–WolfCkPs | +15.4 min | +15.6 min | ~0 |
| 2: WolfCkPs–HayStkMt | −5.7 min (CC gained) | +1.1 min | −6.9 min |
| 3: HayStkMt–ElkMt | +13.2 min | +6.8 min | +6.4 min |
| 4: ElkMt–Niwot | +3.6 min | +4.0 min | ~0 |
| Total | +26.4 min | +27.5 min | −1.1 min |
Each of the four legs has a different story:
Leg 1 (Niwot–WolfCkPs): the entire difference was due to me flying in a poorer airmass and having to spend more time climbing. Straight-line time was a wash, but circling cost me the full 15.6 minutes. My Netto was less than half of YA’s (1.1 vs 2.6kts), and my climb rate was also slower (4.4 vs 5.1kts) — the same Netto-driven pattern as the whole-flight analysis.
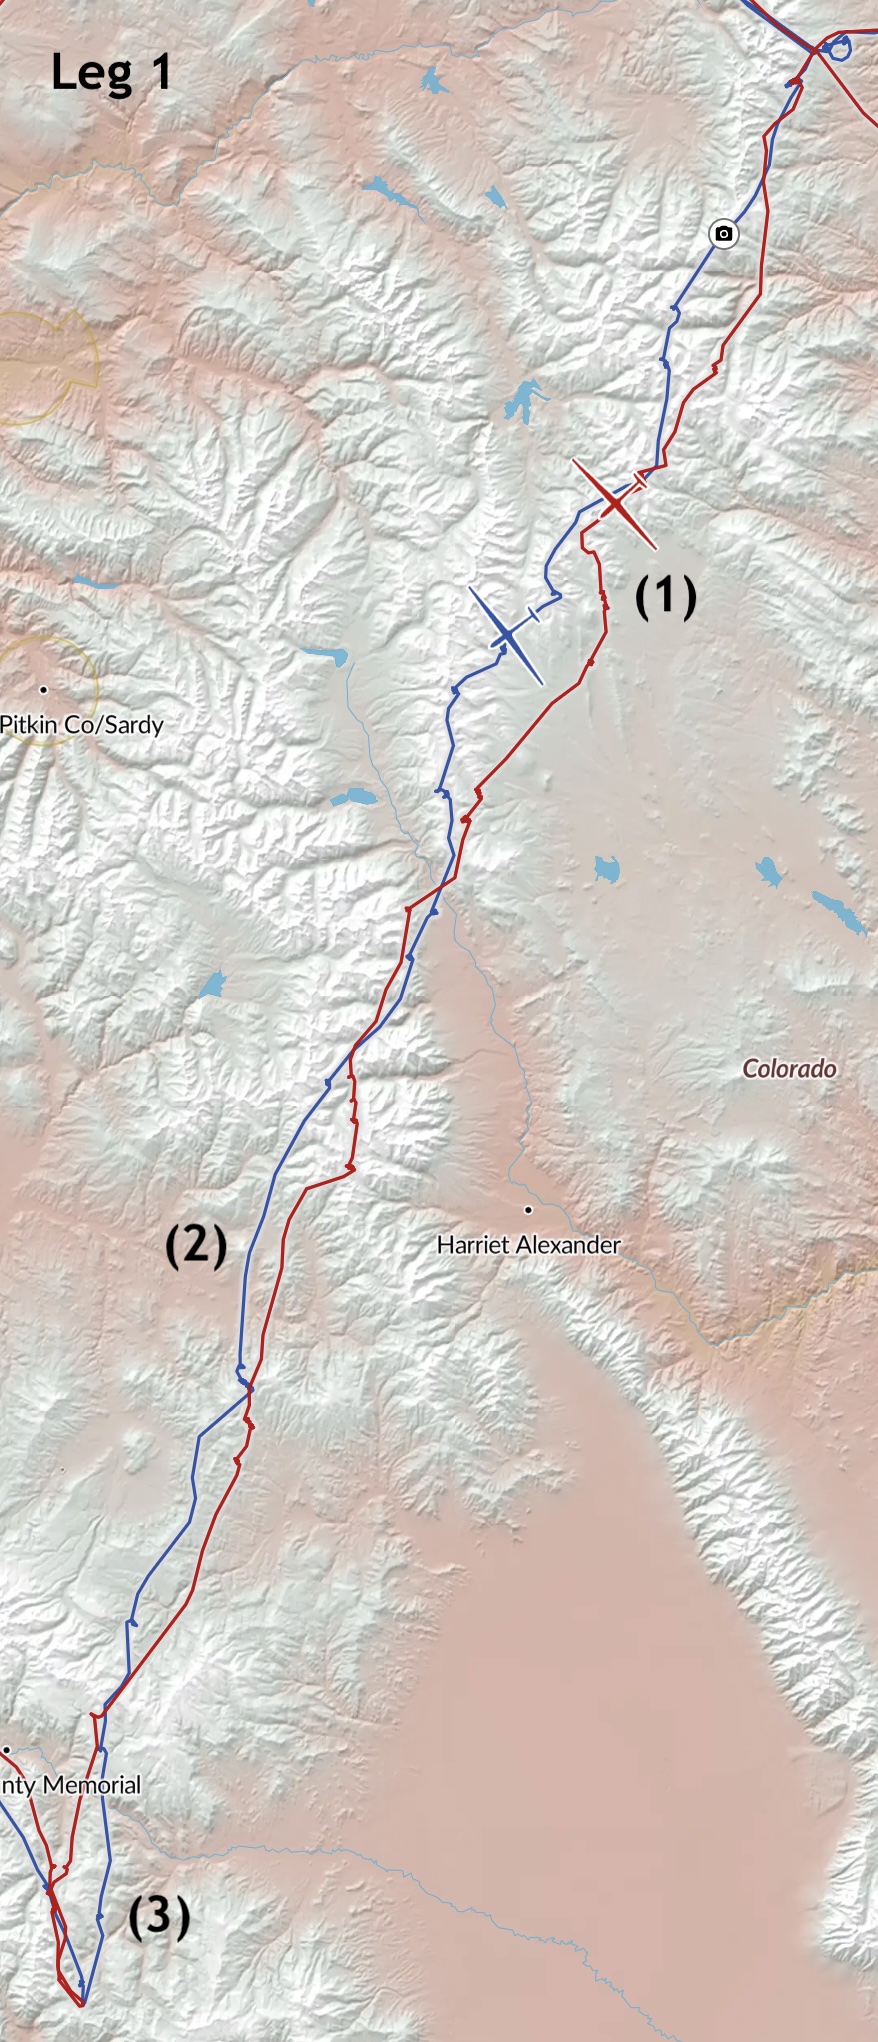
From the flight trace itself (see insert graphic above) there are some good indicators of where I made mistakes: (1) I vividly recall that I entered South Park a little low. Based on the looks of the clouds, the energy line seemed to follow the spine of the Continental Divide. Unfortunately, I did not find a climb where I expected one and had to deviate to the south, away from the line of best energy. This certainly had a steep cost in Netto before I was able to connect with the better line. Plus, because I was low, I was also forced to take the next climb I found which was substantially below average. (2) Zach found a much better line crossing the Gunnison Valley. I flew further east and had a much greater rate of descent. (3) On approach to the turn point I got uncomfortably low and once again had to take a relatively weak climb before I felt comfortable progressing under the overcast where the air was actually much better than I had expected.
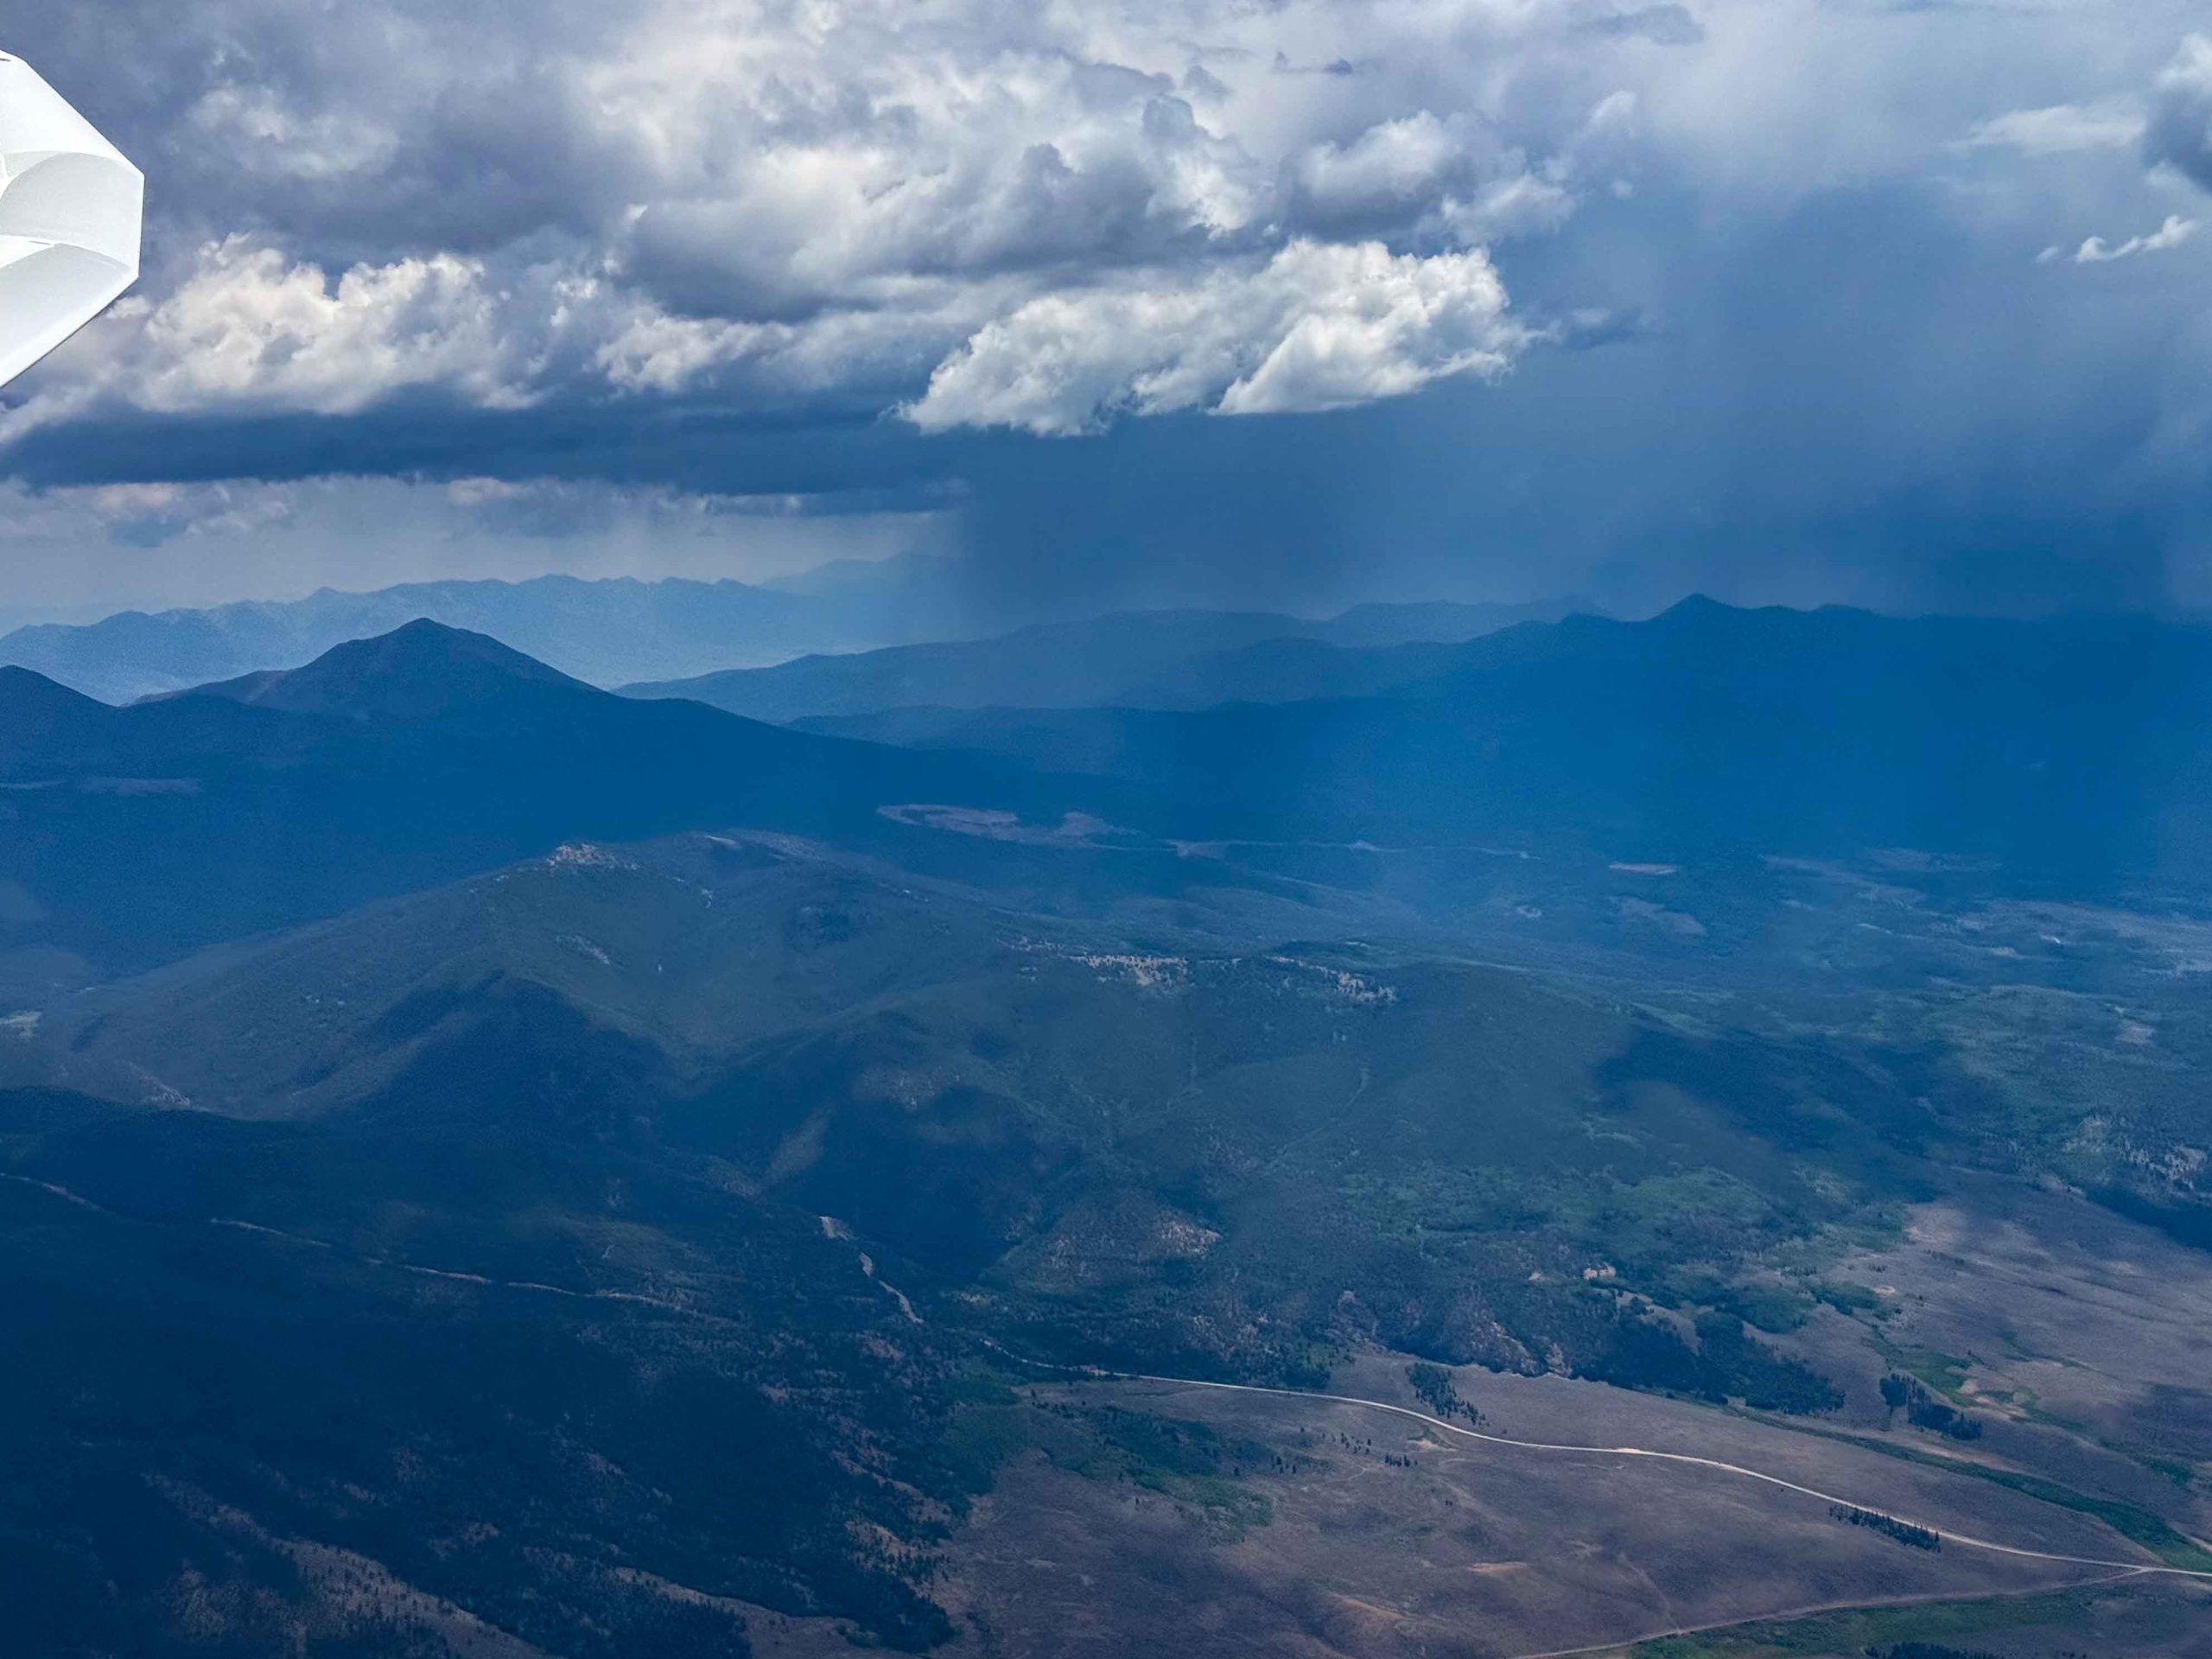
Leg 2 (WolfCkPs-HayStMt): I actually won this leg. I flew faster (GS 204 vs 194, IAS 173 vs 163) and deviated less from course (9.4% vs 13.3%) — enough to erase a much worse Netto (1.4 vs 2.7) and L/D (64 vs 99). I also chose a more aggressive speed-to-fly here and it paid off, netting me +5.7 minutes overall for the leg.
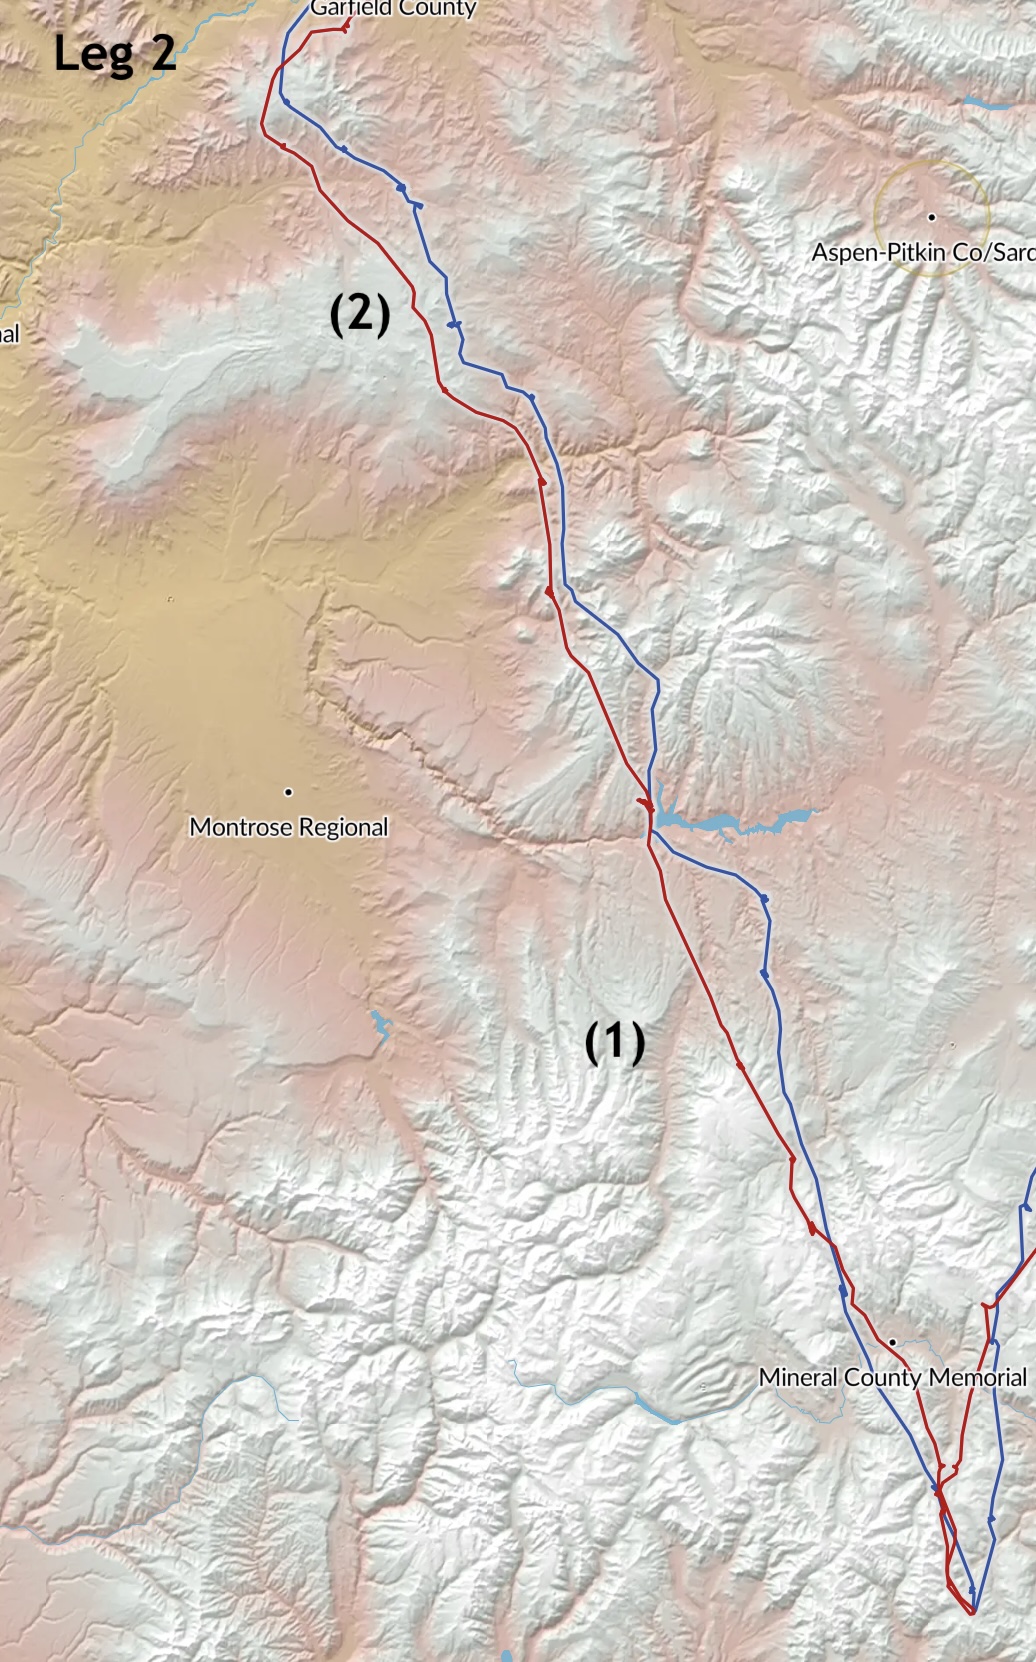
I recall that I felt good for most of that leg. The only segment where I may have lost against Zach on this leg is when (1) I flew straight towards the Black Canyon of the Gunnison while Zach had taken a longer and more easterly line earlier. With the wind out of the west, the clouds had continued to shift eastwards by the time I reached this line (about 20 minutes after Zach) and felt the deviation to the east was too great. It is impossible to tell in hindsight if I would have been faster had I followed the clouds. (2) My line across the Grand Mesa looks much better than Zach’s. I could readily identify a convergence line a few km further west than Zach’s line and I believe this is where I gained the most.
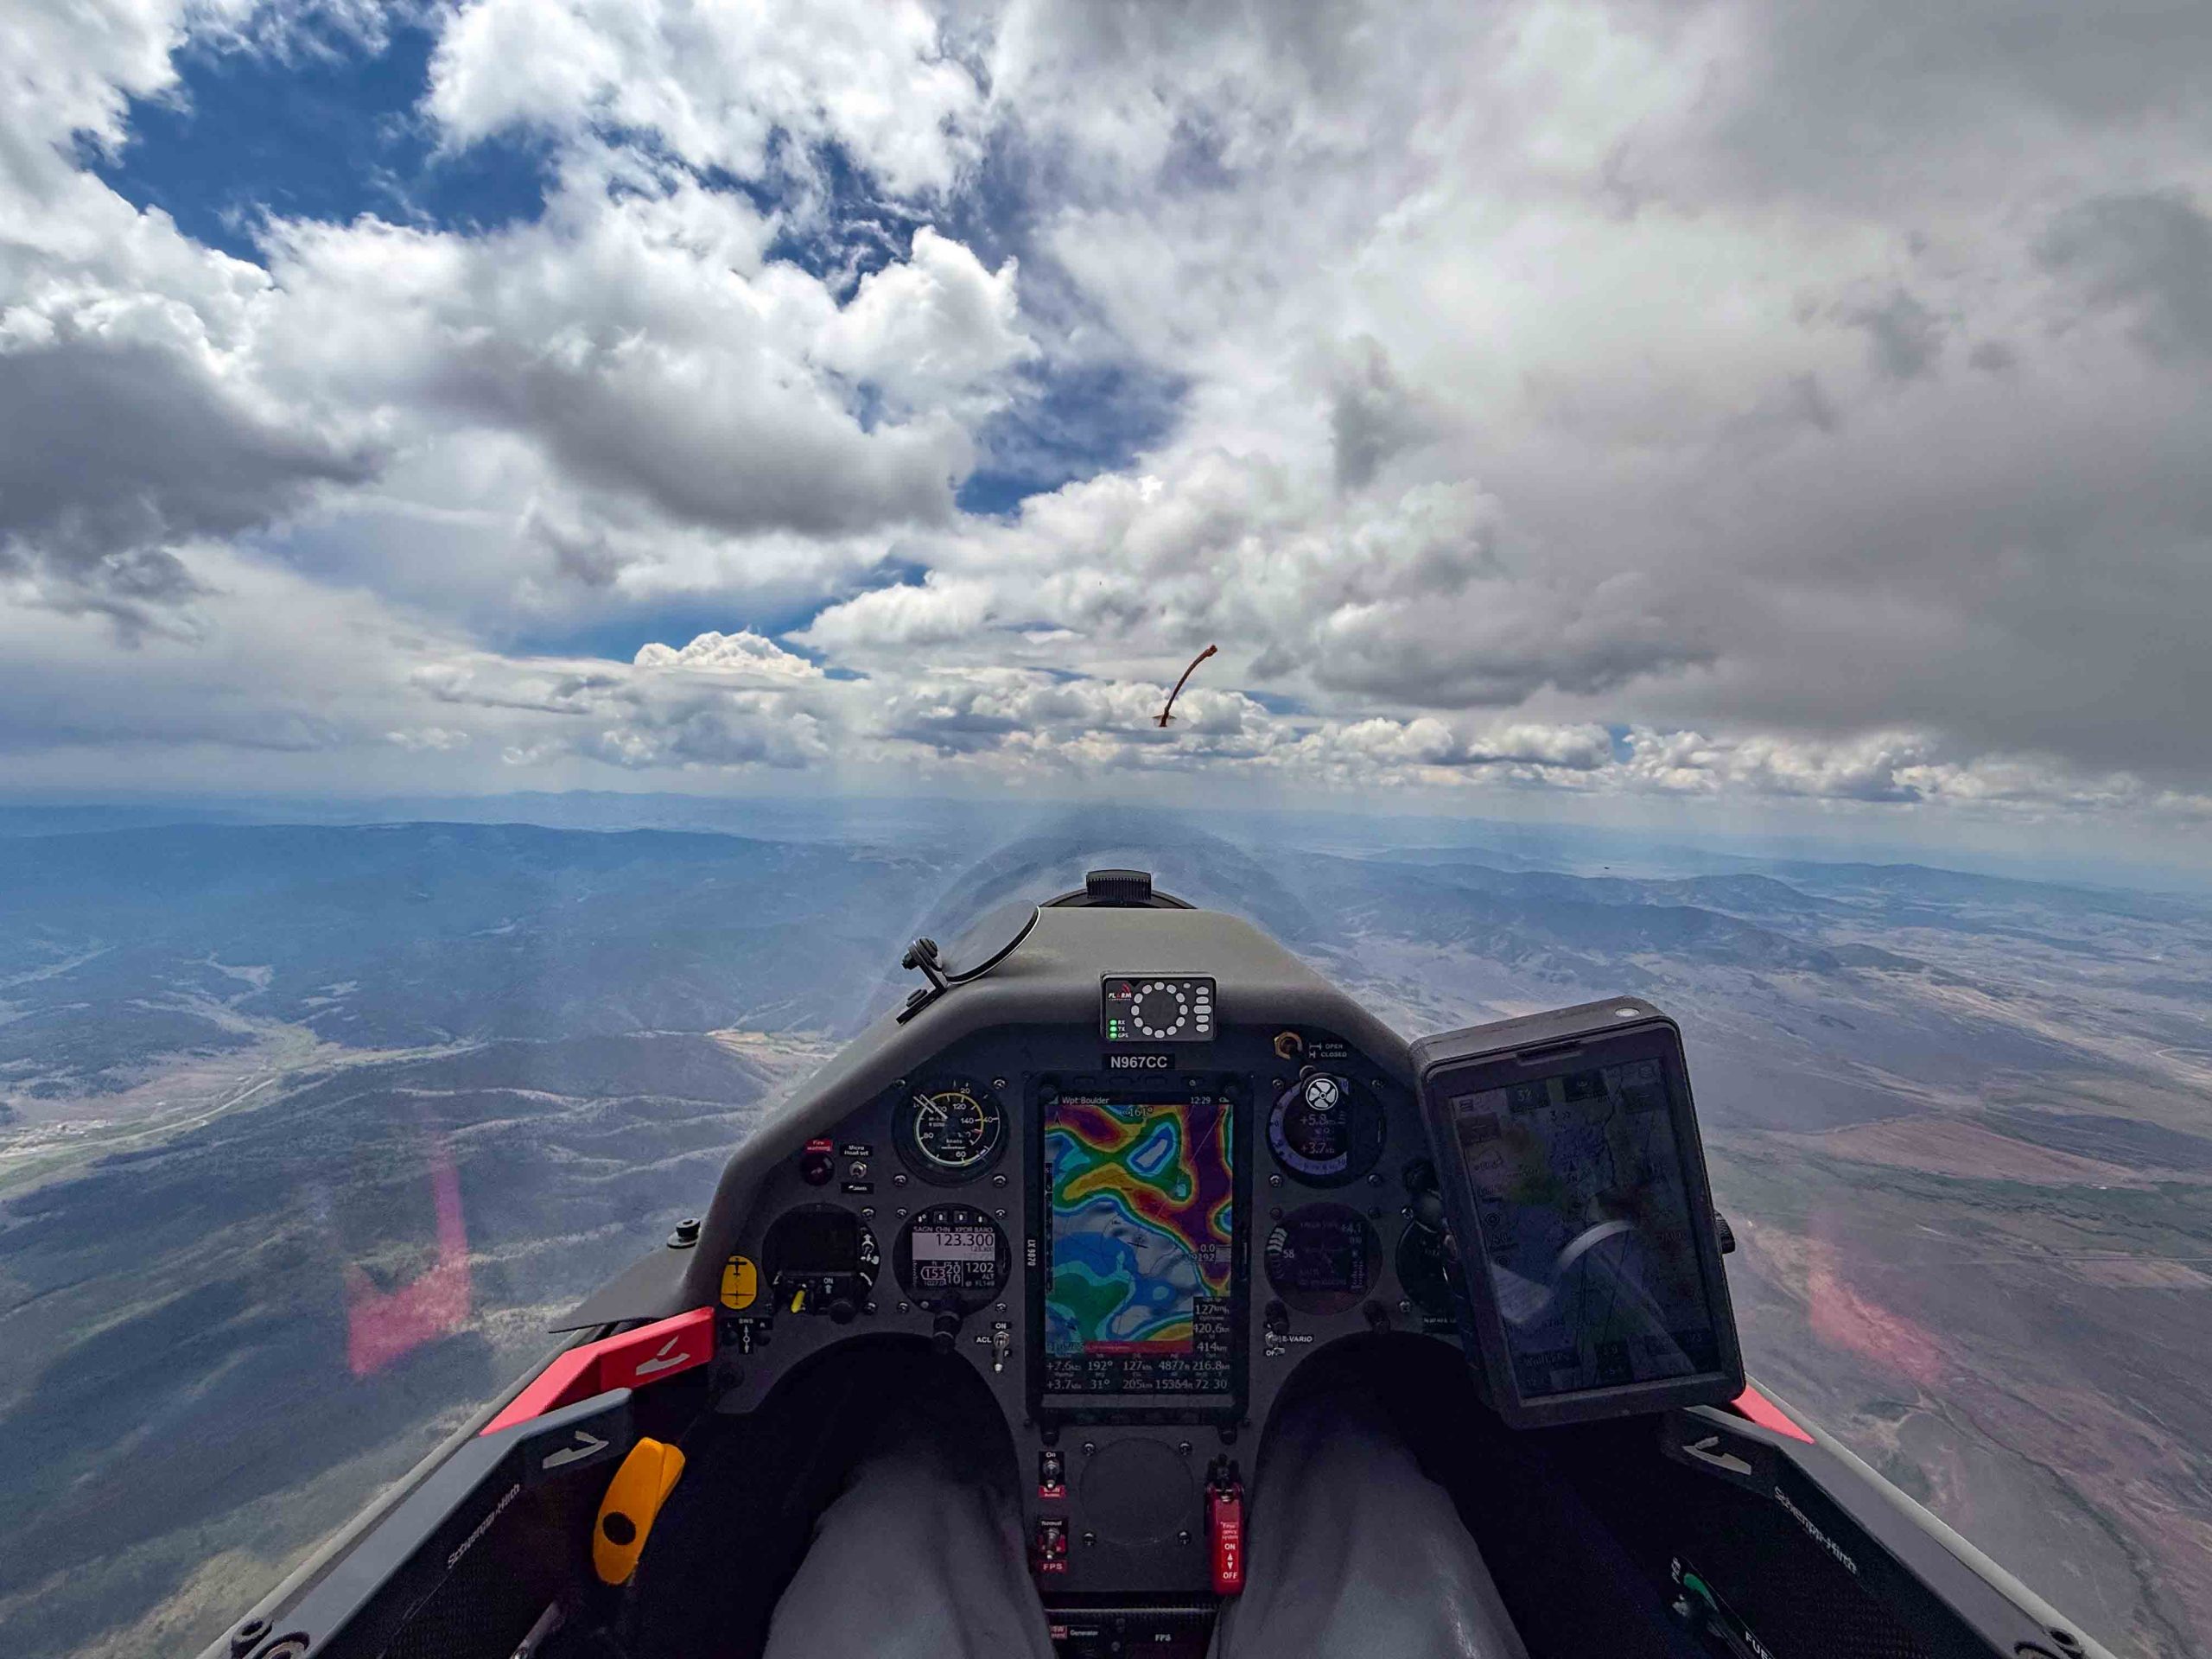
Leg 3 (HayStkMt-ElkMt): this is the one leg driven by navigation, not air. I flew 329.2km against a 276.9km task (18.9% deviation) versus Zach’s 309.1km (11.6% deviation) — I deviated over 60% more along the leg. With cruise speeds essentially matched (GS 217 vs 219, IAS 173 vs 175) and climb rates identical (6.1kts both), the extra straight-line time (+6.4 min) traces almost entirely to that extra ~20km of ground covered, not to weaker lift. The circling gap (+6.8 min) is Netto-driven again (1.0 vs 2.6kts).
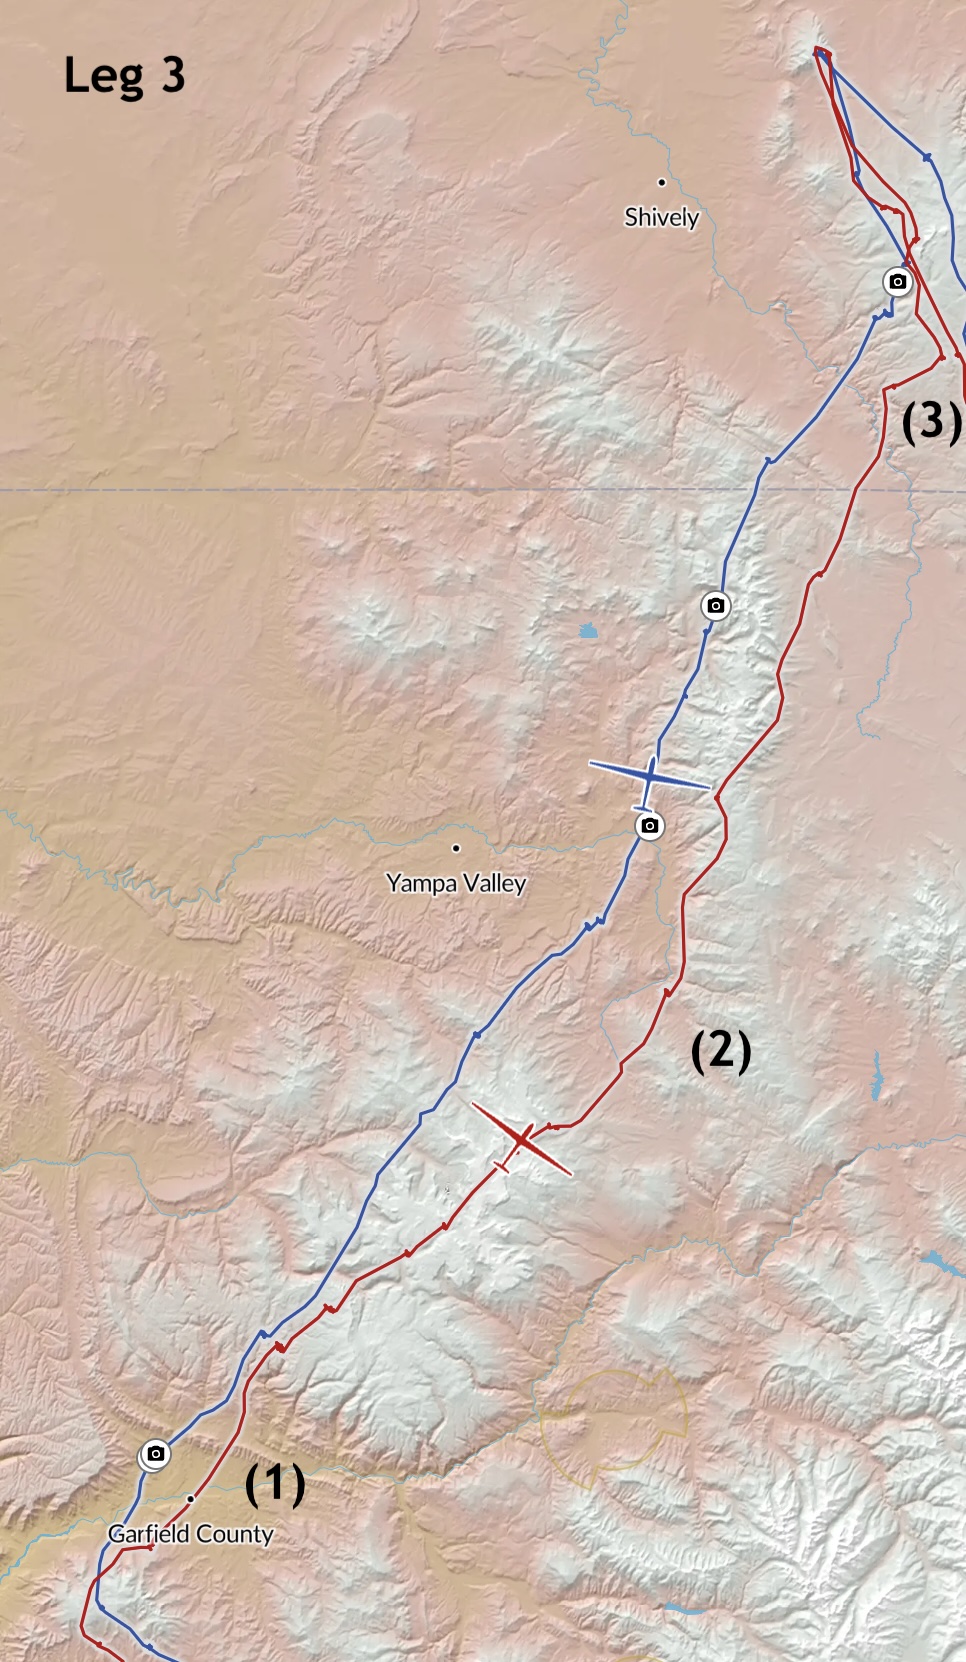
My first mistake (1) on this leg was my route choice across the Colorado river. While I found a good climb, my line was unnecessarily long above the valley where the air was rapidly descending. The trace shows that my glide slope here was much worse than Zach’s. Once across the Colorado, I picked a more easterly line with more clouds (2), hoping the extra detour over the higher terrain of the Flattops and the Park Range would pay off compared to Zach’s shorter and more direct route across the Yampa Valley. Evidently my calculation did not pay off. (3) Towards the end of the leg, I made another significant course deviation towards good looking clouds near Medicine Bow Peak. I knew this was a substantial deviation and that it would cost me time but I did not feel comfortable relying on the few poorly looking clouds along the more direct task line.
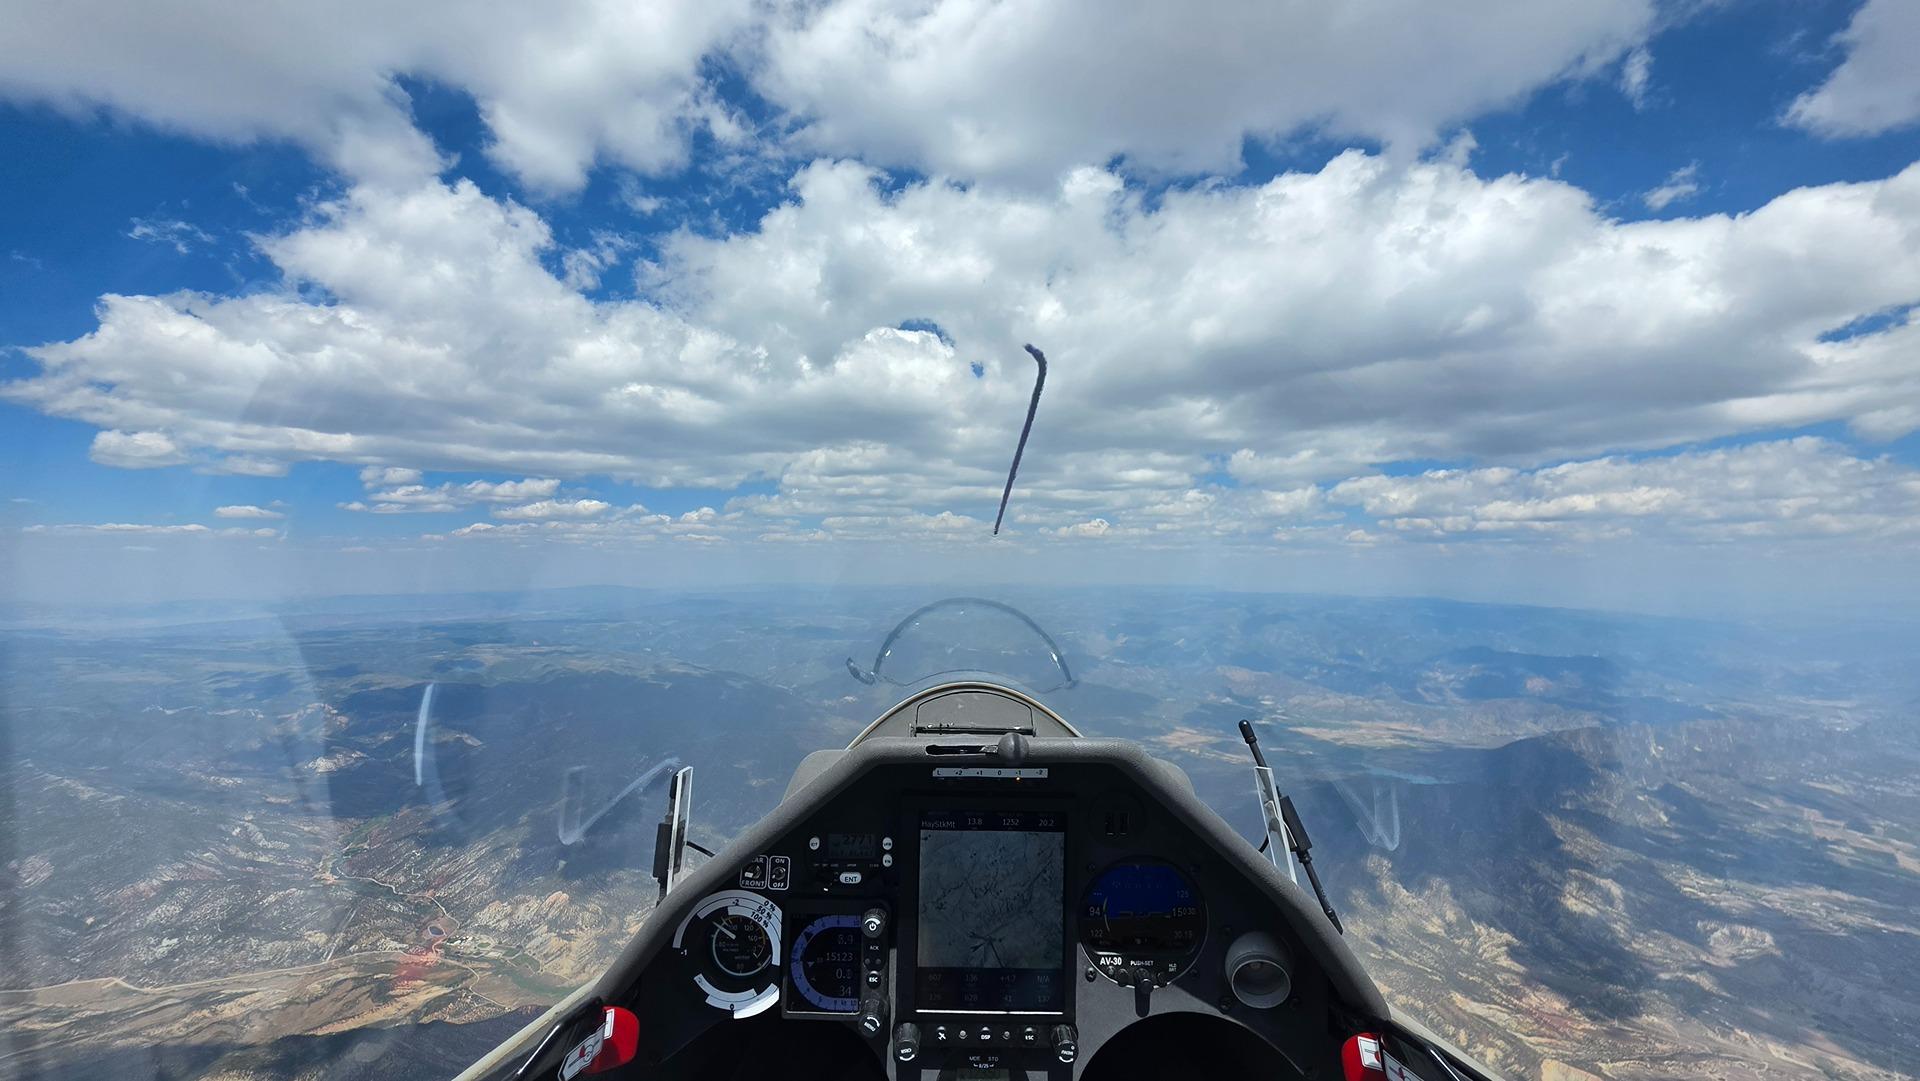
Leg 4 (ElkMt-NiwotMt): My Netto here was 1.6kts vs Zach’s 3.4kts — 53% lower, the largest relative Netto gap of any leg. That translated to a straight-line altitude deficit of about 3,000 ft. But since it’s the final leg, I didn’t spend the time to fully climb that back out — I replaced only about 1,073 ft of it via extra circling (with a climb rate 37% slower than Zach’s, 4.9 vs 7.8kts) and simply rode the rest to a lower finish, ending the leg down 1,817 ft net versus Zach’s +637 ft. I also deviated notably less (6.9% vs 12.4%) but flew slower on the glides (GS 214 vs 224), which roughly cancelled out on the straight-line time difference.
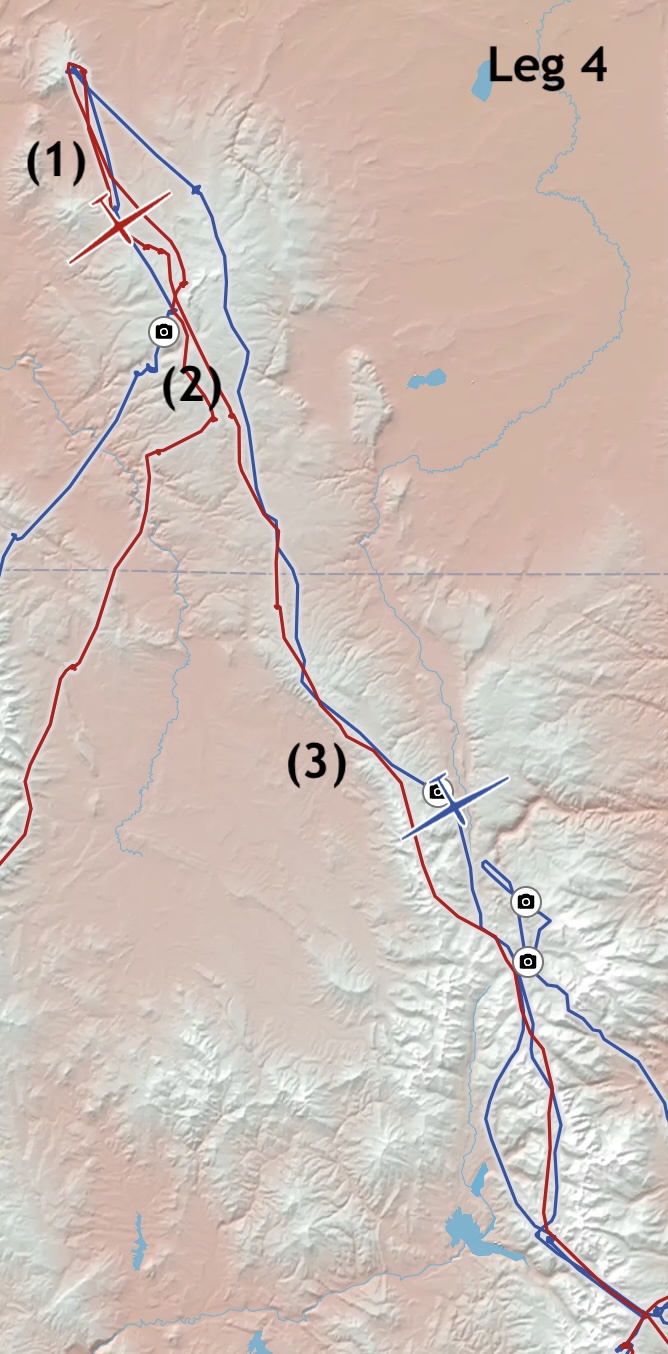
A big factor here was that after the last turnpoint, I backtracked to the same clouds I had left coming into the turn (1). By comparison, Zach took a beeline to the clouds further east which marked the convergence. I had actively considered doing the same but felt uncomfortable with my altitude and took a route which I considered more reliable (based on having just flown through the same air) even though it had the potential to be slower. This choice was consequential because (2) it kept me further west and it took me about 100km of flying on Leg 3 before I finally joined up with the optimal convergence. I am not surprised at all about the results. (3) On the final part of the leg, a contributing performance factor was likely the late time of the day – I could see and feel the line getting considerably weaker over the last 30 minutes or so.
What Lessons Can Be Learned From This Analysis?
- It demonstrated that two gliders that appear to be so different as a 26.5m Nimbus 4 and an 18m Ventus 3 are not so different after all as long as water ballast is used to equalize the wing loading. They look like apples and oranges but perform like two similar apples.
- It confirmed once again that when two gliders are more or less equally matched, the performance difference comes down to the same key factors: (1) the choice of flight path to fly in rising air, and (2) the pilot’s ability to select the best thermals and circle efficiently to obtain the best climb rate. In most contests, these two factors play the dominant role. In this case, they were the only significant factors. The two other possible factors, (3) course deviations and (4) altitude difference each had a very small effect and together netted out to almost nothing.
- In this case the choice of flight path (factor 1) was far more important than the difference in climb rates (factor 2). It accounted for 83% of the performance difference. The variance in climb rates accounted for almost all of the remaining 17%.
- When conditions are strong, it is very likely that the pilot’s ability to fly in rising air is the dominant factor. Why? Firstly, in strong conditions there are naturally bigger atmospheric differences in the vertical movement of air masses. Secondly, the stronger the thermals, the less significant variances in climb rate become. (Remember to do the math how long it takes to climb 3000 ft at different climb rates; then compare the results!)
- The weaker the conditions (and the longer it takes to climb) the more important variances in climb rate are.
- If you’re trying to improve your performance, understanding what factors accounted for the performance gap is necessary. However, it is also insufficient.
- While it is relatively easy to work on improving your climbing performance (all factors – thermal selection, centering, small turn radius at optimum air speed and bank angle, avoiding getting low and be forced to take weak climbs, minimizing trials – are well understood and don’t have to be explained in more detail here), it is much harder (but often much more important) to improve your ability to find the best lines.
- The method I used here – comparing the course line and reflecting on the different decisions to better understand what drove Zach’s superior Netto performance on three of the legs – has been quite helpful. However, it still involves quite a bit of guesswork and assumptions. And it reminds me that soaring is not just science and mechanics but also an art. Much comes down to intuition. There is always an opportunity to hone and improve it over time. That’s part of what makes it so fun.
Before I started my analysis I asked myself: what will I need to do differently to keep up with Zach? Is it even possible? Well, for one I’ve confirmed that it’s not the glider that makes the difference. And I’ve learned that my biggest opportunity lies in finding and following the best lines. However, the “line” is of course the result of hundreds of small navigation decisions throughout the flight and there is no simple recipe to find the best one. So keeping up with Zach should be possible. But I have to get better at finding that optimal line. Flying together and comparing the results has certainly been a good start.
PS: A week later, on Aug 7 2026, Zach and I flew another set of 1000+ km tasks. (Caveat: our two tasks were substantially similar but not identical. Here they are: Zach-YA, Clemens-CC.) This time, I was able to beat him on average speed (150 kph vs 143 kph task speed) which shows that I do have a fighting chance. 🙂 However, once again Zach picked the better lines, which is reflected in his superior Netto value (2.4 kts vs. 1.1 kts). The better Netto gave Zach an 11 minute advantage across the flight, but I was able to make this up with a better average climb rate (6.6 kts vs 6.0 kts). I think the real reason I beat Zach overall was that he started the task about 30 minutes earlier when conditions were still weaker. This prompted him to make substantially more course deviations (12.9% vs 7.7%), which cost him 16 minutes. The weaker conditions may also have caused him to fly more slowly (IAS of 170 kph vs my 178 kph) costing him over 10 minutes. Altitude differences were once again negligible. (Note also, that this time I flew with a take off mass of 560 kg which gave me a slightly higher wing loading (51.6 kg/sqm compared to Zach’s 51.2 kg/sqm) – certainly a contributing factor to my overall higher cruise speed.) It’ll be fun to keep flying together. 🙂
Final admin note: some true nerds may notice that the reported data (e.g. climb rates) don’t always match exactly what WeGlide reports. That’s because I used SeeYou for the analysis and the methodologies SeeYou uses differ slightly from WeGlide.
Ehrgeiz ist eine gute Sache … aber zuviel davon macht krank.
Er ist halt rechts geflogen, Sie links – so ist das beim Segelfliegen. Aber wenn man gegen ein fast 20 Jahre älteres Flugzeug verliert ist hilft es nicht sich über viele Seiten zu rechtfertigen und zu hoffen da irgendwie für einen selbst rauszukommen. Einige Tage später war es ja genau anders herum…
Die enormen fliegerischen Leistungen sind beeindruckend, aber mit etwas mehr Bescheidenheit wären sie noch imposanter.
Nicht zu ernst nehmen – besonders bei einem Hobby.
Hallo Jakob – bitte nicht falsch verstehen – hier geht’s ja überhaupt nicht darum irgendetwas zu rechtfertigen. Sondern einzig darum draufzukommen, was wer anderer besser macht. 🙂 Für mich ist das halt einfach interessant. Es kann auch sein, dass ich bei der Analyse Fehler mache und die Veröffentlichung hilft hier draufzukommen. ZB hat mir Uroš Bergant zurückgeschrieben dass die von SeeYou ermittelten Netto Werte möglicherweise nicht richtig sind. Dem will ich noch auf den Grund gehen weil es die Schlussfolgerungen deutlich verändern könnte. 🙂 Aber du hast schon recht, das ganze ist nur ein Hobby. Für mich gehört’s halt zum Spass draufzukommen was man besser machen kann. Wenn’s wem zu viel ist, bitte einfach ignorieren. 🙂
Hi Clemens
Natürlich ist es sehr in interessant und lehrreich die Flüge zu analysieren…
…aber es ist ein Hauch von übermässigen Ehrgeiz sichtbar…
Die meisten Top-US Segelflugpiloten fliegen Rekord-Flüge, stellen sie oft kommentarlos ins Netz – und beeindrucken so auf ihre Weise. Jeder kann sich aussuchen was angenehmer ist.
Happy Landings!
Jakob – wie schon erwähnt schreibe ich nicht um irgendwen zu beeindrucken, sondern um selbst weiter zu lernen. Es gibt viel bessere Piloten als mich und mich würde es freuen wenn auch sie mehr zu ihren Flügen schreiben damit ich und andere von ihnen lernen könnnen. Ich kann’s natürlich verstehen wenn sie das nicht tun. Zum einen ist es ziemlich viel Aufwand (dieser Artikel hat wohl so an die 20 Stunden gebraucht). Ausserdem muss man sich – wie man sieht – auch noch dafür rechtfertigen, nur weil’s halt jemandem als Anmassung oder Angeberei erscheint. Naja, ich denke mir das sind nur Ausnahmen und man kann’s nicht allen rechtmachen – versuche ich auch nicht 😉 Mir hilf halt die Veröffentlichung durch den peer review weil sie mich gleichermassen dazu zwingt die Analyse gründlicher zu machen als ich das vermutlich sonst tun würde und weil mir konstruktives Feedback hilft Fehler zu erkennen und fortan zu vermeiden. Aber wenn dir Flüge ohne Kommentar besser gefallen, dann lies halt die Kommentare nicht… zwingt dich ja niemand dazu 😉
Hi Clemens, ich finde es sehr interessant und lehrreich, Deine Analysen zu lesen (oder zu sehen). Es geht ja nur darum, sich zu verbessern, bis zu welchem Grad kann ja jeder für sich entscheiden. Keep up the good work, vielen Dank!
Danke! Ist ja auch so gemeint 🙂
Also timing is very important twenty minutes can be an entirely different airmass and clouds. Sporting risk also places a role. Great analysis and a lot to learn.
Very true.
Even just a few hundred feet of separation is enough. I launched too late to make it around the full course and cut the corner to intercept Zach on leg 2. There were many times where even within a few hundred feet of each other, one gets the bubble and the other doesn’t. But any time you have someone consistently picking the right line over long duration, it’s clearly the piloting skills and observation that are feeding that line selection. It’s very fun to fly together for long stretches. I think I need to go about another half pound of wing loading(11lbs/ft) to make running with the nimbus in the 100kt range a little easier.
Hi Clemens, you conclude that with the same wing loading the performance of both gliders will be more or less the same. I haven’t looked at the polars, but I’m wondering. Is this really the case? The faster the speed the more pronounced the deteriorating of the older Nimbus wing‘s L/D should be compared to your more modern wing. Is this compensated by the longer wing – higher initial L/D?
Hi Win – there’s no official published flight polar for the V3 available. One proxy are the polars that Condor uses for the two gliders. Those are almost identical if you equalize the wing loading. I have put in a request to Idaflieg to purchase their test results since they tested both Ventus 3 (albeit with the smaller sports fuselage) and the Nimbus 4. If I get their reports I may be able to shed more light on this. There is also a report in Nordic Gliding with some polar data for the V3 at different flap settings and I’ve looked at that too but the results so far are inconclusive. As mentioned I did not want to make this article about wing foil design – it’s a topic I know too little about – but rather try to find out why Zach has been beating me, especially with respect to finding the better lines, which I think has been the main difference. But, if the polar data are wrong, then, as Uros has pointed out to me, the netto numbers are not correct either, and there is a possibility that the conclusions are not as valid as I originally thought. Hopefully I get better polar data and can then take another look. Until then, this is all there is…
Since Zach and I flew half the second leg to the finish largely together, I can say that there is a significant difference in zoom climbs in good air when comparing equally loaded JS3 and Nimbus. Many hundreds of feet often times. In the case of big pulls, the mass and wing area just seem to allow for maximum transfer of kinetic to potential energy while grabbing that lift.
Meanwhile on the final leg of energetic convergence, I was finally able to pull ahead. Very subtle differences in routing and pulling made a fairly significant difference in that run.
Years of flying standard class (Discus A/Duo) has shown that those bubbly convergence lines seem to help equalize the performance between classes where you can stay in the sweet spot of the polar and bump along.
It will be interesting to see how things stack up on a stronger day where a few more knots of climb yield faster runs and maybe the wetted area of the Nimbus starts to factor in more.
It’s unfortunate that it is so damn far to come fly with you guys, Boulder was spectacular.
Thanks Morgan! I’m glad you enjoyed your trip to the Rockies. The weather isn’t the most consistent or reliable but when it’s good it can be really amazing – as you’ve seen. Interesting observations regarding energy transfer and running along the convergence. Thanks for sharing! And congrats on setting a new Colorado triangle speed record!
Hi Clemens,
thanks for the interesting article. For accurate polar data you could ask idaflieg for their measurements:
https://idaflieg.de/?page_id=88
Danke! Hab’ ich schon bekommen, hatte aber noch keine Zeit mich eingehend damit zu beschäftigen.
Hi Clemens,
Don’t know if you have noticed the stunning flights from Felix Herold this year. He simply destroys all other pilots on a given day in weglide (not in the SGP where he may need some more practice). Even world champions in a EB29. I had also the chance to fly sometimes with him in the southern alps (also Ventus 3M). I could follow him sometimes and had the impression that the glider performance is quite similar. No big difference. Same opinion as you have comparing them. But he simply nearly always makes the better decisions. And he is completely fearless.
So the old Nimbus 4 in the hand of a really good pilot still seems more than compatible to a lot of modern planes and a lot of glider for the money. If you can handle the size on the ground and the nightmare of rigging it.
Thanks for pointing to Felix. Seems like a very similar case. And yes, a Nimbus 4 is lot of glider performance for the money. Zach is surprisingly fast rigging it in less than a hour (on his own). Towing the Nimbus 4 full of water from our 5300 ft airfield in the summer (density altitude often 8000 ft) is a challenge too. These tows can take 45 minutes (to approx 10,500 ft or so) and Zach has to commit to launching well before the first cu appear to get a timely start.